Figure 1: Estimated consequences of changes in inequality (1985 – 2005) on subsequent cumulative growth (1990-2010)

Drawing on harmonised data covering the OECD countries over the past 30 years, the econometric analysis suggests that income inequality has a negative and statistically significant impact on subsequent growth.
In particular, what matters most is the gap between low income households and the rest of the population.
In contrast, no evidence is found that those with high incomes pulling away from the rest of the population harms growth.
The paper also evaluates the “human capital accumulation theory” finding evidence for human capital as a channel through which inequality may affect growth.
Analysis based on micro data from the Adult Skills Survey (PIAAC) shows that increased income disparities depress skills development among individuals with poorer parental education background, both in terms of the quantity of education attained (e.g. years of schooling), and in terms of its quality (i.e. skill proficiency).
Educational outcomes of individuals from richer backgrounds, however, are not affected by inequality.
via Trends in Income Inequality and its Impact on Economic Growth – Papers – OECD iLibrary.
The OECD analysis published overnight in Paris suggest that the increase in equality in New Zealand the late 1980s is still scarring economic growth today by about 15 percentage points in lost cumulative economic growth.
The analysis of the OECD published overnight depends crucially upon how greater inequality reduces the ability of the lower income families to invest in human capital:
The evidence strongly suggests that high inequality hinders the ability of individuals from low economic background to invest in their human capital, both in terms of the level of education but even more importantly in terms of the quality of education.
The OECD theory of inequality and lower growth is there is a financing constraint because of inequality that reduces economic growth because of less human capital accumulation by lower income families.
This is interesting because in 2002, with Pedro Carneiro, James Heckman showed that lack of credit is not a major constraint on the ability of young Americans to attend college. They found that credit constraints prevent, at most, 4% of the U.S. population from attending. Credit constraints is weakening as a rationale for a lack of an accumulation of human capital, and can be easily solved.

The OECD is putting a lot of their growth inequality nexus eggs in one basket. That student loans and other government interventions are not closing credit constraints on financing higher education.
To add to that basket , they are placing a lot of weight in human capital as a driver of growth, and in New Zealand’s case, of technology absorption, which is a main foundation of economic growth in New Zealand. The evidence that human capital is a key contributor to higher economic growth is weakening ruck rather than strengthening.
The trend rate of productivity growth did not accelerate over the 20th century despite a massive rise in investments in human capital and R&D because of the rising cost of discovering and adapting new technological knowledge. The number of both R&D workers and highly educated workers increased many-fold over the 20th century in New Zealand and other OECD member countries including the global industrial leaders such as the USA, Japan and major EU member states.
Higher education has been free for the low income families for several generations. Student loans are readily available. It is hard to believe that such a readily solvable problem is a major source of inequality and lower growth.
Cross-country differences in total factor productivity are due to differences in the technologies that are actually used by a country and the degree in the efficiency with which these technologies are used. Differences in total factor productivity, rather than differences in the amount of human capital or physical capital per worker explain the majority of cross-country differences in per capita real incomes (Lucas 1990; Caselli 2005; Prescott 1998; Hall and Jones 1999; Jones and Romer 2010).
Differences in the skills of the individual worker or in the total stock of human capital of all workers in a country cannot explain cross national differences in value added per worker at the industry level.
- The USA competes with Japan for productivity leadership in many manufacturing industries.
- The Japanese services sector productivity can be as little as a one-third of that of the USA.
- Japanese labour productivity is almost twice Germany’s in producing automobiles and is better that Germany by a large margin for many other manufactured goods.
- The USA is uniformly more productive in services sector labour productivity. For example, British, French and German telecom workers were 38 to 56 per cent as productive as their American counter-parts.
The USA, Japan, France, the UK and Germany all have relatively well-educated, experienced and tested labour forces. For example, the 1993 McKinsey’s study inquired into the education and skills levels of Japanese and German steel workers. Comparably skilled German steel workers were half as productive as their Japanese counterparts (Prescott and Parente 2000, 2005).
As for the source of the growing income inequality, there is a long literature dating back 25-years arguing that skill-biased technological change is increasing the returns to investing in education
Important is the OECD conclusion that inequality in terms of the rich getting richer does not harm growth. To make sure I have not misquoted them , I quote once again from their abstract, where the OECD summarises its own findings:
Drawing on harmonised data covering the OECD countries over the past 30 years, the econometric analysis suggests that income inequality has a negative and statistically significant impact on subsequent growth.
In particular, what matters most is the gap between low income households and the rest of the population.
In contrast, no evidence is found that those with high incomes pulling away from the rest of the population harms growth.
That conclusion of the OECD almost saves me from having to go on about how inequality has not increased in New Zealand for the last 20 years, see figure 2, and that the top 1% have not increased their share of income in recent decades – see figure 3. The fact that the rich can get richer without harming the poor is an important conclusion that will surely not be reported by the media.
Figure 2: Gini coefficient New Zealand 1980-2015

Figure 3: Top 1% income shares, USA, New Zealand and Australia, 1970-2012

Another inconvenience for the OECD is the last major increase in Gini coefficient in New Zealand was followed by a 15 year economic firm – see figures 2 and 4.
Figure 4: Real GDP per New Zealander and Australian aged 15-64, converted to 2013 price level with updated 2005 EKS purchasing power parities, 1956-2013

The NZ top 1% share has been steady at 8-9% since the mid-1990s see figure 4; the top 1%’s share rose strongly in the USA in recent decades, from 13% in the mid-1980s to 19% in 2012.
The Occupy crowd blame everything from the global financial crisis to a bad environment on growing inequality and the growing riches of living top 1%. Such an argument has no foundation in fact in New Zealand. The last major increase in Inequality was a long time ago in New Zealand.
The OECD is also rather casual about how policies to redistribute wealth and increasing incomes. While Western Europe is diverse, as a group, the higher taxes in the European Union reduced incentives to work. Employment as a percentage of the population has been consistently lower in Western Europe than in the USA since the 1950s, with an average employment rate gap of 10 percentage points over 1980-2007.
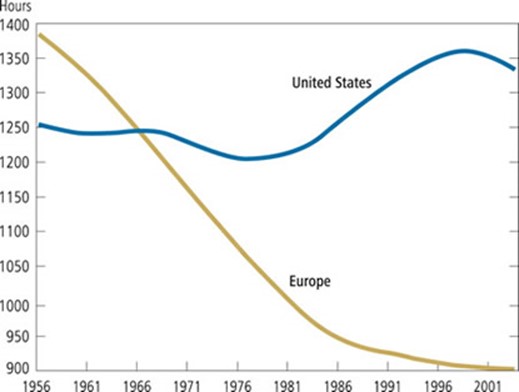
Large increases in taxes on income from labour since the 1970s, enhanced incentives for retire early, and the interaction of generous employment insurance with the larger skill losses among workers displaced by the greater economic turbulence since 1980 all acted to reduce both real GDP and hours worked per week per working age person by up to a third in Western Europe as compared to the USA since the 1970s (Prescott 2004, 2007; Rogerson 2006, 2008; Ohanian et al. 2008; Ljungqvist and Sargent 1998, 2007, 2008). For example, Ohanian, Rao and Rogerson 2008 in “Work and taxes: allocation of time in OECD countries” found that:
- A steep decline in average hours worked per adult and large variations across OECD member countries in the magnitude of this decline.
- Changes in labour taxes accounted for a large share of the trend differences.
- Countries with high tax rates devote less time to market work, but more time to home activities, such as cooking and cleaning.
- This reallocation of time from market work to home work is much stronger for females than for males.
Europeans pay more taxes, work fewer hours per year, have longer vacations, retire sooner, and invest less in human capital in an era in which trends in technology have significantly increased the demand for skilled workers, more innovation, more intense competition and greater entrepreneurial alertness. In The Impact of Labor Taxes on Labor Supply: An International Perspective (AEI Press, 2010) Rogerson finds that:
• a 10 percentage point increase in the tax rate on labour leads to a 10 to 15 per cent decrease in hours of work.
• Even a 5 per cent decrease in hours worked would mean a decline in labour output equating to a serious recession.
• While recessions are temporary, permanent changes in government spending patterns have long-lasting repercussions.
• Although government spending provides citizens with important benefits, such benefits must be weighed against the disincentive effects of increased labour taxes.
• Policymakers who fail to account for the decrease in labour output risk expanding government programs beyond their optimal scale.
Robert Lucas estimated in 1990 that eliminating all taxes on income from capital would increase the U.S. capital stock by about 35% and consumption by 7%.
Hans Fehr, Sabine Jokisch, Ashwin Kambhampati, and Laurence J. Kotlikoff (2014) found that eliminating the corporate income tax completely would raise the U.S. capital stock (machines and buildings) by 23%, output by 8% and the real wages of unskilled and skilled workers each by 12%.
In summary, this one paper by the OECD, which is a working paper makes profound conclusions about taxation and economic growth that contradict a large literature based on the lack of statistical significance of coefficients in the OECD’s regressions.
More fundamentally, linking lower economic growth to inequality through credit constraints on the human capital accumulation of the lower middle class is a weak reed to hang its argument. Human capital is not a good explanation of variations in growth across time or between countries.
What happened to income inequality in New Zealand in the late 1980s is not a credible explanation for lower growth 30 years later. Lower economic growth because of greater inequality is certainly an easy problem to solve if all that is required is more action on the financing constraint on human capital accumulation.


Recent Comments