Distance is common in many discussions of the relative growth performance of New Zealand. New Zealand is said to be small and remote and poorer for it. The figure below from a Productivity Commission report is an example.
The Productivity Commission put it this way:
New Zealand firms face reduced access to large markets and limited participation in global value chains, where the transfer of advanced technologies now often occurs.
Indeed, global value chains – which can require intensive interaction and just-in-time delivery across borders – may have worsened the impact of New Zealand’s geographic isolation on trade in goods.
The Commission continues on to say that:
These limits on trade and the diffusion of new ideas into New Zealand may explain as much as 15 percentage points of the 27% productivity gap between New Zealand and the average of 20 OECD countries.
This 15 per cent claim is a daring claim. Physical location does not change over time.
New Zealand, Australia and the other European offshoots such as Canada and the USA all prospered for most to all their histories despite their distances from their mother country. Canada cannot blame distance for its weak productivity performance because it is next door to the USA.
Figure 1 below using OECD data suggests that New Zealand and Australian real GDP per capita are both about 10 percentage points lower than they otherwise would be because of distance. A bounty of natural resources gives a less than a two per cent boost to Australia’s real GDP per capita, see Figure 1.
Figure 1: Estimated impact of proximity to markets and natural resources on real GDP per capita, OECD members, average for 2000-2004
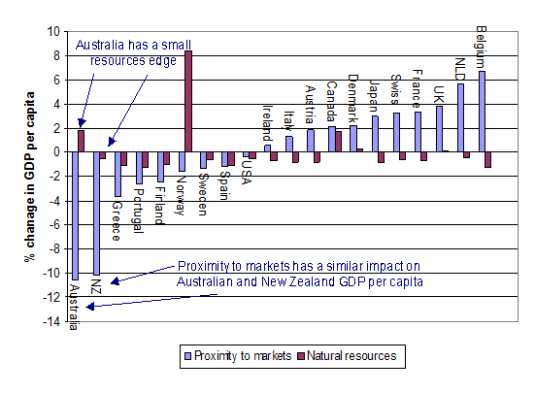
Source: OECD.
The burden of geography is about distance from large agglomerations of production, consumption and supply. There is from the extra cost of exporting to distant markets and the cost penalty from ordering from major suppliers who are far way. Geography can also affect the international flow of ideas and the diffusion of new technologies.
Figure 2 shows that most of the labour productivity gap of New Zealand and many others with the USA is not explained by geography – by access to major markets and any natural resource bounty.
Figure 2: Apparent and geography adjusted hourly labour productivity relative to the USA, 2006
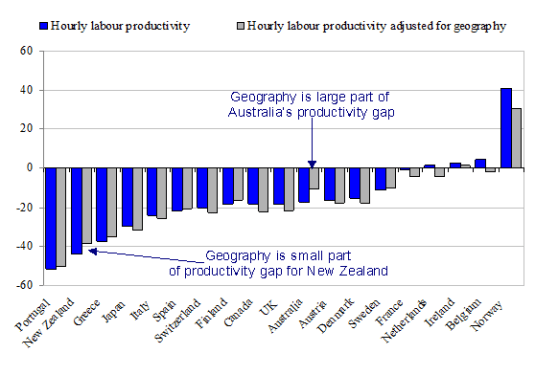
Source: OECD (2008).
New Zealand’s apparent and geography adjusted productivity gaps with the USA are not far apart. In contrast, the OECD (2009c), geography cuts in half the gap in hourly labour productivity between the USA and Australia – see Figure 3.
Figure 3: Percentage point change in hourly labour productivity relative to the USA due to geography, 2006
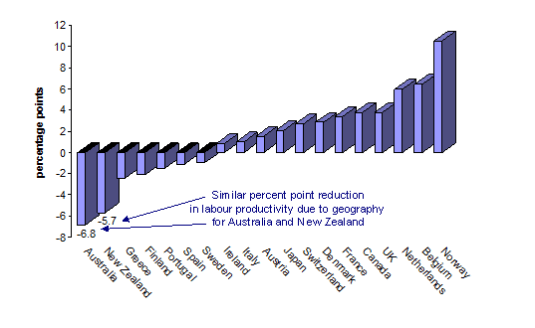
Source: OECD.
The labour productivity gap of New Zealand with the USA is over four times larger than what could be reasonably attributed to geographic burdens. Other factors must account for the bulk of New Zealand’s productivity gap.
More to the point, distance and remoteness explain none of the productivity and income gaps across the Tasman and why this gap suddenly appeared in the 1970s and 1980s to NZ’s disadvantage.
New Zealand lost almost two decades of growth between 1974 and 1992 as shown in Figure 4.
Figure 4: Real GDP per New Zealander and Australian aged 15-64, converted to 2013 price levels with updated 2005 EKS purchasing power parities, 1956-2012
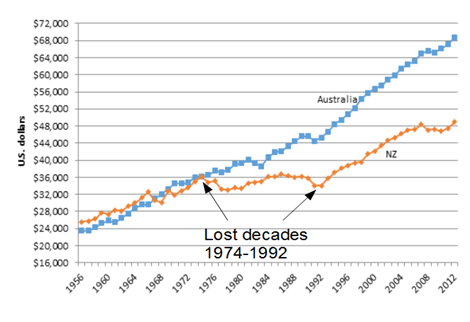
Source: Computed from OECD StatExtract and The Conference Board, Total Database, January 2014.
The Trans-Tasman gap is the income and productivity gap that concerns Kiwis and is the relevant policy yardstick everyone uses or should use.
The emergence of the Trans-Tasman income gap from initial income parity in 1974 – see Figure 4 – cannot be because of distance because both NZ and Australia suffer equally from a 10% productivity burden because of distance.
This common 10% productivity burden due to distance does not explain real GDP per working age person in Australia and NZ dropping from parity in 1974 to a 35% gap inside 20 years and then suddenly stabilising.
Figure 4 showed that NZ started growing again in 1992 after the Ruth Richardson horror budget stabilised economic policy sentiments. There was to be no going back on the economic reforms.
Figure 5 below shows that NZ’s labour productivity growth dropped like a stone between 1974 and 1992 then stabilised at 1.85% growth per year from 1992 to 2005. GDP per working age person in Figure 5 is based to 100 in 1974 and then detrended by 1.85% per year – the trend growth rate of the USA in the 20th century. A flat line in Figure 5 is annual growth in real GDP per working age person of 1.85%. Australia’s growth rate is pretty flat since 1970 bar the odd recession and recovery from the same.
Figure 5: Real GDP per New Zealander and Australian aged 15-64, converted to 2013 price levels with updated 2005 EKS purchasing power parities, base 100 in 1974, 1.85 per cent detrending, 1956-2012
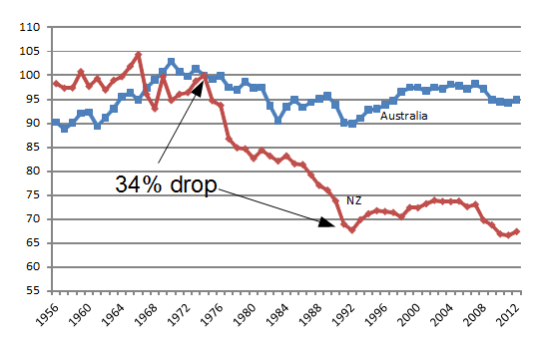
Source: Computed from OECD StatExtract and The Conference Board, Total Database, January 2014.
This 34% productivity drop in NZ from 1974 to the mid-1980s was too rapid to be explained by distance and global value chains suddenly becoming more important than was the case for most of NZ’s history. Australian GDP growth rates was not affected in the slightest by these trends in the geography of trade and input markets.
The Productivity Commission looked at the wrong data to ask the wrong questions. The data analysis undertaken on behalf of the Productivity Commission started in 1980. Figure 6 below shows at all the action and excitement regarding total factor productivity in New Zealand occurred before 1980.
Figure 6: New Zealand total factor productivity and real GDP per New Zealander aged 15-64, 2 per cent detrended, 1955-2000
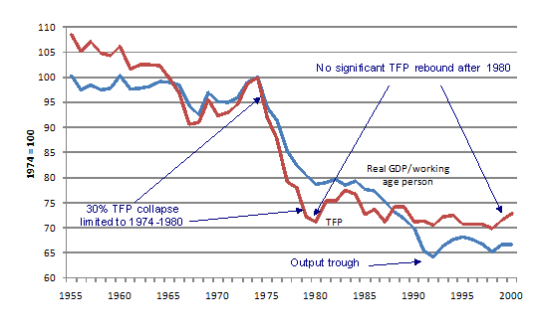
Source: Kehoe and Ruhl (2003).
Kehoe and Ruhl (2003) attributed the decline in the growth of GDP per working age New Zealander after 1974 to 1992 to a sharp decline in total factor productivity from 1974 to 1980.
Figure 6 plots detrended data constructed by Kehoe and Ruhl (2003) to show that total factor productivity fell rapidly in New Zealand between 1974 and 1980, by 30 per cent in all, and then levelled out to grow again at the trend rate of two per cent.
There was no subsequent total factor productivity recovery to make up the lost ground. If this were so, Figure 4 would have had to include a strongly rising line for total factor productivity over many years after 1980 to recover the 30 per cent fall in the level of total factor productivity between 1974 and 1980.
Kehoe and Ruhl (2003) suggested that the identification of the factors that permanently reduced total factor productivity levels in New Zealand between 1974 and 1980 may have great contemporary policy relevance.
The total factor productivity drop identified by Kehoe and Ruhl (2003) occurred before the 1978 start of the Statistics New Zealand productivity data series.
The great value of the Kehoe and Ruhl (2003) data is the drawing out of the major decline in total factor productivity on the eve of the Statistics New Zealand data series.
Kehoe and Ruhl (2003) attributed the 1970s total factor productivity collapse to a massive change in trade patterns after the entry of the UK into the then European Economic Community in 1973.
All discussions of income gaps should be against Australia and any additional burden of distance that New Zealand faces in addition to Australia since 1974 when the Trans-Tasman income gap emerged.
When New Zealand catches-up with Australia in labour productivity that will be the time to start worrying about the burden of geography – a burden that holds back relative productivity equally in both countries. You cannot explain the difference between Australia’s and NZ’s relative productivity by geographic factors they have in common.


Recent Comments