19 Sep 2015
by Jim Rose
in discrimination, econometerics, economic history, gender, human capital, labour economics, labour supply, poverty and inequality
Tags: female labour force participation, gender wage gap, male labour force participation, middle class stagnation, middle-class stand nation, wage stagnation
Few labour markets statistics make much sense unless broken down by gender.
Wages growth is no exception with female wages growth quite good for a long period of time after the 1970s – a period in which male earnings stagnated.
The beginning of male wage stagnation seemed to coincide with the closing of the gender wage gap.
Presumably if men were previously profiting from patriarchy, that should have some implications for future wage growth and promotions for men as women catch up.
Presumably if men were previously profiting from patriarchy, that should have some implications for future wage growth for men as women catch up. Men lost the wage premium they previously earned from the sex discrimination directly in hiring, wage setting and promotions and investing in more education because they expected to be discriminated favourably at the expense of women.

Not surprisingly the convergence in the male-female wage ratios started in the 1970s which was the decade that male wage stagnation started.

The gender wage gap started converging again also pretty much in lockstep with the top 1% starting to grab higher and higher proportions of income.

Source: Alvaredo, Facundo, Anthony B. Atkinson, Thomas Piketty and Emmanuel Saez, The World Top Incomes Database.
24 Jul 2015
by Jim Rose
in business cycles, econometerics, economic growth, economic history, job search and matching, labour economics, labour supply, macroeconomics, politics - New Zealand, Public Choice, unemployment, unions, welfare reform
Tags: antimarket bias, Don Brash, economic reform, expressive voting, Homer Simpson, Leftover Left, lost decades, makework bias, neoliberalism, rational ignorance, rational irrationality, Sir Roger Douglas, Twitter left
Today, Closing The Gap – The Income Inequality Project boldly claimed today that there was next to no unemployment in New Zealand prior to the onset of the curse of neoliberalism.

There is an Internet on computers now where it is easy to find data showing that the unemployment rate was rising rapidly in New Zealand in the 1970s and in double digits by the end of the 1980s – see figure 1.
Figure 1: harmonised unemployment rates, Australia and New Zealand, 1956-2014

Source: OECD StatExtract.
Figure 1 shows unemployment was rising rapidly in the 1970s and wasn’t much different by the end of the 1970s to the unemployment rates recorded after about 2000 in New Zealand.

One of the reasons that Sir Roger Douglas wrote There’s Got To Be A Better Way was the rapidly rising unemployment in New Zealand and the stagnant economic growth in the late 1970s and early 1980s.

New Zealand was one of the most regulated economies, so much so that Prime Minister David Lange said:
We ended up being run very similarly to a Polish shipyard.
As for those jobs on the railways, the then Reserve Bank Governor Don Brash said in 1996:
Railways cut its freight rates by 50 percent in real terms between 1983 and 1990, reduced its staff by 60 percent, and made an operating profit in 1989/90, the first for six years.
10 Jul 2015
by Jim Rose
in applied price theory, applied welfare economics, econometerics, income redistribution, politics - Australia, politics - New Zealand, politics - USA, Public Choice, rentseeking
Tags: activists, British economy, British politics, do gooders, expressive voting, living wage, rational ignorance, rational irrationality, The fatal conceit, The pretence to knowledge, unintended consequences
27 Jun 2015
by Jim Rose
in development economics, econometerics, economic history, growth disasters, growth miracles
Tags: India, measurement error, national accounts

Maxim Pinkovskiy and Xavier Sala-i-Martin last year suggested that national accounting estimates of poverty should be adjusted for the evolution of satellite-recorded night-time lights. I agree from personal experience.
In India between 1994 and 2010, its survey income grew by 29% but its GDP per capita more than doubled during this time. We see that lights in India increase dramatically both in their intensity over the major cities as well as in their extent over previously dark areas of the country. This suggests that the GDP estimate is a more accurate assessment of economic development of India and the faster reduction of poverty than income surveys suggest.

Source: The Conference Board. 2015. The Conference Board Total Economy Database™, May 2015, http://www.conference-board.org/data/economydatabase/
National accounting data on real GDP, PPP would suggest that Indonesia is a much wealthier country than the Philippines. The Philippines from about the late 1998, has had rapid economic growth, but so has Indonesia. I first visited the Philippines in 1997. I have never visited Indonesia.

When I first visited my parents-in-law in the Philippines in 1998, that part of Leyte had no sealed roads and no phones.
The next time I visited, the road was being sealed and mobile reception was better if you had an aerial on the roof.
After a five year gap in visiting, not only was mobile reception good, there was cable TV if you wanted it. When I visited in 2012, there was wireless internet if you had outside aerial.
Christmas before last, we hot spotted off my sister-in-law’s mobile. Neighbours have Skype if we want to say hello. I don’t know how that rapid change in economic fortunes is captured accurately in national accounting figures.
22 Apr 2015
by Jim Rose
in econometerics, inflation targeting, macroeconomics, politics - USA
Tags: CPI bias
All agree that the consumer price index (CPI) is biased and overstates inflation. In 1996, economists hired by the Senate Finance Committee estimated that the U.S. CPI overstates annual inflation by 1.1% (Boskin et al. 1996). That estimated CPI bias has not gotten smaller with time. It is now up to 1.5%, even 2%.
The main biases in the consumer price index everywhere come from how to handle changes in the quality of goods and services and how to deal with completely new goods and services.
I thought I might see what happened if I took account of this one and a half percentage point annual bias because of new goods, quality variation and other known biases in the CPI estimates for the USA, UK and Japan in the relevant OECD StatExtract database for annual CPI inflation.

Source: OECD StatExtract.
Taking into account new good and quality bias, Japan is been in serious deflation for quite some time now – at least 20 years. Japanese inflation went positive in the last year or two because I believe they increased their consumption tax.
The USA has a low inflation for about 20 years. The UK had no inflation for about seven years from 1997 then it started to rise again until 2012.
People get hot and bothered with deflation. Breathless journalism aside, fears of inflation are just a legacy of the great depression in the 1930s.
The only depression where deflation was accompanied by mass unemployment was the Great Depression. Mild deflation with good growth is a common phenomenon as Atkinson and Kehoe found:
Are deflation and depression empirically linked? No, concludes a broad historical study of inflation and real output growth rates. Deflation and depression do seem to have been linked during the 1930s. But in the rest of the data for 17 countries and more than 100 years, there is virtually no evidence of such a link.
26 Mar 2015
by Jim Rose
in discrimination, econometerics, gender, labour economics, labour supply, occupational choice, politics - New Zealand
The OECD puts the gender wage gap in New Zealand at about 6% for full-time employees on an hourly basis when measured using median earnings.
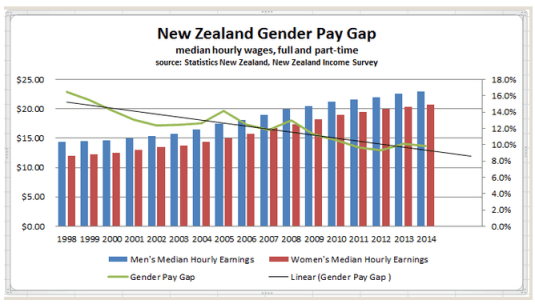
The Ministry of Women’s Affairs puts that gender wage gap estimate at 9.9% by measuring median hourly earnings, but the Ministry includes both full-time and part-time employees.
Conflating full-time and part-time earnings when measuring wage gaps is unwise. The level of compensating differentials in full-time and part-time jobs differ. More of the net pay package of a part-time job would be convenience and flexibility. A full-time job tends to indicate greater commitment to the labour force day in day out and less interest in flexibility and time off during the week.
Previous Older Entries Next Newer Entries


Recent Comments