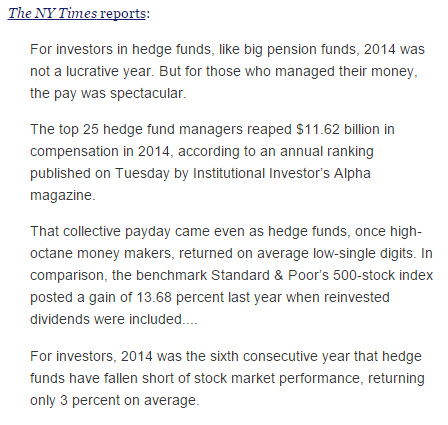
Greg Mankiw: Why I invest in index funds
09 May 2015 Leave a comment
in applied price theory, economic history, entrepreneurship, financial economics Tags: active investing, efficient markets hypothesis, entrepreneurial alertness, Greg Mankiw, passive investing
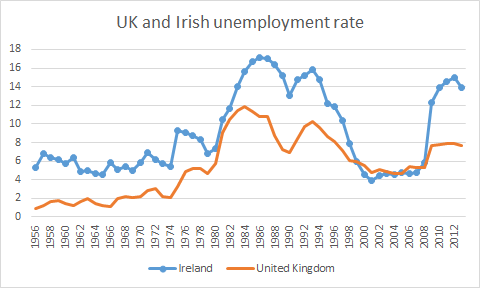
The sick men of Europe? British and Irish unemployment rates, 1956–2013
09 May 2015 Leave a comment
in economic growth, economic history, great depression, job search and matching, labour economics, labour supply, macroeconomics, unemployment Tags: British economy, Celtic Tiger, Ireland, prosperity and depression, sick man of Europe, unemployment rates
Source: OECD StatExtract
Ireland and Britain justly earned the name the sick man of Europe in the 1980s. Irish unemployment was in the mid teens much of the 1980s because the Irish economy was in a great depression from 1973 to 1992.
Unemployed people are defined as those who report that they are without work, that they are available for work and that they have taken active steps to find work in the last four weeks. The ILO Guidelines specify what actions count as active steps to find work; these include answering vacancy notices, visiting factories, construction sites and other places of work, and placing advertisements in the press as well as registering with labour offices.
VE Day versus Europe at the height of Nazi occupation
08 May 2015 Leave a comment
in economic history, war and peace Tags: Nazi Germany, VE Day, World War II
It's the 70th anniversary of VE day today – a look at how bleak things looked in 1941-42 brilliantmaps.com/what-if-nazi-g… http://t.co/F9qmzdLBfz—
Brilliant Maps (@BrilliantMaps) May 08, 2015
The price of air conditioning in the good old days
08 May 2015 Leave a comment
in economic history, technological progress Tags: good old days, living standards, The Great Enrichment
Two booms, two depressions: British and Irish real GDP detrended, 1955–2013
07 May 2015 1 Comment
in business cycles, economic growth, economic history, entrepreneurship, global financial crisis (GFC), great depression, macroeconomics Tags: British disease, British economy, Celtic Tiger, Ireland, prosperity and depression, sick man of Europe
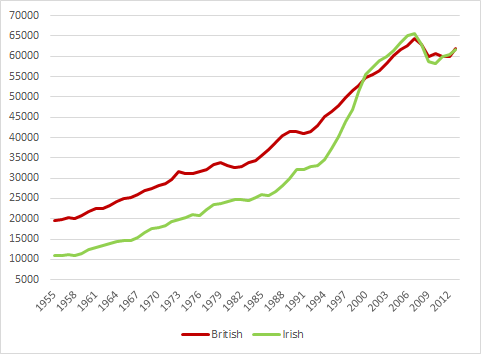
Figure 1: Real GDP per British and Irish aged 15-64, converted to 2013 price level with updated 2005 EKS purchasing power parities, 1955-2013
Source: Computed from OECD Stat Extract and The Conference Board, Total Database, January 2014, http://www.conference-board.org/economics
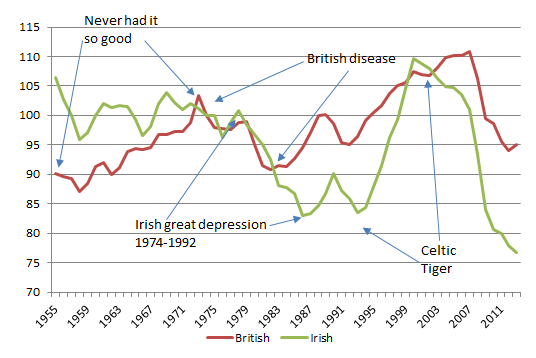
Figure 2 detrends British real GDP growth since 1955 by 1.9% and Irish real GDP growth by 3.6%. The US real GDP growth in the 20th century is used as the measure of the global technological frontier growing at trend rate of 1.9% in the 20th century. The Irish economy is more complicated story because its growth rate in figure 2 was detrended at a rate of 3.6% because it was catching up from a very low base. Trend GDP growth per working age Irish for 1960-73 was 3.6 per cent (Ahearne et al. 2006).
Figure 2: Real GDP per British and Irish aged 15-64, converted to 2013 price level with updated 2005 EKS purchasing power parities, 1.9 per cent detrended UK, 3.6% detrended Ireland, 1955-2013
Source: Computed from OECD Stat Extract and The Conference Board, Total Database, January 2014, http://www.conference-board.org/economics
A flat line in figure 2 indicates growth at 1.9% for that year. A rising line in figure 2 means above-trend growth; a falling line means below trend growth for that year.
In the 1950s, Britain was growing quickly that the Prime Minister of the time campaigned on the slogan you never had it so good.
By the 1970s, and two spells of labour governments, Britain was the sick man of Europe culminating with the Winter of Discontent of 1978–1979. What happened? The British disease resulted in a 10% drop in output relative to trend in the 1970s, which counts as a depression – see figure 2 .
Prescott’s definition of a depression is when the economy is significantly below trend, the economy is in a depression. A great depression is a depression that is deep, rapid and enduring:
- There is at least one year in which output per working age person is at least 20 percent below trend; and
- there is at least one year in the first decade of the great depression in which output per working age person is at least 15 percent below trend; and
- There is no significant recovery during the period in the sense that there is no subperiod of a decade or longer in which the growth of output per working age person returns to rates of 2 percent or better.
The British disease in the 1970s bordered on a depression. There was then a strong recovery through the early-1980s with above trend growth from the early 1980s until 2006 with one recession in between in 1990. So much for the curse of Thatchernomics?
Figure 1 suggests a steady economic course in Ireland until the 1990s with a growth explosion growth with the Irish converged on British living standards up until the global financial crisis.
Figure 2 shows the power of detrending GDP growth and why Ireland was known as the sick man of Europe in the 1970s and 1980s with unemployment as high as 18% and mass migration again. The Irish population did not grow for about 60 years from 1926 because of mass migration.
Figure 2 shows that real GDP growth per working age Irish dropped below its 3.6 per cent trend for nearly 20 years from 1974 , but more than bounced back after 1992. The deepest trough was 18 per cent below trend and the final trough was in 1992 – see Figure 2.
The deviation from trend economic growth made the Irish depression from 1973 to 1992 comparable in depth and length to the 1930s depressions (Ahearne et al. 2006).
The Irish depression of 1973 to 1992 can be attributed to large increases in taxes and government expenditure and reduced productivity (Ahearne et al. 2006). There were two oil price shocks in the 1970s and many suspect Irish policy choices from 1973 to 1987.
There were three fiscal approaches: an aggressive fiscal expansion from 1977; tax-and-spend from 1981; and aggressive fiscal cuts from 1987 onwards. In the early 1980s, Irish CPI inflation at 21 per cent, public sector borrowing reached 20 per cent of GNP.
To rein in budget deficits, taxes as a share of GNP rose by 10 percentage points in seven years. The unemployment rate reached 17 per cent despite a surge in emigration. The rising tax burden raised wage demands, worsening unemployment. Government debt grew on some measures to 130 per cent of GNP in 1986 (Honohan and Walsh 2002).
From 1992, Ireland rebounded to resume catching-up with the USA. The Celtic Tiger was a recovery from a depression that was preceded by large cuts in taxes and government spending from the late 1980s (Ahearne et al. 2006). Others reach similar conclusions but avoid the depression word. Fortin (2002, p. 13) labelled Irish public finances in the 1970s and to the mid-1980s as a ‘black hole’.
Fortin (2002) and Honohan and Walsh (2002) disentangle the Irish recovery into a long-term productivity boom that had dated from the 1950s and 1960s, and a sudden short-term output and employment boom since 1993 following the late 1980s fiscal and monetary reforms.
Honohan and Walsh (2002) wrote of belated income and productivity convergence. The delay in income and productivity convergence came from poor Irish economic and fiscal policies in the 1970s and 1980s.
This was after economic reforms in the late 1950s and the 1960s that started a process of rapid productivity convergence after decades of stagnation and mass emigration; Ireland’s population was the same in 1926 and 1971. During the 1950s, up to 10 per cent of the Irish population migrated in 10 years.
In the 1990s, many foreign investors started invested in Ireland as an export platform into the EU to take advantage of a 12.5 per cent company tax rate on trading profits. Between 1985 and 2001, the top Irish income tax rate fell from 65 to 42 per cent, the standard company tax from 50 to 16 per cent and the capital gains tax rate from 60 to 20 per cent (Honohan and Walsh 2002).
What happened after the onset of the global financial crisis in Ireland and the UK are for a future blog posts.
By-election and death watch starts in the House of Commons tomorrow!
07 May 2015 Leave a comment
in constitutional political economy, economic history, politics, Public Choice Tags: British general election, by-elections
With a razor-thin majority likely after the British general election today, by-elections will be of unusual significance in Parliament of 650 middle-aged and older parliamentarians working under great stress with easy access to alcohol, food and little exercise. Backbench revolts will also take on a new meaning when there is a razor-thin majority.
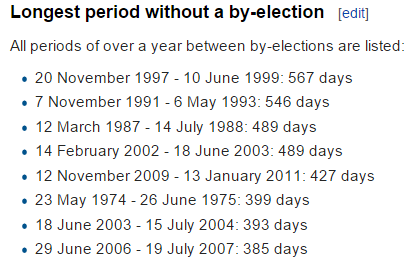
1992, 1998 and 2010 are the only calendar years in history without a single by-election in the House of Commons.
Peter Kellner’s final seat prediction – y-g.co/1byCjZ4 http://t.co/TFmg7vFUf0—
(@YouGov) May 06, 2015
The British Labour governments elected in 1964 and 1974 had small majorities. The majority was three seats after the 1974 election; four seats after the 1964 election. There was an early election in 1966 and two elections in 1974.
The Fixed Term Parliament Act rules out another general election unless a government is voted down on a motion of no confidence and another government is not formed within 14 days.
The Callaghan government fell on a no-confidence vote by one vote in 1979 after seeing its majority eroded by defeats in by-elections.

One of the jobs of the whips in the British House of Commons is to marshal sick and dying MPs for crucial votes. They have a rule that a vote of an MP goes in on the nod as long as his ambulance is parked in the speaker’s courtyard.
At least two ambulances were so parked when the Callaghan government lost its no confidence vote in 1979.
Legend has it that the Tory party whip prodded one of the patients in the back of the ambulance to check if he was still alive. He was so that the Tory whip told the Labour party whip ‘you lose’ and the Callaghan government fell by one vote.
Sir Alfred Broughton, a Labour MP who was on his death bed was not asked to come in despite offering to do so. He died four days after the vote.
Why tomorrow's UK election is looking good for Ed Miliband, via our majority-builder: econ.st/1IhUiBG http://t.co/zg6gFZq2eF—
The Economist (@EconBizFin) May 07, 2015
When asked to honour a gentlemen’s agreement about pairing sick MPs, Tory whip Bernard Weatherill said pairing had never been intended for votes on Matters of Confidence and it would be impossible to find a Conservative MP who would agree to abstain.
After a moment’s reflection, Weatherill offered to abstain because he felt it would be dishonourable to break his word to deputy Chief Whip for the Labour Party, Walter Harrison about pairing conventions, which was a gentlemen’s agreement.
Harrison was so impressed by Weatherill’s offer – which would have ended his political career – that he released Weatherill from his obligation and the Government fell by one vote on the agreement of gentlemen. Weatherill was later elected Speaker of the House of Commons.

When will capitalism abolish poverty?
06 May 2015 Leave a comment
in development economics, economic history, growth disasters, growth miracles Tags: capitalism and freedom, The Great Escape, The Great Fact
Global poverty is rapidly falling, says @BrookingsInst: buff.ly/1PM4Mdr #progress http://t.co/nGzbnxSHnp—
HumanProgress.org (@humanprogress) April 29, 2015
A history of commerce
06 May 2015 Leave a comment
in economic history, monetary economics Tags: mediums of exchange

The Great Fact in East Asia
05 May 2015 Leave a comment
in development economics, economic history, growth disasters, growth miracles Tags: The Great Escape, The Great Fact
https://twitter.com/humanprogress/status/594875847552675841/photo/1
As China grew freer economically, its poverty rate fell. buff.ly/1DiVIow http://t.co/8upmR6NUvV—
HumanProgress.org (@humanprogress) April 26, 2015
The ethnic groups of the Middle East
05 May 2015 Leave a comment
in economic history, economics of media and culture, economics of religion Tags: Middle-East politics


Post-war reconstruction then Eurosclerosis – Germany, Italy and France 1950-2013
04 May 2015 Leave a comment
in currency unions, economic growth, economic history, Euro crisis, macroeconomics Tags: Eurosclerosis, France, Germany, Italy, post-war reconstruction
Figure 1: Real GDP per German, Italian and French aged 15-64, converted to 2013 price level with updated 2005 EKS purchasing power parities, 1950-2013
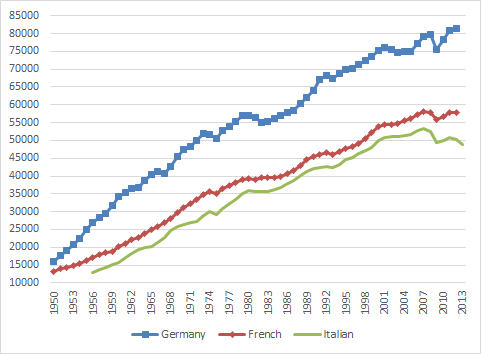
Source: Computed from OECD Stat Extract and The Conference Board, Total Database, January 2014, http://www.conference-board.org/economics
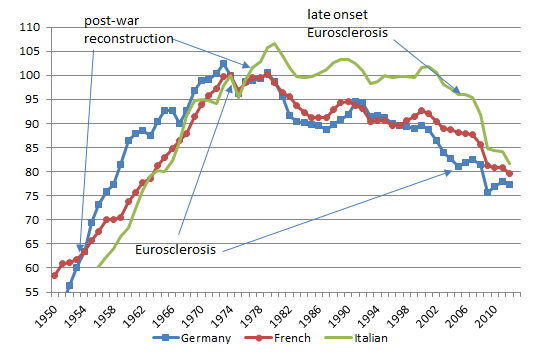
Figure 2: Real GDP per German, Italian and French aged 15-64, converted to 2013 price level with updated 2005 EKS purchasing power parities, 1.9 per cent detrended, 1950-2013
Source: Computed from OECD Stat Extract and The Conference Board, Total Database, January 2014, http://www.conference-board.org/economics
A flat line in figure 2 means real GDP growth of 1.9% per year, which is trend growth. A rising line means growth that is higher than trend rate; a falling line means growth at below the trend rate of 1.9%. 1.9% is the trend rate of growth of the USA in the 20th century. Figure 2 shows that:
- Germany, Italy and France all boomed until the mid-1970s;
- the French and German economies went into a long-term decline from that time; and
- the Italian economy stopped growing at anything more than the trend rate of growth between the mid-1970s and the mid-1990s and then went into a sharp decline that borders on the depression.


Recent Comments