Political outlooks and risk perception
29 Nov 2015 1 Comment
in applied welfare economics, economics of regulation, health economics Tags: anti-vaccination movement, expressive voting, GMOs, gun control, political psychology, risk risk trade-offs
Marijuana regulation: there are many options
27 Nov 2015 Leave a comment
in applied price theory, economics of crime, economics of media and culture, economics of regulation, industrial organisation, law and economics Tags: marijuana decriminalisation

@Maori_Party sold their people out to the NIMBYs
23 Nov 2015 Leave a comment
in applied price theory, economics of regulation, politics - New Zealand, urban economics
The Māori Party face the least political risks from deregulating land supply because so few Māori own their own homes. Less than half the rate of European New Zealanders. Māori home ownership rates peaked in 1991.
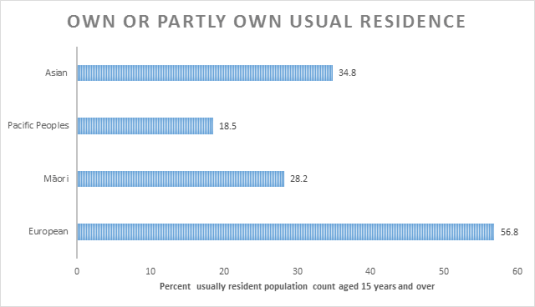
Source: 2013 Census QuickStats about housing.
Nonetheless, the Māori Party supplied the last two votes to vote down attempts to relax regulatory restrictions on the supply of land in New Zealand.
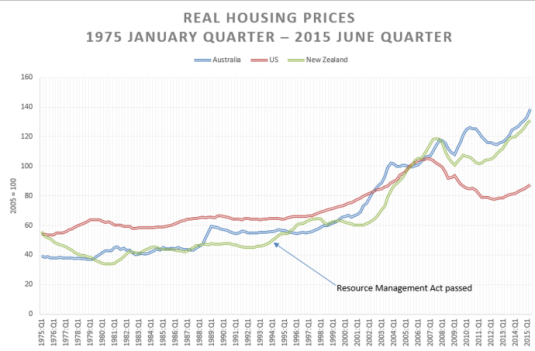
Source and notes: International House Price Database – Dallas Fed June 2015; nominal housing prices for each country is deflated by the personal consumption deflator for that country.
Their rationale for making land more expensive is a commitment to environmental principles. As the Māori Party coleader explained at the time:
We know there is considerable pressure and need for this Government to address the housing shortage, particularly in Auckland. However, one intent of the RMA, is to protect our environment for generations to come and this must remain paramount.
The 2014 policy manifesto of the party did not discuss housing supply or the need for reform of the RMA. It was mainly about social housing and the quality of rental house.
The chances of Māori increasing their homeownership rates rather than becoming leading members of Generation Rent requires a relaxation in restrictions in the RMA on the supply of land.
Auckland is up with London and New York in terms of housing unaffordability relative to median incomes. US cities with responsive land regulation don’t experience housing bubbles.
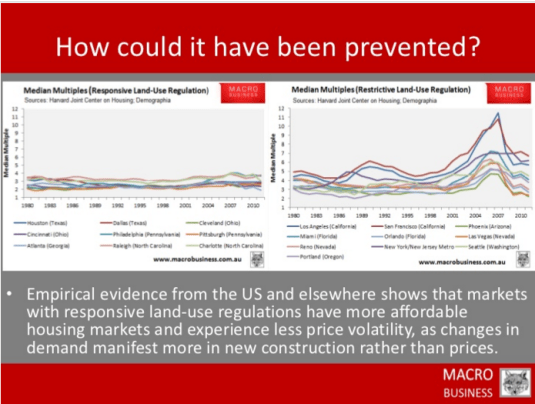
Glaeser and Gyourko summarised the findings of a number of studies on land supply and housing prices:
Recent research also indicates that house prices are more volatile, not just higher, in tightly regulated markets …. price bubbles are more likely to form in tightly regulated places, because the inelastic supply conditions that are created in part from strict local land-use regulation are an important factor in supporting ever larger price increases whenever demand is increasing. …. It is more difficult for house prices to become too disconnected from their fundamental production costs in lightly regulated markets because significant new supply quickly dampens prices, thereby busting any illusions market participants might have about the potential for ever larger price increases.
There has been a steady decline in housing affordability in New Zealand. The position is critical of the bottom 20% of the income ladder. Four in 10 now spend more than 30% of their disposable income on housing costs. Māori will be over-represented in this group but the party set-up to speak for them fails to do everything it can to make their housing cheaper.
Uber is creative destruction on steroids
23 Nov 2015 Leave a comment
in economics of regulation, entrepreneurship, industrial organisation, survivor principle Tags: creative destruction, entrepreneurial alertness, taxi regulation, Uber
Unlike @Subway @WalmartToday understands the #DHMO awareness campaign
19 Nov 2015 Leave a comment
in economics of media and culture, economics of regulation, environmental economics, health economics Tags: political satire, precautionary principle, Subway, Walmart

Banking crises are more common than you think
16 Nov 2015 Leave a comment
in currency unions, economic history, economics of regulation, Euro crisis, macroeconomics, monetary economics Tags: bank run, banking crises, banking panics, economics of banking, financial crises

@JohnQuiggin on “How New Zealand fell further behind” @FairnessNZ
15 Nov 2015 1 Comment
in applied welfare economics, economic growth, economic history, economics of regulation, fiscal policy, labour economics, politics - New Zealand Tags: Australia, John Quiggin, lost decades
Leading Australian academic economist John Quiggin has just published an article arguing that New Zealand should not be a policy role model for anything. To quote Quiggin:
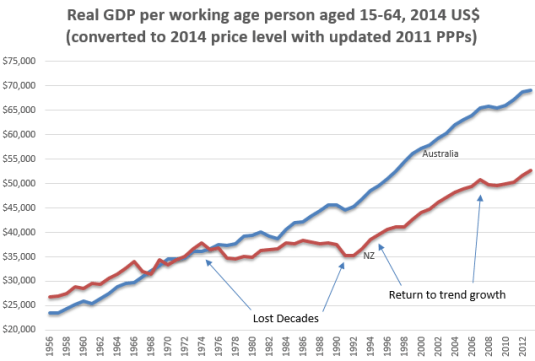
For most of the twentieth century, the New Zealand and Australian economies performed almost identically. New Zealand took a somewhat larger hit when Britain entered the European Common Market in the 1970s, but that impact has long since washed out. The real divergence came in the 1980s. Since then, New Zealand’s income per person has fallen 35 per cent behind Australia’s
He used Reserve Bank of New Zealand data going back to 1990, which is common starting point for most Reserve Bank data.
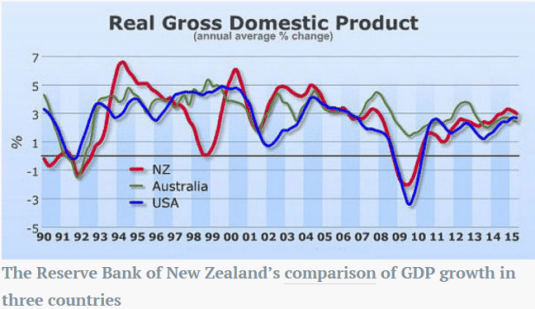
Source: John Quiggin “How New Zealand fell further behind”. Inside Story, 11 November 2015.
If he had taken that chart back to the 1970s and earlier using the Conference Board Total Database, Quiggin would have found that New Zealand economy diverged from Australia in the 1970s, not in the 1980s. His data from the Reserve Bank of New Zealand started at the low point in 1990 – at the end of that divergence that started in 1974. The New Zealand economy was depressed between 1974 and 1992. I label this Great Depression in New Zealand as New Zealand’s Lost Decades.
Source: Computed from OECD Stat Extract and The Conference Board. 2015. The Conference Board Total Economy Database™, May 2015, http://www.conference-board.org/data/economydatabase/
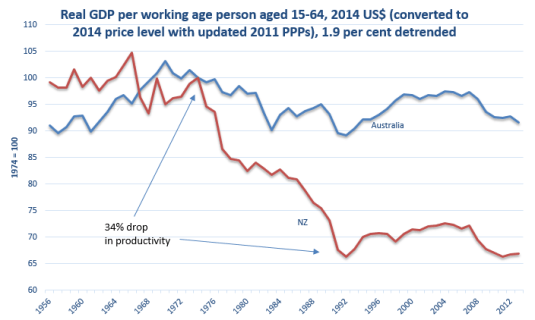
Real GDP PPP per working age New Zealander fell rapidly after 1974 (a 34% drop against trend) when that economy was a heavily regulated, highly taxed economy. This heavily regulated, highly taxed, economically stagnant New Zealand is the good old days in the eyes of the Twitter Left.
Source: Computed from OECD Stat Extract and The Conference Board. 2015. The Conference Board Total Economy Database™, May 2015, http://www.conference-board.org/data/economydatabase/
In the chart above, the base is 1974 which equals 100. A flat-line means annual growth equal to the trend rate of growth in the 20th century for the USA. A falling line means below trend growth; a rising line means above trend rate economic growth per working age Australian or New Zealander.
With the election of a National Party government in 1990 and a massive fiscal consolidation, New Zealand growth rate returned to the previous trend rate of 1.9% in 1992. Ruth Richardson’s horror budget of 1991 was so bad that the what became the Twitter Left called it the “Mother of All Budgets“.
What followed this massive fiscal consolidation where welfare benefits for cut severely was an economic boom that lasted until the GFC.
Source: Income Gap | New Zealand Council of Trade Unions – Te Kauae Kaimahi.
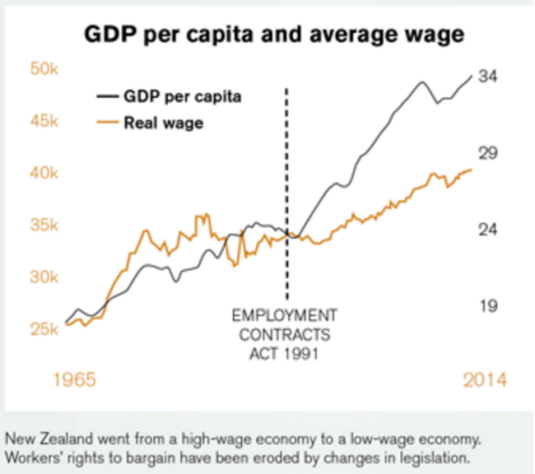
As shown in the chart conveniently compiled by the New Zealand Council of Trade Union, there was 20 years of real wage stagnation until the passage of the Employment Contracts Act in 1991.
Source: Income Gap | New Zealand Council of Trade Unions – Te Kauae Kaimahi with annotations.
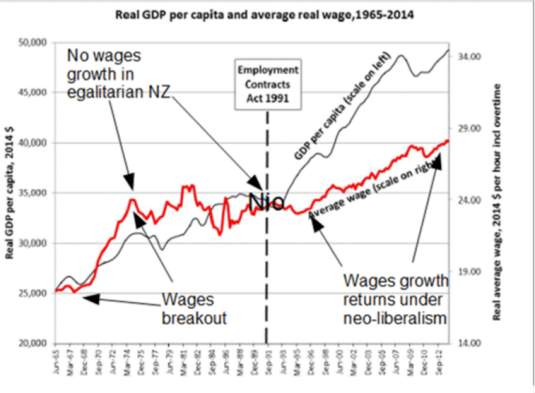
What followed the passage of that Act was sustained real wages growth for the first time in two decades and the end of growing inequality under the previously highly taxed, heavy regulated economy that was good old days New Zealand if the Twitter Left is to be believed.
To do this, to paint pre-1984 New Zealand, pre-neoliberal New Zealand as a fairly egalitarian paradise, Max Rashbrooke is an example of that is had to ignore two thirds of the population and the inequalities they suffered:
“New Zealand up until the 1980s was fairly egalitarian, apart from Maori and women, our increasing income gap started in the late 1980s and early 1990s,” says Rashbrooke. “These young club members are the first generation to grow up in a New Zealand really starkly divided by income.”
Racism and patriarchy can sit comfortably with a fairly egalitarian society if you are to believe the vision of the Twitter Left as to their good old days. John Quiggin refers to the period in Australia known as the Menzies Era as part of his golden age of the mixed economy. The Menzies Era was most of the 23 years of uninterrupted conservative party rule between 1949 and 1972. The actual Menzies Era was the period up to 1966 when Liberal Party Prime Minister Sir Robert Menzies retired
The reforms of the 1980s known as Rogernomics stopped the long-term stagnation in real wages that started in about 1974. The reforms of the early 1990s under a National Party government including a massive fiscal consolidation and the passing of the Employment Contracts Act was followed by the resumption of sustained growth in real wages with little interruption since.
New work by Chris Ball and John Creedy shows substantial *declines* in NZ inequality.
initiativeblog.com/2015/06/24/ine… http://t.co/f94fw4Bhae—
Eric Crampton (@EricCrampton) June 24, 2015
This boom after two decades of minimal real economic growth per working age New Zealander benefited everyone. The unemployment rate fell to a record low of 3.5% about 2005. Maori unemployment was at a 20-year low of 8% in 2008. Maori labour force participation rates increased from 45% in the late 1980s to about 62% by the eve of the Global Financial Crisis.
The increase in percentage terms of Maori and Pasifika real household income is much larger than for Pakeha since the economic reforms of the 1980s and 1990s. As Bryan Perry (2015, p. 67) explains when commenting on table D6 sourced by Closer Together Whakatata Mai:
From a longer-term perspective, all groups showed a strong rise from the low point in the mid 1990s through to 2010. In real terms, overall median household income rose 47% from 1994 to 2010: for Maori, the rise was even stronger at 68%, and for Pacific, 77%. These findings for longer- term trends are robust, even though some year on year changes may be less certain. For 2004 to 2010, the respective growth figures were 21%, 31% and 14%.
US, UK, Danish and Swedish tax revenues as % of GDP since 1966
13 Nov 2015 Leave a comment
in economic history, public economics, Sam Peltzman
You can’t find Reaganomics in the tax statistics below. Maggie Thatcher stopped a rapid growth in British tax revenues which caused the UK to become the sick man of Europe. She then unwound that growth in tax revenues as a percentage of British GDP. The election of the Blair government in 1997 stopped the rapid growth in tax revenues as a share of British GDP under that double secret socialist John Major. As Sam Peltzman previously noticed, the growth the government stopped in Denmark and Sweden in the mid-1980s.
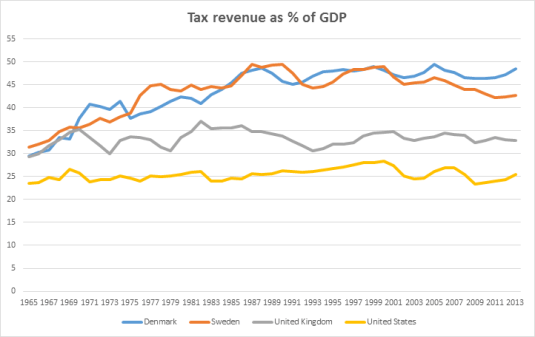
Data extracted on 12 Nov 2015 23:56 UTC (GMT) from OECD.Stat
Do the European welfare states free ride off American entrepreneurship and innovation?
12 Nov 2015 1 Comment
in applied price theory, applied welfare economics, comparative institutional analysis, constitutional political economy, economic history, economics of regulation, entrepreneurship, industrial organisation, politics - USA, public economics, survivor principle, taxation, technological progress Tags: creative destruction, Daron Acemoglu, Denmark, entrepreneurial alertness, Eurosclerosis, international technology diffusion, taxation and entrepreneurship, taxation and innovation, taxation and investment, taxation and labour supply, technology followers, welfare state

Source: Daron Acemoglu A Scandinavian U.S. Would Be a Problem for the Global Economy – NYTimes.com.
French, German, Italian and British equilibrium unemployment rates, 1968 – 2017
10 Nov 2015 Leave a comment
in business cycles, economic history, economics of regulation, Euro crisis, job search and matching, labour economics, labour supply, macroeconomics Tags: British economy, employment law, equilibrium unemployment rate, Eurosclerosis, France, Germany, Italy, labour market reforms, Margaret Thatcher, Thatchernomics, The British Disease
Unlike the USA, the German, Italian, British and French equilibrium unemployment rates all show fluctuations that reflect changes in their underlying economic circumstances and labour market reforms. The case of the British, the rise of the British disease and Thatchernomics. The case of German, its equilibrium unemployment rate rose after German unification and then fell after the labour market reforms of 2002 to 2005.

Source: OECD Economic Outlook November 2015 Data extracted on 10 Nov 2015 07:07 UTC (GMT) from OECD.Stat.
When did buying your own home become an investment in New Zealand?
09 Nov 2015 Leave a comment
in economics of regulation, politics - New Zealand, Public Choice, rentseeking, urban economics
Buying a house became an investment in New Zealand coincidently with the passing of the Resource Management Act and all the restrictions on land supply it empowered. Prior to then buy a house was a good idea except if you want to make money because real housing prices in 1993 were the same as in the mid-70s.
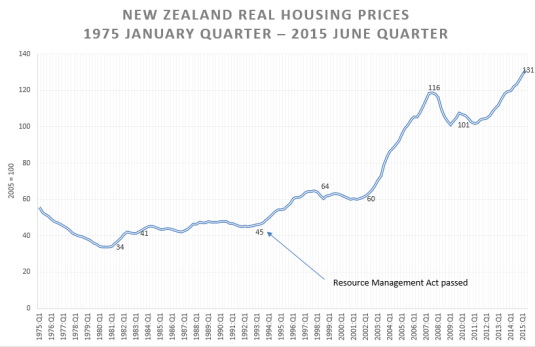
Source and notes: Dallas Fed International Housing Database July 2015 – The author acknowledge use of the dataset described in Mack and Martínez-García (2011); real housing prices are nominal housing prices deflated by a personal consumption deflator.
Housing prices rose by 50% in the first few years after the passage of the Resource Management Act. Housing prices doubled again in the last five years of the last Labour Government in New Zealand. With the economic recovery, housing prices increased again by 30% in the last four years or so.
The housing prices charted in deflated above are nationwide figures originally from nationwide nominal data published by the Reserve Bank of New Zealand and Quotable Value. They do not show the even faster growth in housing prices in, example, Auckland, Wellington and Christchurch and stagnant housing prices in declining regions, cities and towns of New Zealand.
@PhilTwyford fantastic @nzlabour policy breakthrough on housing affordability
08 Nov 2015 Leave a comment
in applied price theory, economics of regulation, fiscal policy, politics - New Zealand, urban economics Tags: housing affordability, land supply, New Zealand Greens, New Zealand Labour Party, RMA
Labour yesterday announced an excellent policy on housing affordability. The reforms proposed by Labour stress increasing the supply of land and improvements to local government finances surrounding infrastructure investments for new housing:
Labour will free up density and height controls to allow more medium density housing and reform the use of urban growth boundaries so they don’t drive up section costs. This will curb land bankers and speculators.
Labour has struck at the heart of two major constraints on urban land supply New Zealand: restrictions on density and height of new developments, and much more importantly, the use of urban growth boundaries to drive up land prices. These proposed regulatory reforms could not be more welcome.
The other shoe of Labour’s housing affordability reform proposals is improving the incentives for local councils to support new housing developments:
The other new element is changing the way we fund infrastructure for new developments. Currently those costs are either subsidised by the ratepayer or passed by the developer onto the price tag of a new home. That makes houses much more expensive. It also means they are paid off through mortgages at expensive bank interest rates.
Our new policy will see infrastructure funded by local government bonds, paid off over the lifetime of the asset through a targeted rate on the properties in the new development. This will substantially reduce the cost of new housing.
The reforms proposed by Labour to local government financing will reduce the financial burden on existing ratepayers of the local government funded infrastructure necessary to support new land developments.
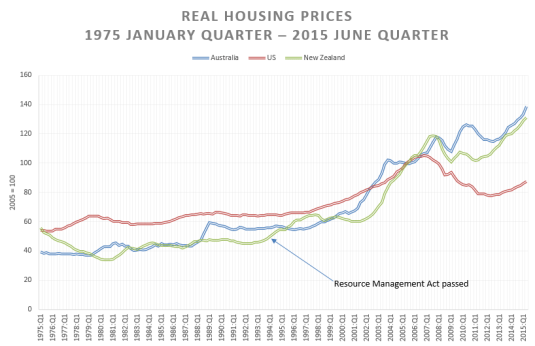
Source and notes: International House Price Database – Dallas Fed June 2015; nominal housing prices for each country is deflated by the personal consumption deflator for that country.
These Labour Party reforms are fantastic because the main party on the left-wing of New Zealand politics has faced up to restricted land supply as a key reason behind housing unaffordability. I wonder what the New Zealand Greens will think of these major new reforms.
Of course, nothing is perfect in the art of policy development. New Zealand Labour continue to want government to build 100,000 affordable houses and scapegoat foreigners for high housing prices.
A few more sensible economic and fiscal policy announcements such as those today by the New Zealand Labour Party and it will start looking like a credible alternative government.

Recent Comments