— EPI Chart Bot (@epichartbot) January 13, 2016
Non-cognitive skills by socioeconomic quintile
13 Jan 2016 Leave a comment
in economics of education, human capital
1996 US welfare reforms & single mother employment rates @garethmorgannz @geoffsimmonz
13 Jan 2016 Leave a comment
in gender, labour economics, labour supply, politics - New Zealand, politics - USA, poverty and inequality, welfare reform Tags: 1996 US welfare reforms, female labour force participation, maternal labour force participation, single mothers, single parents, social insurance, welfare state
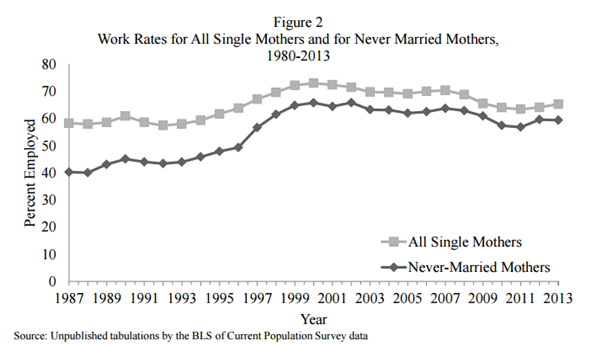
Source: Ron Haskins (2015).
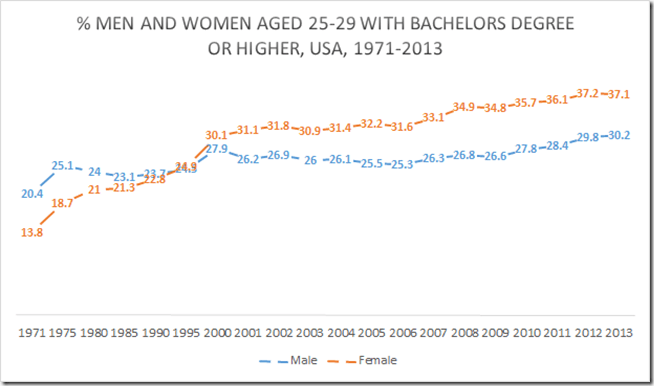
Percentage of American men and women aged 25 to 29 with bachelors degree or higher, 1971 – 2013
13 Jan 2016 1 Comment
in discrimination, economic history, economics of education, gender, human capital, labour economics Tags: College premium, education premium, graduate premium, reversing gender gap
The gender gap in higher education reversed in the year 2000
@TBillTheProf shows that SF #livingwage sends hiring standards through the roof
13 Jan 2016 Leave a comment
in applied price theory, labour economics, minimum wage, personnel economics, politics - USA Tags: living wage
Recent field research in San Francisco and North Carolina restaurants found that after San Francisco living wage increase, managers were pickier about whom they hire, because they want workers to be worth the higher cost. The San Francisco minimum wage is now $12.25, and all employers are required to offer paid sick days and contribute to their employees’ health insurance.

Source: How worker-friendly laws changed life as a server in San Francisco restaurants – The Washington Post.
The study is useful because of instead of studying the myths and realities about how a higher minimum wage somehow motivates workers to be more productive and offset part or all of its cost to employers, the study investigates how the minimum wage, a living wage, affects hiring standards.
Employers of low skilled, low-wage workers look for workers who are friendly and reliable. As the study concedes, you can teach people the skills they need as long as they are friendly and reliable.

In San Francisco, recruits not only have to be friendly and reliable, they are expected to have experience. The living wage shuts out inexperienced and new workers, which promotes social exclusion.
Minimum wage workers in San Francisco are noticeably older and better educated than those in North Carolina and recruited after more intensive sorting and screening against the hiring standards for the vacancy:
Rather than viewing servers as essentially interchangeable labourers who can be quickly and easily trained if they possess a modicum of personal hygiene and a friendly personality, employers in San Francisco exhibited a clear description of what a professional server was and the explicit and implicit skills required.
The study did not enquire into what happened to applicants who failed to meet the higher hiring standard induced by the living wage increase. As is standard with the champions of the living wage, they do not want to talk about those excluded by the living wage rise.
Poverty Rates by Mothers’ Marital Status, 1987 to 2013
13 Jan 2016 Leave a comment
in applied welfare economics, economic history, labour economics, labour supply, politics - USA, poverty and inequality, welfare reform Tags: child poverty, family poverty, single mothers, single parents, social insurance, welfare state
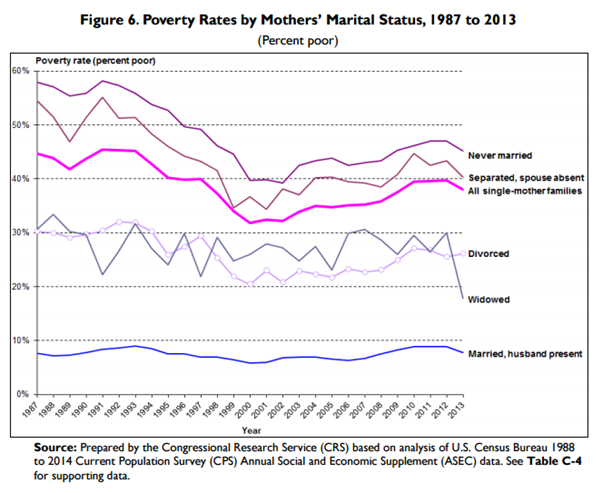
Source: Congressional Research Service.https://www.fas.org/sgp/crs/misc/R41917.pdf
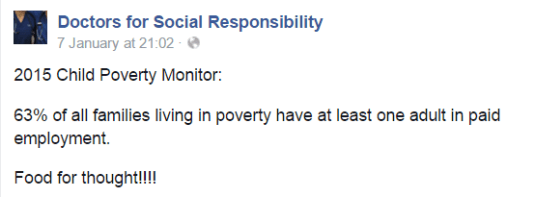
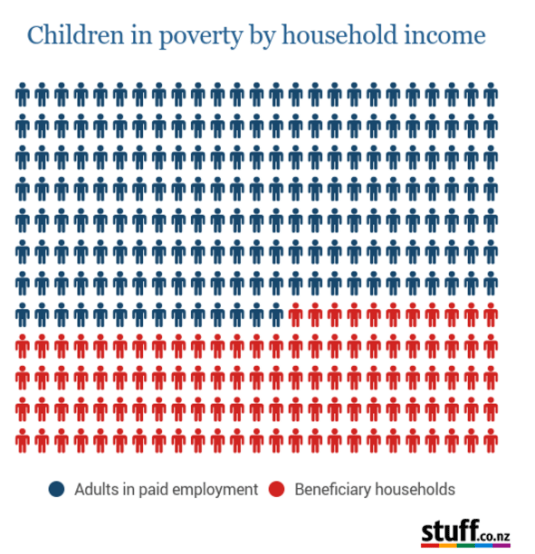
A curious @povertymonitor based child poverty infographic
12 Jan 2016 2 Comments
in applied welfare economics, politics - New Zealand, poverty and inequality

@povertymonitor confirms success of neoliberalism in restoring real wages growth
12 Jan 2016 Leave a comment
in applied welfare economics, economic history, politics - New Zealand, poverty and inequality
After two lost decades from 1974 where there was real wage stagnation and next to no real GDP growth, following the Mother of All Budgets in 1991 under Ruth Richardson and the passage of the Employment Contracts Act in the same year, real wages growth returned after a hiatus of 20 years. These 20 years of real wage stagnation were the good old days if the Leftover Left is to be believed.

Source: Child Poverty Monitor: 2015 Technical Report, figure 39.
David Neumark on the employment effects of minimum wages @livingwageNZ
12 Jan 2016 Leave a comment
in applied price theory, applied welfare economics, labour economics, minimum wage Tags: expressive voting, living wage, rational irrationality, Twitter left
Some #tax cuts produce more growth than others
12 Jan 2016 Leave a comment
in applied price theory, labour economics, politics - USA, public economics Tags: laffer curve
Dave Armstrong food banks existed in NZ since the 19th century
11 Jan 2016 Leave a comment
in economic history, politics - New Zealand, poverty and inequality

Source: Donna Wynd, Hard to Swallow Foodbank Use in New Zealand (2005).
David Armstrong claimed incorrectly that there have been no food banks in New Zealand until recently:
That’s how it used to be here not so long ago, when foodbanks didn’t exist and the number of homeless was tiny. I remember when we had few cases of “poverty” diseases such as rheumatic fever or rickets.
What else explains the increased popularity of food banks, which have been long-standing in New Zealand, it is not falling wages.
The main economic development over the last 25 years is the return of real wage growth after decades of wage stagnation in the boys own good old days of David Armstrong.
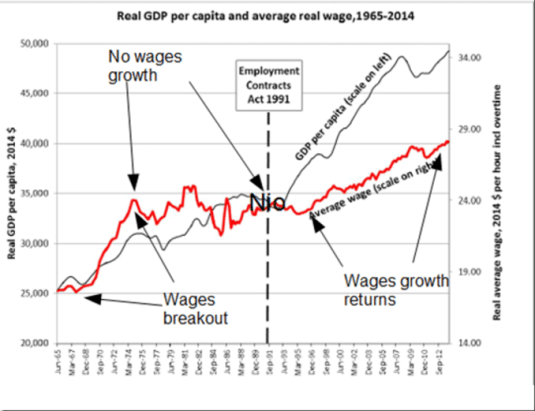
Source: Low Wage Economy | New Zealand Council of Trade Unions – Te Kauae Kaimahi.
As for the number of homeless being tiny in the good old days of New Zealand, a New Zealand Parliamentary Library 2014 paper on homeless started its historical narrative in 1850 and spent a lot of time discussing housing deprivation in the early and mid-20th century:
A 1936 national survey found nearly a third of the total urban housing stock was unsatisfactory and 15% of this only fit for demolition. [5] Māori in particular experienced poor housing conditions. The first Labour Government loaned money for private house purchases and built state housing to rent.
During the 1950s, the National Government moved to reduce the waiting list for state housing and promoted home ownership, but lengthy waits for some people were reported. Likewise, concern was expressed over severe overcrowding, especially among Māori. By the late 1950s, Wellington’s housing needs were identified as ‘particularly acute.
In the 1960s voluntary organisations recorded a gradual increase in some groups experiencing housing difficulties. The Christchurch Methodist Church night shelter found that their main users were employed people who could not afford other accommodation, unmarried women with children, and those leaving homes because of domestic violence also increasingly sought shelter
Not even a self-described liberal elitist of the left can be forgiven for forgetting some of the key achievements of the first Labour government in social housing. The idea was to improve the quality of New Zealand housing for the poor.

Source: The first state house – State housing | NZHistory, New Zealand history online.
In common with Max Rashbrooke, David Armstrong’s recollection of his boys own childhood does not include Maori as they drifted to the city. Prior to the middle of the 20th century about 85% of Maori lived in rural areas, often lacking electricity, running water and living on dirt floors as the Encyclopaedia of New Zealand explains:
Attracted by work opportunities and the ‘bright lights’ of city life, rural Māori began to move to Auckland and Wellington in the 1920s. However, many faced problems finding accommodation. The reputation Māori had among Pākehā for overcrowding and taking poor care of their homes meant few landlords were prepared to have them as tenants. As attendee James Rukutoki told a Māori leaders conference in 1939, ‘the only dwellings open to the Maori are the ramshackle discards of the Pākehā’.
What does the poverty rate tell us? @keith_ng @EricCrampton @geoffsimmonz @apdrmabsc @bryce_edwards
11 Jan 2016 Leave a comment
in applied welfare economics, politics - New Zealand, poverty and inequality
Keith Ng stumbled onto an interesting point in a Twitter feud yesterday before he muted me about what is the poverty rate for. Are we interested in the poverty rate before government transfers and other social assistance or after them? Why?
If you are making the case for more assistance to the poor, the correct poverty rate measure is after the existing government assistance. Interestingly, most of those making the case for greater assistance to the poor use the before government transfer measures of poverty rates.
The reason why the correct measure is after government assistance is you are attempting to measure whether the assistance to date has provided people with an adequate standard of living. The before government assistance poverty rate provides no insight into that question.
The recent calculation by the Treasury of inequality based on income and consumption illustrates this. Most people are concerned about what people have to spend rather than how much they earn when thinking about topping them up with government social assistance.
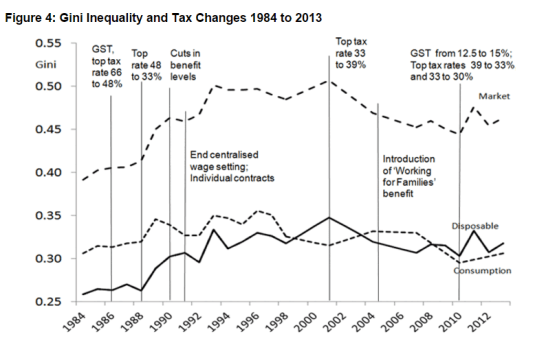
Source: Inequality in New Zealand 1983/84 to 2013/14 (WP 15/06) — The Treasury – New Zealand
As the above chart shows, consumption inequality in New Zealand has not changed much since 1984 while income inequality has. Which is more important how much people have to spend or how much they are? Growing inequality is not a reason for more government assistance to the poor in New Zealand because it simply has not got worse for 30 years.
The reason that the before government assistance poverty rate is used is this rate is a relative measure that does not fall by that much. It therefore helps dramatise the politics of poverty and perhaps strengthen your case in the eyes of low information voters.
The better guide is the poverty rate after government assistance because that tells you how much extra you really need to top up the incomes of the poor to ensure they have an adequate minimum standard of living. The before government assistance poverty rate provides no insight into the success of social insurance and the welfare state regarding the adequacy of income support for the poor.
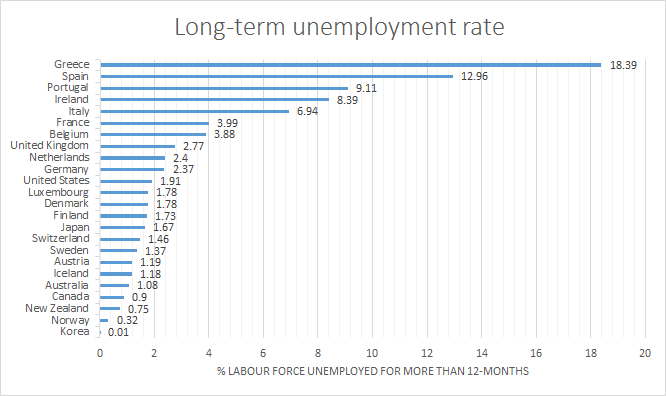
Long-term unemployment rates across the OECD
11 Jan 2016 Leave a comment
in business cycles, labour economics, labour supply, macroeconomics, unemployment Tags: long-term unemployment
The poverty rate is not a reliable policy statistic @HelenKellyUnion @apdrmabsc @keith_ng
10 Jan 2016 Leave a comment
in applied welfare economics, economic history, politics - New Zealand, politics - USA, poverty and inequality
The official poverty rate in the USA missed poverty falling to near zero by the eve of the Global Financial Crisis in 2007 as shown in the chart below. That is no small oversight. It calls into question whether the official poverty rate which is based on a percentage of the median income is a useful guide to the magnitude of social problems before us.
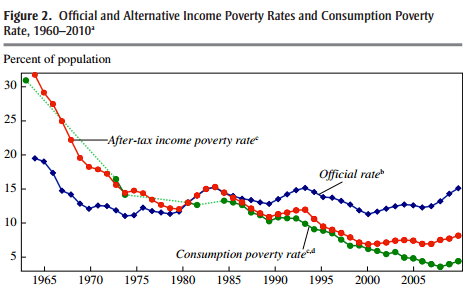
Source: Meyer and Sullivan (2012), p. 153.
Meyer and Sullivan calculated a consumption based measure of poverty and found that the poverty rate fell much faster than previously single digits.
People worry about poor not have enough, not how much income they have before taxes and social insurance. The official poverty rate is before tax and social insurance and therefore before how much the poor actually have to get by with after receiving social assistance of all types and sources.
Interestingly, the divergence between consumption-based poverty and income-based poverty started with the election of Reagan and picked up the US federal welfare reforms in 1996. The number of children in poverty in deep poverty fell immediately after those 1996 US welfare reforms. There is a lesson in that for New Zealand.
It is widely agreed that the official poverty rate is flawed. Measuring poverty as a percentage of median income, usually 60% of the median income, means that poverty may not fall despite incomes doubling every generation and more.
Indeed, increases in the median income can increase poverty without anyone being poorer. This is because the gap between the median income earners and the poor increased such as the New Zealand in 2014 without any of the poor experiencing a fall in income and social support.
The reason why the median is pulling away from the bottom – the reason why income distribution is fanning out – is more people going to university and securing the associated wage premium and the greater rewards for talent in a globalised world.
The forces behind greater educational attainment and the globalisation of markets benefit all and in particular those of bottom of the income distribution through a more prosperous, dynamic, innovative society.
Is @fightfor15 the best answer?
10 Jan 2016 Leave a comment
in labour economics, labour supply, minimum wage, poverty and inequality, unemployment Tags: living wage, rational irrationality
More on the reversing gender pay gap or men getting their comeuppances?
10 Jan 2016 Leave a comment
in discrimination, economic history, gender, human capital, labour economics, labour supply, occupational choice, politics - USA Tags: gender wage gap, middle class stagnation, reversing gender gap, wage stagnation


Recent Comments