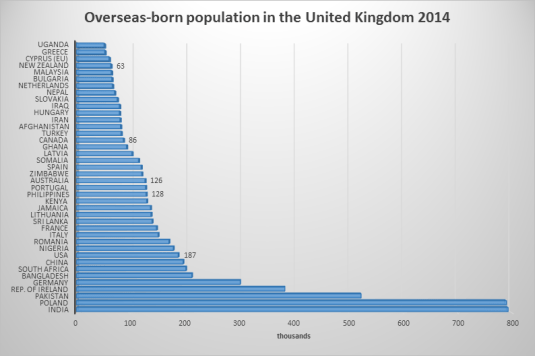
New Zealand is a humble 37th in the running. Mind you, the New Zealand resident population of the UK on a per capita basis of the home population and compares well with Canada and Australia are much larger countries such as the Philippines and the USA.
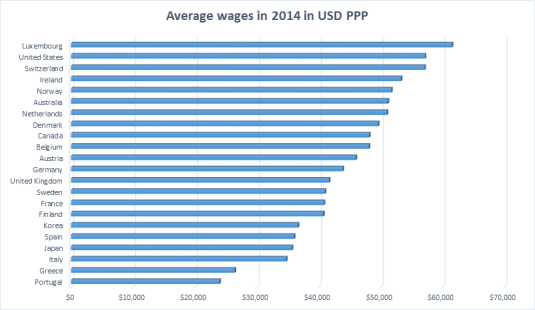
I am surprised that Ireland and Switzerland are so high up in the game. Swedes are poorer than the British despite a much more generous welfare state. France is low in the rankings as is Finland. Japan is doing very poorly on a PPP basis, down there with Italy.
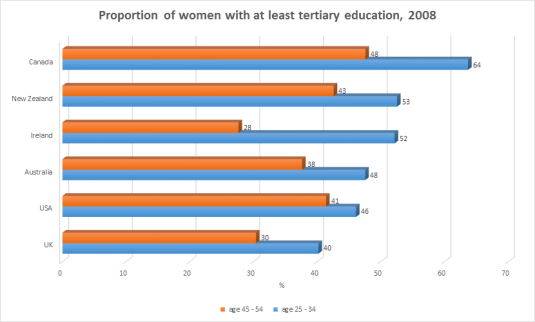
With 40 to 50% of women, and many more in Canada, now going on to tertiary education, claims such as recently by the OECD and IMF that there is problems of access to education as a driver of inequality seem even more doubtful.
Not only do women have to overcome the financing constraint on going onto higher education that so troubles the IMF and the OECD, women of today and yesterday must overcome the dead hand of patriarchy. They have the both the top 1% and all men scheming against them, apparently. Despite this double secret double conspiracy against them, the number of women going on to some form of tertiary education has increased rapidly within a generation from an already high base.
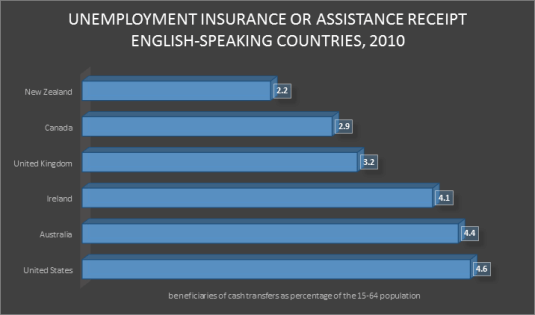
Ireland has a secondary out of work benefit for the unemployed that adds another 8.7% to their welfare rolls in 2010 but it is not in the OECD data table for the above graph.
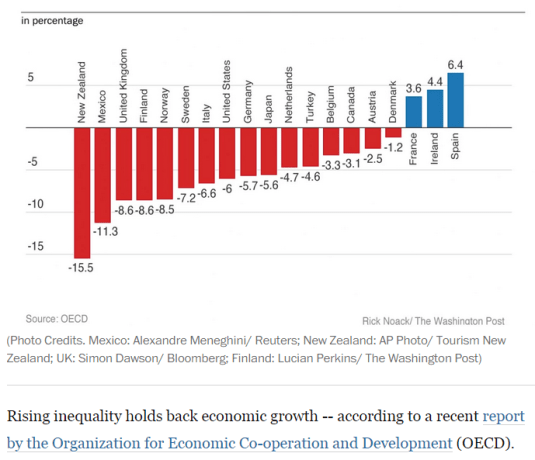
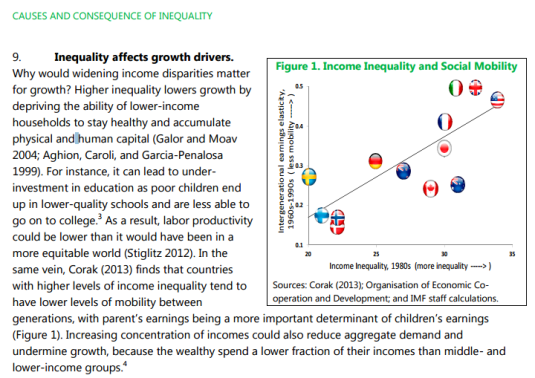
According to the OECD, it is all about the ability to lower middle class and working class families to finance the human capital investments of their children. The OECD theory of inequality and lower growth is there is a financing constraint because of inequality that reduces economic growth because of less human capital accumulation by lower income families.
There are a few common patterns in economic growth. All high-income countries have near-universal K-12 public education to build up human capital, along with encouragement of higher education. All high-income countries have economies where most jobs are interrelated with private and public capital investment, thus leading to higher productivity and wages. All high-income economies are relatively open to foreign trade.
In addition, high-growth economies are societies that are willing to allow and even encourage a reasonable amount of disruption to existing patterns of jobs, consumption, and ownership. After all, economic growth means change.
One of the findings of the Coleman report in the 1960s, which is been pretty much backed up since then such as by top labour economists such as James Heckman, is family background is the key to skills development in children, not the quality of their schools or their access to finance for higher education.
Schools work with what families present to them in terms of innate ability, and personality traits such as to pay attention and work. There is not much difference between an average bad public school and an average good public school when it comes to getting on in life. Going to really bad public school is different from just going to an average bad public school in terms of the chaos imposes on a child’s education and upbringing. What matters is the home environment rather than the ability to access good schools and families of ordinary means to finance higher education for their teenagers.
Most of the skill gaps that are present at the age of 18 – skill gaps which substantially explain gaps in adult earnings and employment in all groups – are also present at the age of five (Cunha and Heckman 2007). There is much evidence to show that disadvantaged children have lower levels of soft skills (non-cognitive skills): motivation, persistence, self-discipline, the ability to work with others, the ability to defer gratification and plan ahead, etc. (Heckman 2008). Most of the skills that are acquired at school build on these soft skills that are moulded and reinforced within the family.
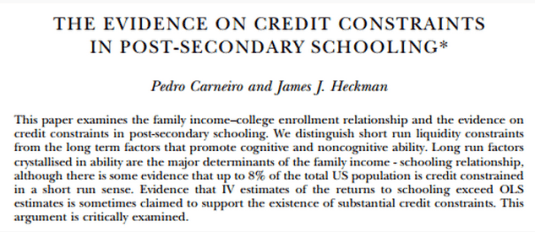
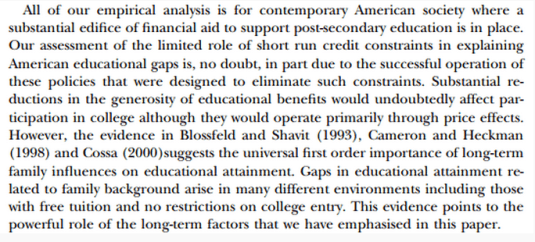
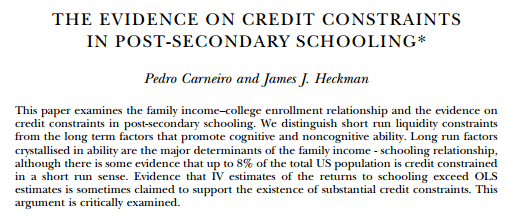
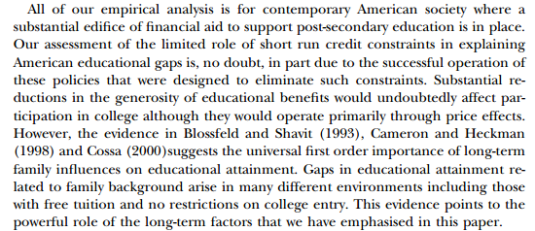
In 2002, with Pedro Carneiro, James Heckman showed that lack of access to credit is not a major constraint on the ability of young Americans to attend college. Short-term factors such as the ability to borrow to fund higher education has been found to be seriously wanting as an explanation for who and who does not go on to higher education.
Only a small percentage of young people are in any way constrained from going on to higher education because of the lack of money. This is not surprising in any society with student loans freely available at low or zero rates without any need to post collateral. Heavily subsidised tuition fees and cheap student loans have been around for several generations.
The biggest problem with the OECD hypothesis linking a lack of skill development within lower income and working class families is it is such an easy problem to solve for the ambitious politician of either the left or the right by throwing money at the problem. Schooling until the age of 16 has been free for a century and universities have been virtually free for at least two generations. Lack of access to a good education does not cut it as the explanation for large disparities in growth rates.
The OECD and more recently the IMF have placed a lot of weight in access to human capital as a driver of inequality because human capital accumulation is hypothesised to be a major driver of economic growth.
The evidence that human capital is a key contributor to higher economic growth is weakening rather than strengthening. If human capital accumulation is not a major driver of productivity growth and productivity disparities, the inequality and growth hypothesis of the OECD and the IMF based on access to finance for human capital accumulation does not get out of the gate. Moreover, as Aghion said:
Economists and others have proposed many channels through which education may affect growth–not merely the private returns to individuals’ greater human capital but also a variety of externalities.
For highly developed countries, the most frequently discussed externality is education investments’ fostering technological innovation, thereby making capital and labour more productive, generating income growth. Despite the enormous interest in the relationship between education and growth, the evidence is fragile at best.
The trend rate of productivity growth did not accelerate over the 20th century despite a massive rise in investments in human capital and R&D because of the rising cost of discovering and adapting new technological knowledge. The number of both R&D workers and highly educated workers increased many-fold over the 20th century in New Zealand and other OECD member countries including the global industrial leaders such as the USA, Japan and major EU member states.
Cross-country differences in total factor productivity are due to differences in the technologies that are actually used by a country and the degree in the efficiency with which these technologies are used. Differences in total factor productivity, rather than differences in the amount of human capital or physical capital per worker explain the majority of cross-country differences in per capita real incomes (Lucas 1990; Caselli 2005; Prescott 1998; Hall and Jones 1999; Jones and Romer 2010).
Differences in the skills of the individual worker or in the total stock of human capital of all workers in a country cannot explain cross national differences in value added per worker at the industry level.
The USA competes with Japan for productivity leadership in many manufacturing industries.
The Japanese services sector productivity can be as little as a one-third of that of the USA.
Japanese labour productivity is almost twice Germany’s in producing automobiles and is better that Germany by a large margin for many other manufactured goods.
The USA is uniformly more productive in services sector labour productivity. For example, British, French and German telecom workers were 38 to 56 per cent as productive as their American counter-parts.
The USA, Japan, France, the UK and Germany all have relatively well-educated, experienced and tested labour forces. For example, the 1993 McKinsey’s study inquired into the education and skills levels of Japanese and German steel workers. Comparably skilled German steel workers were half as productive as their Japanese counterparts (Prescott and Parente 2000, 2005).
The ability to finance human capital accumulation and go to good schools is a weak theory of inequality. Human capital accumulation itself is a weak theory of growth unless linked to sophisticated theories of the institutions fostering innovation and technology absorption which it now is.
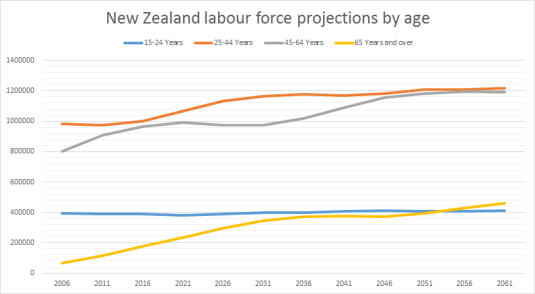
The common theme in New Zealand labour force projections is the number of plus age 65 workers is to increase for next to nothing a mere 10 years ago, barely 65,000 plus 65 workers in all, to knock on the door of the number to population aged 15 to 24 in a mere 15 years from now.
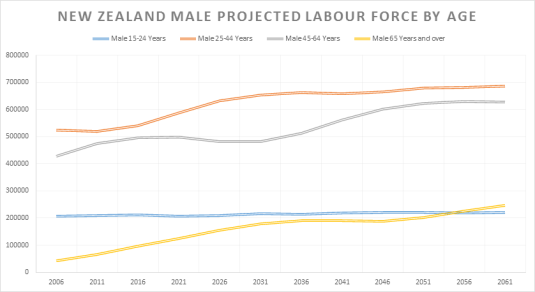
Prime age male workers will continue to be the most predominant male worker but there will be many more +65 male workers. The retirement of baby boomer male workers is the reason why mature age working population is static for some time.
The working age female population aged 45 to 64 has already overtaken the 25 to 44 female working age population. The number of female workers aged 65 and over is also exploding.
Most labour force projections are based on the premise that we are all going to work to we drop. That is not unreasonable assumption given healthy ageing and the great number of service jobs that are available which are not physically taxing.
All population projections scenarios are for the 50th percentile projection.
The IMF has joined the OECD in arguing there is an important connection between inequality and who gains from economic growth.
To reach the conclusion that the income distribution matters, the IMF had to tie its master the exact same weak moorings that the OECD did. Specifically the ability of the lower middle class to finance investments in school and higher education.
The IMF has articulated a specific hypothesis that can be confronted with facts and logic.
Many critics of inequality are extremely vague about what exactly is the process that grinds the proletariat down. The withering away of the proletariat in the 20th century has been discussed elsewhere on this blog.
The impact of low income on the ability to accumulate physical and human capital sounds like an interesting question. Not surprisingly, the top labour economists have looked into it.
Short-term factors such as the ability to borrow to fund higher education has been found to be seriously wanting. Only a small percentage of people are in any way constrained from going on to higher education because of the lack of money. This is not surprising in any society with student loans freely available at low or zero rates without any need to post collateral.
The notion that the rich are just replicating the good fortunes of their parents has also fallen on hard times despite the persistence of the OECD and the IMF in championing this old Marxist fantasy.
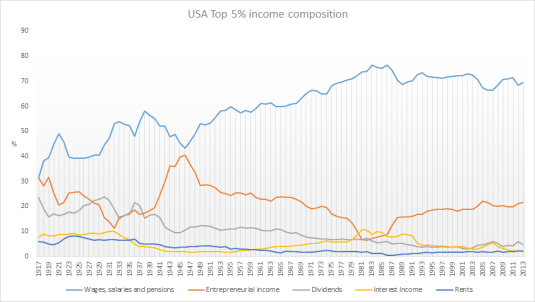
If you look at the income composition of the top 5% of the USA, for example, it is a disappointing story for the IMF and the OECD. Today’s rich are working rich with the majority of their income from wages and salaries and much of the rest from entrepreneurial income. There is no passive rich earning incomes from their inherited investments and grinding the proletariat down.
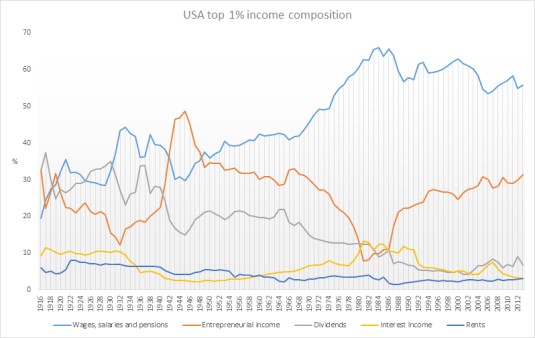
It is the same story with the top 1%. They are working rich with the majority of their incomes paid in wages and salaries and running a business. They are top executives, managers and leading professionals that go to work every day.
The IMF was simply wrong to claim that at least half the income of the top 1% in the USA was not labour income.
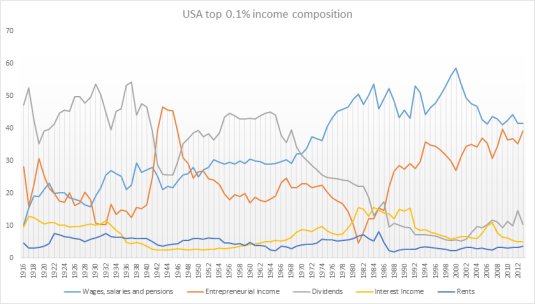
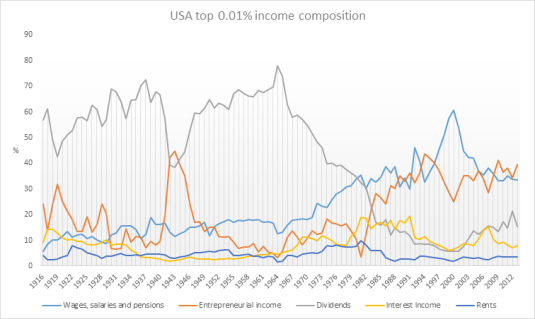
Before 1940, most of the income of the top 0.1% of income earners in the USA was income from investments. By the end of the 20th century, the top 0.1% were earning their incomes as wages and salaries, business incomes and capital gains. Very little of that income of the top 0.1% was in the form of passive income from capital. The top 0.1% of the USA are now working rich – entrepreneurs.
In the good old days of high taxes, the top 0.01% did earn the great majority of their income from passive investment.
Only under the scourge of neoliberalism starting in the 1970s and then massive tax cuts in the Reagan Revolution did the top 0.01% join the working rich. Even the super super-rich have to work for their money these days.
The IMF and before it the OECD were batting from a weak position when they argued that human capital investments of ordinary families is held up by inequality. Student loans to pay for subsidised tuition fees and living expenses solve that problem long ago.
It was simply wrong of the IMF to claim that the top 5%, 1% and 0.1% of for example the USA are living off the rest of society. In the USA, is usually put forward as the worst-case, the rich and super-rich are working rich making their fortunes by building and running businesses. In The Evolution of Top Incomes: A Historical and International Perspective (NBER Working Paper No. 11955), Thomas Piketty and Emmanuel Saez concluded that:
While top income shares have remained fairly stable in Continental European countries or Japan over the past three decades, they have increased enormously in the United States and other English speaking countries. This rise in top income shares is not due to the revival of top capital incomes, but rather to the very large increases in top wages (especially top executive compensation). As a consequence, top executives (the “working rich”) have replaced top capital owners at the top of the income hierarchy over the course of the twentieth century…
While top CEO pay has increased, so has the pay of private company executives and hedge fund and private equity investors;
ICT advances increase the pay of many – of professional athletes (technology increases their marginal product by allowing them to reach more consumers), Wall Street investors (technology allows them to acquire information and trade large amounts more easily), CEOs and technology entrepreneurs in the Forbes 400; and
Technology allows top executives and financiers to manage larger organizations and asset pools – a loosening of social norms and a lack of independent control of CEO pacesetting does not explain similar increases in pay for private companies– technology explains it.
SuperEntrepreneurs founded half the largest new firms created since the end of the Second World War
There is a strong correlation between high rates of SuperEntrepreneurship in a country and low tax rates
a low regulatory burden and high rates of philanthropy both correlate strongly with high rates of SuperEntrepreneurship
Active government and supranational programmes to encourage entrepreneurship – such as the EU’s Lisbon Strategy – have largely failed.
Yet governments can encourage entrepreneurialism by lowering taxes (particularly capital gains taxes which have a particularly high impact on entrepreneurialism while raising relatively insignificant revenues); by reducing regulations; and by vigorously enforcing property rights.
High rates of self-employment and innovative entrepreneurship are both important for the economy.
Yet policy makers should recognise that they are not synonymous and should not assume policies which encourage self-employment necessarily promote entrepreneurship.
John Rawls is often put forward by political progressives as the starting point for political philosophy. Rawls pointed out that behind the veil of ignorance, people will agree to inequality as long as it is to everyone’s advantage. Rawls was attuned to the importance of incentives in a just and prosperous society. If unequal incomes are allowed, this might turn out to be to the advantage of everyone.
Steven Kaplan and Joshua Rauh’s “It’s the Market: The Broad-Based Rise in the Return to Top Talent”, Journal of Economic Perspectives (2013) found that:
Rising inequality is due to technical changes that allow highly talented individuals or “superstars” to manage or perform on a much larger scale.
These superstars can now apply their talents to greater pools of resources and reach larger numbers of people and markets at home and abroad. They thus became more productive, and higher paid.
Those in the Forbes 400 richest are less likely to have inherited their wealth or have grown up wealthy.
Today’s rich are working rich who accessed education in their youth and then applied their natural talents and acquired skills to the most scalable industries such as ICT, finance, entertainment, sport and mass retailing.
The U.S. evidence on income and wealth shares for the top 1% is most consistent with a “superstar” explanation. This evidence is less consistent with the gains in earnings of the top 1% coming from greater managerial power over the determination of their own pay in the corporate world, or changes in social norms about what managers could earn.
Today’s super-rich are highly productive because they produce new and better products and services that people want and are willing to pay for. These rewards for entrepreneurship and hard work guide people of different talents and skills into the occupations and industries where their talents are valued the most. The efficient allocation of talent and income maximising occupational choices were important to Rawls’ framework.
The IMF and World Bank should look for policies that remove barriers to riches. Instead, the IMF and OECD are giving support to those who want to tax and regulate the super-rich that drive much of the innovation, entrepreneurship and creative destruction in modern economies.
Why Evolution is True is a blog written by Jerry Coyne, centered on evolution and biology but also dealing with diverse topics like politics, culture, and cats.
In Hume’s spirit, I will attempt to serve as an ambassador from my world of economics, and help in “finding topics of conversation fit for the entertainment of rational creatures.”
“We do not believe any group of men adequate enough or wise enough to operate without scrutiny or without criticism. We know that the only way to avoid error is to detect it, that the only way to detect it is to be free to inquire. We know that in secrecy error undetected will flourish and subvert”. - J Robert Oppenheimer.


Recent Comments