
via Rethinking the War on Poverty: Part 1 in a Series | The GailFosler Group.
Celebrating humanity's flourishing through the spread of capitalism and the rule of law
01 Jun 2015 Leave a comment
in discrimination, gender, labour economics, labour supply, politics - USA, poverty and inequality, welfare reform Tags: 1996 US welfare reforms, racial discrimination, social insurance, welfare state
31 May 2015 Leave a comment
in economic history, health and safety, labour economics, labour supply, occupational choice Tags: Empire State Building, New York City, The Great Escape
The Empire State building is dedicated in NYC. Here's a cool construction photo of the building, May 1st, 1931. http://t.co/map6v6A5dI—
Classic Pics (@classicepics) May 30, 2015
31 May 2015 Leave a comment
in applied price theory, comparative institutional analysis, constitutional political economy, labour economics, minimum wage Tags: expressive voting, rational irrationality
31 May 2015 Leave a comment
in labour economics, labour supply, politics - USA, welfare reform Tags: family tax credits, poverty traps, welfare reform, welfare state
31 May 2015 Leave a comment
in income redistribution, labour economics, minimum wage, politics - USA, Public Choice, rentseeking, unions Tags: bootleggers and baptists, cartels, rent seeking, union power, union wage premium
31 May 2015 Leave a comment
in economics of education, human capital, labour economics, labour supply, minimum wage, occupational choice, poverty and inequality Tags: College premium, education premium, internships, on-the-job human capital
29 May 2015 Leave a comment
in economics of education, economics of media and culture, human capital, politics - USA Tags: expressive voting, literacy levels, rational ignorance, rational irrationality
27 May 2015 2 Comments
in discrimination, economics of regulation, gender, labour economics, occupational choice Tags: gender wage gap, maternity leave, offsetting behaviour, The fatal conceit, The pretence to knowledge, unintended consequences


The best part of the article is its frank admission about how bare the cupboard is in dealing with the impact of generous maternity leave on the gender gap. Maternity leave should not be too generous, should not be paid by employers but by taxpayers, and should extend to both men and women.

26 May 2015 Leave a comment
in labour economics, unions Tags: union membership, union power, union wage premium, voter demographics
As wages go nowhere, labor unions are increasingly making sense to American workers read.bi/1WzeXX4 http://t.co/sbxQzcuUkC—
BI Markets (@themoneygame) August 17, 2015
From a macro-level by Richard Posner:
Current union hostility to immigrant workers is consistent with the unions’ former hostility to blacks and women–which is to say, to workers willing to work for a wage below the union wage. And by raising labor costs, unions accelerate the substitution of capital for labor, further depressing the demand for labor and hence average wages. Union workers, in effect, exploit nonunion workers, as well as reducing the overall efficiency of the economy. The United Auto Workers has done its part to place the Detroit auto industry on the road to ruin.
From a micro-level by Pajamas Media:
One afternoon I was helping oversee the plant while upper management was off site. The workers brought an RV into the loading yard with a female “entertainer” who danced for them and then “entertained” them in the RV. With no other management around, I went…
View original post 4,036 more words
26 May 2015 Leave a comment
in business cycles, job search and matching, labour economics, labour supply, unemployment Tags: Australia, British economy, Canada

Source: OECD StatExtract

Source: OECD StatExtract
25 May 2015 Leave a comment
in economic history, labour economics, politics - Australia, politics - New Zealand, politics - USA, unions Tags: Australia, British economy, Canada, trade union density, union power, union wage premium

Source: OECD StatExtract
25 May 2015 1 Comment
in economic growth, economic history, economics of regulation, industrial organisation, job search and matching, labour economics, unions Tags: Employment Contracts Act, employment law, employment protection laws, employment regulation, labour market deregulation, lost decades, union power
The Council of Trade Unions scored something of an own goal in the 2014 election campaign when it was denouncing the Employment Contracts Act 1991 as the reason for wages growth have not kept up with GDP per capita growth since its passage in 1991. Its evidence in chief against the deregulation of the New Zealand labour market is in the snapshot below showing their graph of real GDP per capita and average real wages from 1965 to 2014.

Source: Low Wage Economy | New Zealand Council of Trade Unions – Te Kauae Kaimahi.
The chart selected by the Council of Trade Unions shows several distinct trends in wages growth and real GDP growth per capita in New Zealand. None of these trends nor breaks in trends support the hypothesis that the days prior to the Employment Contracts Act 1991 were the good old days where workers shared generally in gains from economic growth.
From about 1970 to 1975 in the snapshot below of the Council of Trade Unions chart there was rapid real wages growth, well in excess of real growth in per capita GDP. This wages breakout was followed by some ups and downs but essentially wages in 1995 were no different from what they were in 1975. Real wages were about $24 per hour in real terms in New Zealand for about 20 years – from 1975 to 1995.

These are the good old days in the eyes of the Council of Trade Unions. No real wages growth for 20 years. There was no real GDP per capita growth from 1975 until 1979 nor in the five years leading up to the passage of the Employment Contracts Act 1991 in the chart selected by the Council of Trade Unions in the snapshot above.
The period leading up to 1975 in the preceding wages breakout was the zenith of union membership with nearly 70% of all workers belonging to a union – see figure 1. What followed from 1975 was a long declining in trade union membership that did not end until just after the Employment Contracts Act in 1991 – see figure 1.
Figure 1: Trade union densities, New Zealand, Australia, United Kingdom and United States, 1970–2013

Source: OECD StatExtract.
Whatever happened to union power in New Zealand happened before the passage of the Employment Contracts Act 1991 and with it the deregulation of the New Zealand labour market. 20 years of no real wages growth and economic stagnation may explain part of the decline of unions in New Zealand.
Real GDP per capita growth was pretty stagnant after 1975 to 1994 in the chart of data selected by the Council of Trade Unions, which is why I have previously referred to 1974 to 1992 as New Zealand’s Lost Decades – see figures 2 and 3.
Figure 2: Real GDP per New Zealander and Australian aged 15-64, converted to 2013 price level with updated 2005 EKS purchasing power parities, 1956-2013, $US
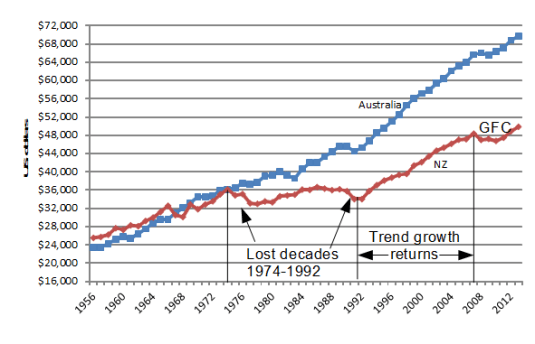
Source: Computed from OECD Stat Extract and The Conference Board, Total Database, January 2014, http://www.conference-board.org/economics
Figure 2 shows that New Zealand lost two decades of productivity growth between 1974 and 1992 after level pegging with Australia for the preceding two decades.
These lost decades of growth are the unions’ good old days but workers cannot share in the general gains of economic growth when there isn’t any economic growth as the chart selected by the Council of Trade Unions and figure 2 both show.
New Zealand returned to trend growth in real GDP per working age New Zealander between 1992 and 2007, which is straight after the passage of the Employment Contracts Act 1991 – see figure 2. Coincidence?
Figure 3: Real GDP per New Zealander and Australian aged 15-64, converted to 2013 price level with updated 2005 EKS purchasing power parities, 1.9 per cent detrended, base 100 = 1974, 1956-2013, $US
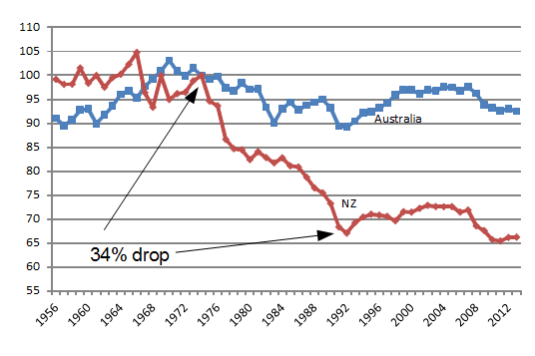
Source: Computed from OECD Stat Extract and The Conference Board, Total Database, January 2014, http://www.conference-board.org/economics
In Figure 3, a flat line equates to a 1.9% annual growth rate in real GDP per working age person; a falling line is a below trend growth rate; a rising line is an above 1.9% growth rate of real GDP per working age person. The trend growth rate of 1.9% per working age person is the 20th century trend growth rate that Edward Prescott currently estimates for the global industrial leader, which is the United States of America.
Figure 3 shows that there was a 34% drop against trend growth in real GDP per working age New Zealander between 1974 and 1992; a return to trend growth between 1992 and 2007; and a recession to 2010. this 34% drop against trend productivity growth is looked upon by the Council of Trade Unions as some sort of good old days.
A long period of no labour productivity growth and little real GDP per capita growth are pretty good reasons to rethink New Zealand’s economic policies at a fundamental level, which is exactly what happened after 1984 with the election of a Labour Government.
The unions have conveniently provided another explanation for the Lost Decades of growth in New Zealand from 1974 to 1992. That is the rapid growth of real wages ahead of real GDP per capita in the seven years before growth stalled in New Zealand in 1974 in the snapshot above. This real wages breakout was followed by two decades of lost growth.
Most ironically of all, steady growth in real wages in New Zealand did not return until after the passage of the Employment Contracts Act in 1991! After nearly 20 years of no real wages growth, real wages growth returned at long last in 1995.
After staying at about $24 per hour for 20 years from 1975 in the good old days of union power and collective bargaining, average wages in New Zealand have increased from $24 an hour to about $28 per hour by 2014 in one of the most deregulated labour markets in the world.
The Council of Trade Unions regards the return of real wages growth after a 20 year hiatus as an unwelcome development or something to complain about.
A History of the Alt-Right
Econ Prof at George Mason University, Economic Historian, Québécois
Celebrating humanity's flourishing through the spread of capitalism and the rule of law
Scholarly commentary on law, economics, and more
Beatrice Cherrier's blog
Celebrating humanity's flourishing through the spread of capitalism and the rule of law
Celebrating humanity's flourishing through the spread of capitalism and the rule of law
Celebrating humanity's flourishing through the spread of capitalism and the rule of law
Why Evolution is True is a blog written by Jerry Coyne, centered on evolution and biology but also dealing with diverse topics like politics, culture, and cats.
Celebrating humanity's flourishing through the spread of capitalism and the rule of law
Celebrating humanity's flourishing through the spread of capitalism and the rule of law
A rural perspective with a blue tint by Ele Ludemann
DPF's Kiwiblog - Fomenting Happy Mischief since 2003
Celebrating humanity's flourishing through the spread of capitalism and the rule of law
The world's most viewed site on global warming and climate change
Tim Harding's writings on rationality, informal logic and skepticism
A window into Doc Freiberger's library
Let's examine hard decisions!
Commentary on monetary policy in the spirit of R. G. Hawtrey
Thoughts on public policy and the media
Celebrating humanity's flourishing through the spread of capitalism and the rule of law
Politics and the economy
A blog (primarily) on Canadian and Commonwealth political history and institutions
Reading between the lines, and underneath the hype.
Economics, and such stuff as dreams are made on
"The British constitution has always been puzzling, and always will be." --Queen Elizabeth II
Celebrating humanity's flourishing through the spread of capitalism and the rule of law
Celebrating humanity's flourishing through the spread of capitalism and the rule of law
WORLD WAR II, MUSIC, HISTORY, HOLOCAUST
Undisciplined scholar, recovering academic
Celebrating humanity's flourishing through the spread of capitalism and the rule of law
Res ipsa loquitur - The thing itself speaks
In Hume’s spirit, I will attempt to serve as an ambassador from my world of economics, and help in “finding topics of conversation fit for the entertainment of rational creatures.”
Researching the House of Commons, 1832-1868
Articles and research from the History of Parliament Trust
Reflections on books and art
Posts on the History of Law, Crime, and Justice
Celebrating humanity's flourishing through the spread of capitalism and the rule of law
Exploring the Monarchs of Europe
Cutting edge science you can dice with
Small Steps Toward A Much Better World
“We do not believe any group of men adequate enough or wise enough to operate without scrutiny or without criticism. We know that the only way to avoid error is to detect it, that the only way to detect it is to be free to inquire. We know that in secrecy error undetected will flourish and subvert”. - J Robert Oppenheimer.
The truth about the great wind power fraud - we're not here to debate the wind industry, we're here to destroy it.
Celebrating humanity's flourishing through the spread of capitalism and the rule of law
Celebrating humanity's flourishing through the spread of capitalism and the rule of law


Recent Comments