
Everyone is richer in the USA and the middle class is moving up
09 Feb 2015 Leave a comment
in economic growth, great recession, macroeconomics, poverty and inequality Tags: The Great Enrichment
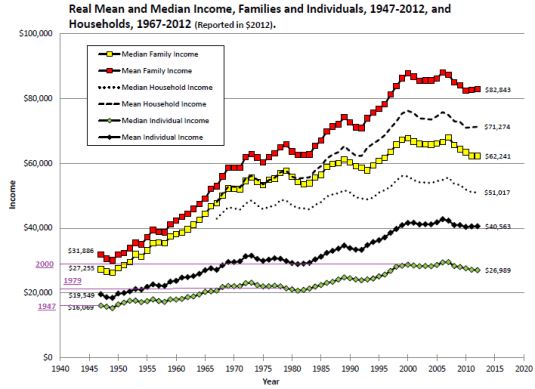
The middle class is shrinking in the USA because most of of 10% shrinkage is due to them becoming rich.

Everyone is wealthier than in the past and would have been wealthier but for the Great Recession and the countless tax rises of Obama.


The first Paul Krugman on efficiency wage arguments for a higher minimum wage
09 Feb 2015 Leave a comment
in labour economics, minimum wage, politics - Australia, politics - New Zealand, politics - USA, poverty and inequality Tags: George Bush derangement syndrome, living wage, Paul Krugman, public intellectuals

HT: economistsview
The three laws of behavioural genetics
08 Feb 2015 Leave a comment
in economics of education, human capital, occupational choice, poverty and inequality Tags: behavioural genetics, economics of personality traits, nature versus nurture


The Left and Right approaches to poverty
01 Feb 2015 Leave a comment
in applied price theory, applied welfare economics, comparative institutional analysis, liberalism, poverty and inequality, welfare reform Tags: capitalism and freedom, Leftover Left, poverty and inequality, The Great Enrichment
The Upside of Income Inequality » Gary Becker and Kevin Murphy
01 Feb 2015 Leave a comment
in economics of education, human capital, labour economics, liberalism, occupational choice, poverty and inequality Tags: education premium, educational attainment, graduate premium, The Great Enrichment


The average American household was poorer in 2013 than it was in 1983 – Vox
31 Jan 2015 1 Comment
in applied welfare economics, population economics, poverty and inequality, technological progress Tags: Brad De Long, The Great Enrichment, The Great Escape, The Great Fact, time machines
/cdn0.vox-cdn.com/uploads/chorus_asset/file/3351202/vox-chart_net-worth-change-v2_1024.0.png)
US net worth rose considerably over that period, which is what you would expect to see.
Technology has improved and productivity increased, so society has a greater capacity for wealth building. America was also quite a bit older on average in 2013 than it was in 1983, so average wealth should have gone up.
But all of these gains went to the top 20 percent of the population. It’s worse than that, actually.
Over 100 percent of the gains went to the top 20 percent, because the bottom 60 percent of the population got poorer.
What does this claim by Matthew Yglesias exactly mean? He writes frequently on economics, so his editor must think he knows something about it.
http://t.co/0hEAL8X1kS—
EPI Chart Bot (@epichartbot) July 04, 2015
If 60% of the population got poorer as compared to 1983, they would be better off stepping into a time machine to go back to 1983. That is the only logical interpretation of this claim about 60% of the population. I owe this time machine thought experiment to Brad De Long.

Of course, going back to 1983, would involve giving up all products and services invented since then, and all product upgrades since then.
https://twitter.com/classicepics/status/561432237976322048
More importantly, for a good proportion of the population, they have become very sick or die immediately when they stepped out side of the Time Machine. This is because of shorter life expectancies in 1983 and the unavailability of a whole range of lifesaving medicines.

Am I just pedantic because I want access to crucial diabetic and other medications unavailable 30 years ago? No Internet, no cable, no international travel and no mobile phones.

In his original thought experiment, De Long asks how much you would want in additional income to agree to go back in time to a specific year. De Long was an economic historian examining the differences in living standards as compared to 1890 and 1990 and how that gap is greatly underestimated in economic statistics. De Long would have refused to go into the time machine to return to 1890 unless he could pack a very large bag to take with him:
I would want, first, health insurance: the ability to go to the doctor and be treated with late-twentieth-century medicines.
Franklin Delano Roosevelt was crippled by polio. Without antibiotic and adrenaline shots I would now be dead of childhood pneumonia.
The second thing I would want would be utility hookups–electricity and gas, central heating, and consumer appliances.
The third thing I want to buy is access to information–audio and video broadcasts, recorded music, computing power, and access to databases.
None of these were available at any price back in 1890.
Postwar vs. New Gilded Age: How did the middle class do?
28 Jan 2015 Leave a comment
in applied welfare economics, economic growth, income redistribution, politics - USA, poverty and inequality Tags: middle class stagnation
Greece should default and abandon the euro – Jeff Miron
27 Jan 2015 Leave a comment
in budget deficits, currency unions, development economics, economic growth, economic history, Euro crisis, fiscal policy, global financial crisis (GFC), growth disasters, law and economics, macroeconomics, poverty and inequality Tags: currency unions, Euroland, Greece, optimal currency area, sovereign default

New Zealand – Chartbook of Economic Inequality
20 Jan 2015 Leave a comment
in applied welfare economics, politics - New Zealand, poverty and inequality Tags: Gini coefficient, poverty and inequality, top 1%
| Has the dispersion of earnings been increasing in recent decades? | Yes, the top decile has risen from 143 per cent of median in 1986 to 186 per cent in 2012. |
| Has overall inequality increased in recent years? | No, the Gini coefficient has been relatively stable around 32 percent since 1996. However, it rose by 7 percentage points between 1988 and 1996. |
| Have there been periods when overall inequality fell for a sustained period? | Yes, from mid-1950s to mid-1970s. |
| Has poverty been falling or rising in recent decades? | Poverty has substantially increased from 1996 to 2004 before decreasing mildly till 2009. |
| Has there been a U-pattern for top income shares over time? | Yes, top gross income shares fell from mid-1950s to mid-1980s, then rose from mid-1980s to mid-1990s. |
| Has the distribution of wealth followed the same pattern as income? | Insufficient evidence. |
| Additional noteworthy features | U-shape over post-war period. Top income shares estimates for the years 1998, 1999 and 2000 are affected by changes in the income tax laws. Top shares series have a break in 1951 (change in tax units). |

You are welcome to share but please refer to A. B. Atkinson and S. Morelli (2014) – ‘The Chartbook of Economic Inequality’ at http://www.ChartbookOfEconomicInequality.com
This visualisation is licensed under a Creative Commons BY-NC-SA license Data visualisation by: Max Roser
Child poverty and single parent households in the USA
15 Jan 2015 Leave a comment
in labour economics, poverty and inequality, welfare reform Tags: child poverty, single parenthood
 Utopia, you are standing in it!
Recent Comments