
via Blacks Must Confront Reality About Racial Discrimination – Capitalism Magazine.
Celebrating humanity's flourishing through the spread of capitalism and the rule of law
11 Jan 2015 1 Comment
in applied welfare economics, discrimination, labour economics, poverty and inequality Tags: family demographics, racial discrminaition
09 Jan 2015 Leave a comment
in economics of education, human capital, poverty and inequality, survivor principle Tags: charter schools, School choice
The claim made in the letter to the Co-leader of the Maori party before the charter schools bill was passed by the New Zealand Parliament was that charter schools is “An unproven experiment is not the answer.”
Experiments are pointless if you already know the answer.
The answer is charter schools – An experiment that has proven to be immensely popular among minority parents in the USA.
Charter schools are growing fastest in New Orleans, Washington DC and Detroit – all predominately black cities with terrible public school systems.
The predominately black electorates want to experiment with something that might be better than the existing system that has failed them.
Dear Dr Sharples,
View original post 55 more words
19 Dec 2014 Leave a comment
in applied welfare economics, economic history, entrepreneurship, politics - USA, poverty and inequality

Source: “Income Inequality in the United States, 1913-1998” with Thomas Piketty, Quarterly Journal of Economics, 118(1), 2003, 1-39
(Tables and Figures Updated to 2012 in Excel format, September 2013) via Chad Jones
Before 1940, most of the income of the top 0.1% of income earners in the USA was income from investments.
By the end of the 20th century, the top 0.1% were earning their incomes as wages and salaries, business incomes and capital gains. Very little of that income of the top 0.1% was in the form of passive income from capital. The top 0.1% of the USA are now working rich – entrepreneurs.
19 Dec 2014 1 Comment

19 Dec 2014 Leave a comment
in applied welfare economics, labour economics, labour supply, poverty and inequality, welfare reform Tags: causes of poverty, single parenthood


via The unbelievable rise of single motherhood in America over the last 50 years – The Washington Post.
15 Dec 2014 Leave a comment
in applied welfare economics, labour economics, liberalism, minimum wage, poverty and inequality Tags: earned income tax credit, family tax credits, in-work tax credits, minimum wage, negative income tax, poverty and inequality
13 Dec 2014 1 Comment
in applied price theory, applied welfare economics, labour economics, liberalism, poverty and inequality Tags: causes of poverty, inequality and poverty, school breakfast programmes, The Great Fact
13 Dec 2014 Leave a comment
in discrimination, gender, labour economics, poverty and inequality Tags: gender wage gap, Gini coefficient, poverty and inequality, top 1%
What is claimed to have gone wrong by the op-ed in The Guardian overnight?
A stark rich-poor divide, the OECD argued, had taken over a third off the country’s economic growth rate in the last 20 years. But how could this be?
The simple answer is that in the two decades from 1985 onwards, New Zealand had the biggest increase in income gaps of any developed country.
Incomes for the richest Kiwis doubled, while those of the poorest stagnated. Middle income earners didn’t do too well, either.
Are these claims true? That is, in the two decades from 1985 onwards, have the incomes of the richest Kiwis doubled, while those of the poorest stagnated and have a middle income earners not done too well either?
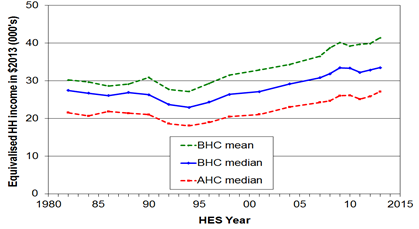
Figure 1 shows that prior to the recent recession starting in 2009, there were 15 years of steady growth in median household incomes. As will be shown, most of the period covered both by the op-ed in the Guardian, and by the OECD paper was an economic boom.
Figure 1: Real household income trends before housing costs (BHC) and after housing costs (AHC), 1982 to 2013 ($2013)
Source: Bryan Perry, Household incomes in New Zealand: Trends in indicators of inequality and hardship 1982 to 2013. Ministry of Social Development (July 2014).
Perry (2104) found that net income gains from the mid-1990s to 2013 were similar for all income groups, so income inequality in 2013 was also similar to the mid-1990s – see Figure 2.
Figure 2: Real household incomes (BHC), changes for top of income deciles, 1994 to 2013
![clip_image002[7]](https://utopiayouarestandinginit.com/wp-content/uploads/2014/12/clip_image0027.png "clip_image002[7]")
Source: (Perry 2014).
Importantly, in the OECD analysis, much was made of what was happening to the 40% income decile. As can be seen from figure 2, this decile gained as much as any other group in New Zealand from the income growth between 1994 and 2013.
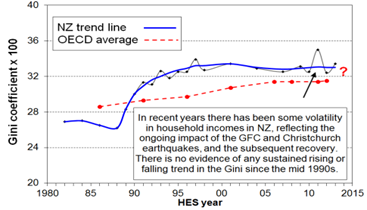
The Gini coefficient in figure 3 , which years the most common measure of inequality, shows no evidence of a rise in income inequality since the mid-1990s. The trend-line of the genie coefficient in figure 3 is almost flat since the early 1990s .
Figure 3: Gini coefficient New Zealand 1980-2015
Source: (Perry 2014).
To make things more awkward, the large increase in income inequality in New Zealand in the late 1980s and early 1990s shown in figure 3 was followed by a 15 year economic boom after 20 years of economic stagnation – next to no income growth – as is shown in figure 4.
Figure 4: Real GDP per New Zealander and Australian aged 15-64, converted to 2013 price level with updated 2005 EKS purchasing power parities, 1956-2013

Source: Computed from OECD Stat Extract and The Conference Board, Total Database, January 2014, http://www.conference-board.org/economics
The lost decades of the growth in the 1970s and 1980s were replaced with a long boom. Trend growth of 2% per year returned after this increase in inequality – see figure 4.
The gains since the economic boom since the early 1990s has been broadly based both up and down the income distribution and by ethnicity. As shown in figure 5, between 1994 and 2010, real equivalised median household income rose 47% from 1994 to 2010; for Māori, this rise was 68%; for Pasifika, the rise was 77%.
Figure 5: Real equivalised median household income (before housing costs) by ethnicity, 1988 to 2013 ($2013).
![clip_image002[9]](https://utopiayouarestandinginit.com/wp-content/uploads/2014/12/clip_image00292.png "clip_image002[9]")
Source: (Perry 2014).
These improvements in Māori incomes since 1992 were based on rising Māori employment rates, fewer Māori on benefits, more Māori moving into higher paying jobs, and greater Māori educational attainment should be celebrated and consolidated. Māori unemployment reached a 20-year low of 8 per cent from 2005 to 2008.
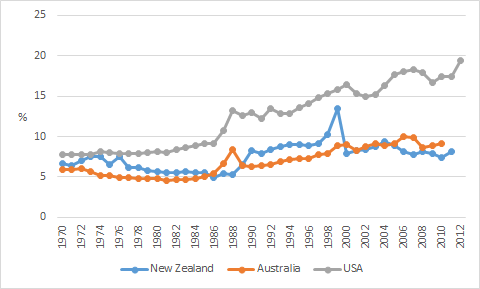
As for the top 1%, as shown by Figure 6, their income share has been steady at 8-9% since the mid-1990s. It was only in the USA the top 1% share continued to rise strongly, from 13% to 19%.
Figure 6: income shares of the top 1% of earners, New Zealand, Australia and USA
source: Top incomes database
Over the last more than two decades in New Zealand, there has been sustained income growth spread across all of society. Perry (2014) concluded that:
Overall, there is no evidence of any sustained rise or fall in inequality in the last two decades.
The level of household disposable income inequality in New Zealand is a little above the OECD median.
The share of total income received by the top 1% of individuals is at the low end of the OECD rankings.
What is claimed as the causes of this growing rich-poor divide that is also slowing growth by a third?
Tracing the causes of a growing income gap is like trying to map earthquake fault lines – never a precise science – but it is hard to ignore the correlation between the timing of the increase and the country’s post-1984 political revolution.
Embracing reforms known elsewhere as Thatchernomics and Reaganomics with unprecedented enthusiasm, New Zealand halved its top tax rate, cut benefits by up to a quarter of their value, and dramatically reduced the bargaining power – and therefore the share of national income – of ordinary workers.
Thousands of people lost their jobs as manufacturing work went overseas, and there was no significant response with increased trade training or skills programmes, a policy failure that is on-going.
At the same time, New Zealand stopped building affordable houses in any serious quantity, forcing poorer households to spend ever-increasing amounts on rent and mortgages.
As will be recalled from Figure 4, the economic reforms in New Zealand were followed by a long economic boom starting in 1992 that only came to an end with the onset of the global financial crisis.
Figure 7 shows that from 1994, the proportion of the lowest income households spending more than 30% of their income on housing fell steadily, reaching 34% by 204.
Figure 7: Proportion of households spending more than 30% of their income on housing costs by income quintile, New Zealand 1988–2013 HES years

Source: Perry (2014)
Housing affordability was improving for much of the period in which the op-ed in the Guardian was claiming it was getting worse. The increase in housing unaffordability in the late 1980s and early 1990s coincided with a deep recession and a cut in welfare benefits.
Housing affordability has become an issue in New Zealand because of rising prices. Supply is not keeping up with demand.
There were considerable increases in prices throughout the house price distribution between 2004 and 2008. Median house price increasing by over 50% between 2004 and 2008; the price rises were largest among the lower price houses.
It was not a case of a decline in demand under the hypothesis that is put forward in the op-ed in the Guardian. For that hypothesis to hold, housing prices would somehow have to fall in the price range of ordinary workers. That is not the case.
Furthermore, the large increase in housing prices and decline in housing affordability occurred a decade and more after the increase in inequality in the late 1980s and early 1990s. The timing is out.
Another inconvenience for the rich poor divide hypothesis is during the housing price boom after 2004 rent to disposable income for all income quintiles remained relatively constant. Rents were stable.
Poorer households are more likely to rent, and therefore much less likely to be affected by the housing affordability crisis in New Zealand as that was mostly about home ownership.
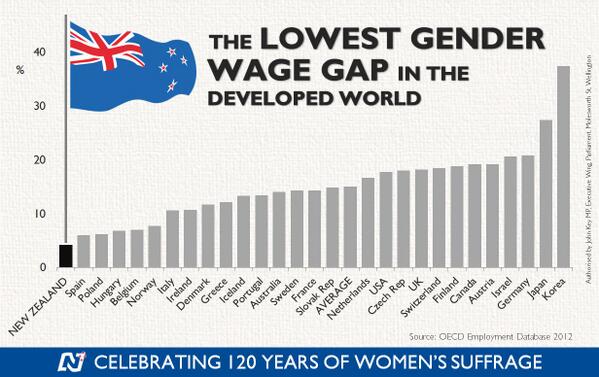
Gender analysis! Gender analysis? Where is the gender analysis? Over the last 20 to 30 years, the gender gap has closed substantially in terms of wages and employment. Young women now outnumber young men two to one at university.

New Zealand has the smallest gender wage gap in the Western world. That is inconsistent with the notion in New Zealand has a rich poor divide. Instead New Zealand appears to be an egalitarian paradise as long as you are not a boy!
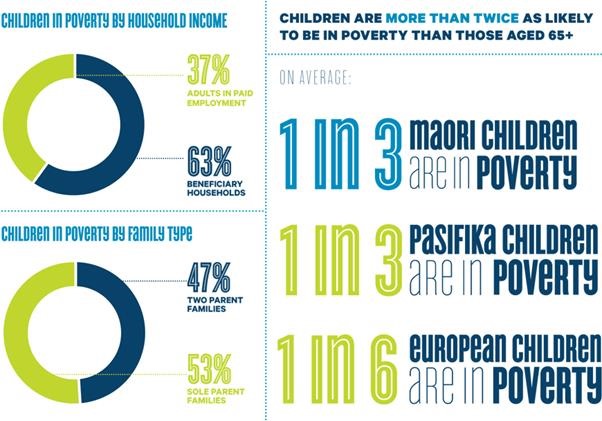
The major driver of inequality in New Zealand and overseas is the rising number of two-income households made up of two well-educated parents and one or two children and many more single parent households on low pay or no one in paid employment in the house. Well-educated couples form into high income households; fewer of the less educated marry and too many end up a single mothers.
Source: closertogether.org.nz
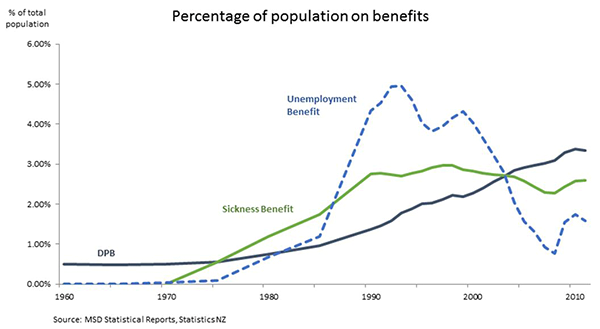
The main cause of poverty in New Zealand is dependency on welfare benefits and in particular the number of single parents. Child poverty in beneficiary families is 75% to 80%, much higher than in families with at least one adult in full-time employment (11% in 2012 and 2013). The payment of welfare benefits to families who do not work guarantees an income to people not in a job, but it creates incentives not to work.
The economic and sociological literatures overseas increasingly suggesting that skill disparities resulting from a lower quality education and less access to good parenting, peer and neighbourhood environments produce most of the income gaps of racial and ethnic minorities rather than factors such as labour market discrimination.
12 Dec 2014 Leave a comment
in labour economics, labour supply, poverty and inequality, welfare reform Tags: labour economics, welfare reform
Paradoxically, the main way of using financial incentives to increase net labour supply of beneficiaries and move more off the benefit is to toughen the benefit abatement regime.
This increase in the abatement rates on welfare benefits for earned income moves more off the benefit and moves more into full-time employment but still with an ambiguous effect on part-time employment. Some may prefer the benefit over their current part-time job.
The notion that tinkering with financial incentives will not have large effects on labour supply and benefit numbers is not new. Increase in the generosity of welfare benefits with increase the number of applicants.
Tinkering with the details of abatement rates and thresholds has ambiguous labour supply effects because exits from welfare are still offset by new entry onto welfare. The netting the labour supply changes of these diverse groups often leads to welfare reform leading to positive but small change in labour supply. Quantitatively, an old finding is the remarkable lack of effects of financial incentives on welfare participation (Moffitt 1992, 2002).
Under a move up to a 100 per cent benefit abatement rate as shown in Figure 1; arrow 1 in Figure 1 shows that some who were working part-time will now find not working at all to be the more attractive option. The new 100 per cent benefit abatement rate reduces their take-home pay but they enjoy more leisure time.
Figure 1: the labour supply effects of an increase to a 100 per cent benefit abatement rate

Arrow 2 in Figure 1 shows that some part-time workers increase their working hours because working a little more mitigates the reduction in their take-home pay and allow some leisure time.
Arrow 3 in Figure 1 shows that some part-timers return to full-time working hours because of the revised leisure-labour trade off that now makes a somewhat higher take-home pay worthwhile despite reduced leisure time.
Whether net labour supply increases or falls after a rise in the benefit abatement rate to 100 per cent depends on the relative numbers of workers at different points on the budget constraint that are working full-time, not working, and working part-time and the magnitudes of their responses.
Some will stay as they are working either full-time, not working or working part-time. Others supply more labour. Working more hours may increase their take-home pay depending on how productivity they are.
Some part-timers will move to full-time in low paid jobs with take-home pay because of the loss of benefit income, they will enjoy less leisure time and there can be additional costs such as child care.
More productive workers in better paid jobs will take home more in pay by moving to full-time but will enjoy less leisure time. Some workers that were previously working part-time stop working and rely in welfare benefits.
If reduced welfare dependence is the objective, high abatement rates and low abatement thresholds are the path to follow. With a move to 100 per cent abatement of benefits, some leave the welfare system but no one joins it because of the higher abatement rate.
Less generous abatement will see some who claim the benefit while working part-time move to a lower take-home pay. Some will be on a higher take-home pay working full-time. The net labour supply effect is ambiguous because some leave work altogether while others work more hours.
The net labour supply depends on the relative numbers at different points on the budget constraint working full-time, not working, or working part-time and the magnitudes of their respective individual labour supply responses. Some people will stay as they are working full-time, not working or working part-time.
No one who previously did not work is worse off under the benefit abatement rate increase to 100 per cent because they are unaffected by abatement. Some who were working part-time and previously claiming the benefit take-home less but enjoy more leisure as shown by arrow 2 in Figure 1. The remaining part-time workers now take-home more pay but enjoy less leisure because they are working more hours and even full-time as shown by arrow 3 in Figure 1.
The blogs so far
part-one-the-labour-leisure-trade-off-and-the-rewards-for-working
part-two-the-labour-supply-effects-of-welfare-benefit-abatement-rate-changes
part-3-abatement-free-income-thresholds-and-labour-supply
part-4-in-work-tax-credits-and-labour-supply
part-5-higher-abatement-rates-and-labour-supply
11 Dec 2014 Leave a comment
in economics of education, human capital, international economics, labour supply, occupational choice, poverty and inequality Tags: Bryan Caplan, Charles Murray, IQ and education, poverty and inequality, signalling
Charles Murray has been cooking with gas lately – on fire. One of his points is too many go to college. Murray points out that succeeded at college requires an IQ of at least 115 but 84% of the population don’t have this:
Historically, an IQ of 115 or higher was deemed to make someone “prime college material.”
That range comprises about 16 per cent of the population.
Since 28 per cent of all adults have BAs, the IQ required to get a degree these days is obviously a lot lower than 115.
Those on the margins of this IQ are getting poor advice to go to college. Murray argues that other occupational and educational choices would serve them better in light of their abilities and likelihood of succeeding at college. Moreover, Murray is keen on replacing college degrees with certification after shorter periods of study such as in the certified public accountants exam.
Murray believes a lot of students make poor investments by going on to College, in part, because many of them don’t complete their degrees:
…even though college has been dumbed down, it is still too intellectually demanding for a large majority of students, in an age when about 50 per cent of all high school graduates are heading to four-year colleges the next fall.
The result is lots of failure. Of those who entered a four-year college in 1995, only 58 per cent had gotten their BA five academic years later.
Murray does not want to abandon these teenagers:
Recognizing the fact that most young people do not have ability and/or the interest to succeed on the conventional academic track does not mean spending less effort on the education of some children than of others.
…Too few counsellors tell work-bound high-school students how much money crane operators or master stonemasons make (a lot).
Too few tell them about the well-paying technical specialties that are being produced by a changing job market.
Too few assess the non-academic abilities of work-bound students and direct them toward occupations in which they can reasonably expect to succeed.
Worst of all: As these students approach the age at which they can legally drop out of school, they are urged to take more courses in mathematics, literature, history and science so that they can pursue the college fantasy. Is it any wonder that so many of them drop out?
To add to that, he is in the Bryan Caplan School: education is often an elaborate former of signalling for many degrees. Murray says that college is a waste of time because:
Outside a handful of majors — engineering and some of the sciences — a bachelor’s degree tells an employer nothing except that the applicant has a certain amount of intellectual ability and perseverance.
Even a degree in a vocational major like business administration can mean anything from a solid base of knowledge to four years of barely remembered gut courses.
If the OECD is to be believed, that not enough people are going to college from lower middle class families, obviously IQ is not one of the constraints on access to college Charles Murray suggested it to be.

The growing strength of the case that education is a form of signalling is a literature that the now famous OECD paper reviewed, found wanting, but did not have time to discuss in the working paper.

Another contemporary theme the OECD paper reviewed, found wanting, but did not have time to discuss is a large number of graduates who end up holding jobs that do not require a university education – going to college:
About 48 per cent of employed U.S. college graduates are in jobs that the Bureau of Labor Statistics (BLS) suggests requires less than a four-year college education.
Eleven per cent of employed college graduates are in occupations requiring more than a high-school diploma but less than a bachelor’s, and 37 per cent are in occupations requiring no more than a high-school diploma.
The proportion of overeducated workers in occupations appears to have grown substantially; in 1970, fewer than one per cent of taxi drivers and two per cent of fire-fighters had college degrees, while now more than 15 per cent do in both jobs
All in all, the OECD has gone into the dragons den by backing the accumulation of human capital as its mechanism to link inequality with lower growth. No matter how you spin it, this linking of lower economic growth to greater inequality through financial constraints on the accumulation of human capital by the lower middle class was a bold hypothesis.

The case for investing more in education is not a slam dunk. Higher education – university or polytechnic – is a rat race that many don’t need to join.The case for the government paying a great many more to join that rat race is rather weak.
Celebrating humanity's flourishing through the spread of capitalism and the rule of law
Celebrating humanity's flourishing through the spread of capitalism and the rule of law
Celebrating humanity's flourishing through the spread of capitalism and the rule of law
Celebrating humanity's flourishing through the spread of capitalism and the rule of law
Celebrating humanity's flourishing through the spread of capitalism and the rule of law
A History of the Alt-Right
Econ Prof at George Mason University, Economic Historian, Québécois
Celebrating humanity's flourishing through the spread of capitalism and the rule of law
Scholarly commentary on law, economics, and more
Beatrice Cherrier's blog
Celebrating humanity's flourishing through the spread of capitalism and the rule of law
Celebrating humanity's flourishing through the spread of capitalism and the rule of law
Celebrating humanity's flourishing through the spread of capitalism and the rule of law
Why Evolution is True is a blog written by Jerry Coyne, centered on evolution and biology but also dealing with diverse topics like politics, culture, and cats.
Celebrating humanity's flourishing through the spread of capitalism and the rule of law
A rural perspective with a blue tint by Ele Ludemann
DPF's Kiwiblog - Fomenting Happy Mischief since 2003
Celebrating humanity's flourishing through the spread of capitalism and the rule of law
The world's most viewed site on global warming and climate change
Tim Harding's writings on rationality, informal logic and skepticism
A window into Doc Freiberger's library
Let's examine hard decisions!
Commentary on monetary policy in the spirit of R. G. Hawtrey
Thoughts on public policy and the media
Celebrating humanity's flourishing through the spread of capitalism and the rule of law
Politics and the economy
A blog (primarily) on Canadian and Commonwealth political history and institutions
Reading between the lines, and underneath the hype.
Economics, and such stuff as dreams are made on
"The British constitution has always been puzzling, and always will be." --Queen Elizabeth II
Celebrating humanity's flourishing through the spread of capitalism and the rule of law
Celebrating humanity's flourishing through the spread of capitalism and the rule of law
WORLD WAR II, MUSIC, HISTORY, HOLOCAUST
Undisciplined scholar, recovering academic
Celebrating humanity's flourishing through the spread of capitalism and the rule of law
Res ipsa loquitur - The thing itself speaks
In Hume’s spirit, I will attempt to serve as an ambassador from my world of economics, and help in “finding topics of conversation fit for the entertainment of rational creatures.”
Researching the House of Commons, 1832-1868
Articles and research from the History of Parliament Trust
Reflections on books and art
Posts on the History of Law, Crime, and Justice
Celebrating humanity's flourishing through the spread of capitalism and the rule of law
Exploring the Monarchs of Europe
Cutting edge science you can dice with
Small Steps Toward A Much Better World
“We do not believe any group of men adequate enough or wise enough to operate without scrutiny or without criticism. We know that the only way to avoid error is to detect it, that the only way to detect it is to be free to inquire. We know that in secrecy error undetected will flourish and subvert”. - J Robert Oppenheimer.




 Utopia, you are standing in it!
Recent Comments