
Source: OECD StatExtract
Celebrating humanity's flourishing through the spread of capitalism and the rule of law
25 May 2015 Leave a comment
in economic history, labour economics, politics - Australia, politics - New Zealand, politics - USA, unions Tags: Australia, British economy, Canada, trade union density, union power, union wage premium
Source: OECD StatExtract
25 May 2015 1 Comment
in economic growth, economic history, economics of regulation, industrial organisation, job search and matching, labour economics, unions Tags: Employment Contracts Act, employment law, employment protection laws, employment regulation, labour market deregulation, lost decades, union power
The Council of Trade Unions scored something of an own goal in the 2014 election campaign when it was denouncing the Employment Contracts Act 1991 as the reason for wages growth have not kept up with GDP per capita growth since its passage in 1991. Its evidence in chief against the deregulation of the New Zealand labour market is in the snapshot below showing their graph of real GDP per capita and average real wages from 1965 to 2014.

Source: Low Wage Economy | New Zealand Council of Trade Unions – Te Kauae Kaimahi.
The chart selected by the Council of Trade Unions shows several distinct trends in wages growth and real GDP growth per capita in New Zealand. None of these trends nor breaks in trends support the hypothesis that the days prior to the Employment Contracts Act 1991 were the good old days where workers shared generally in gains from economic growth.
From about 1970 to 1975 in the snapshot below of the Council of Trade Unions chart there was rapid real wages growth, well in excess of real growth in per capita GDP. This wages breakout was followed by some ups and downs but essentially wages in 1995 were no different from what they were in 1975. Real wages were about $24 per hour in real terms in New Zealand for about 20 years – from 1975 to 1995.

These are the good old days in the eyes of the Council of Trade Unions. No real wages growth for 20 years. There was no real GDP per capita growth from 1975 until 1979 nor in the five years leading up to the passage of the Employment Contracts Act 1991 in the chart selected by the Council of Trade Unions in the snapshot above.
The period leading up to 1975 in the preceding wages breakout was the zenith of union membership with nearly 70% of all workers belonging to a union – see figure 1. What followed from 1975 was a long declining in trade union membership that did not end until just after the Employment Contracts Act in 1991 – see figure 1.
Figure 1: Trade union densities, New Zealand, Australia, United Kingdom and United States, 1970–2013

Source: OECD StatExtract.
Whatever happened to union power in New Zealand happened before the passage of the Employment Contracts Act 1991 and with it the deregulation of the New Zealand labour market. 20 years of no real wages growth and economic stagnation may explain part of the decline of unions in New Zealand.
Real GDP per capita growth was pretty stagnant after 1975 to 1994 in the chart of data selected by the Council of Trade Unions, which is why I have previously referred to 1974 to 1992 as New Zealand’s Lost Decades – see figures 2 and 3.
Figure 2: Real GDP per New Zealander and Australian aged 15-64, converted to 2013 price level with updated 2005 EKS purchasing power parities, 1956-2013, $US
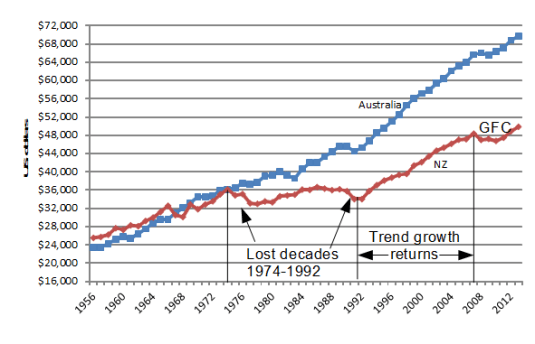
Source: Computed from OECD Stat Extract and The Conference Board, Total Database, January 2014, http://www.conference-board.org/economics
Figure 2 shows that New Zealand lost two decades of productivity growth between 1974 and 1992 after level pegging with Australia for the preceding two decades.
These lost decades of growth are the unions’ good old days but workers cannot share in the general gains of economic growth when there isn’t any economic growth as the chart selected by the Council of Trade Unions and figure 2 both show.
New Zealand returned to trend growth in real GDP per working age New Zealander between 1992 and 2007, which is straight after the passage of the Employment Contracts Act 1991 – see figure 2. Coincidence?
Figure 3: Real GDP per New Zealander and Australian aged 15-64, converted to 2013 price level with updated 2005 EKS purchasing power parities, 1.9 per cent detrended, base 100 = 1974, 1956-2013, $US
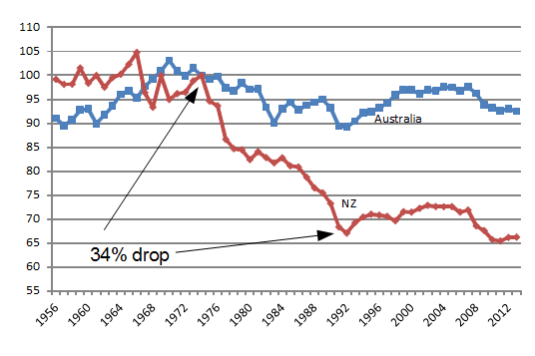
Source: Computed from OECD Stat Extract and The Conference Board, Total Database, January 2014, http://www.conference-board.org/economics
In Figure 3, a flat line equates to a 1.9% annual growth rate in real GDP per working age person; a falling line is a below trend growth rate; a rising line is an above 1.9% growth rate of real GDP per working age person. The trend growth rate of 1.9% per working age person is the 20th century trend growth rate that Edward Prescott currently estimates for the global industrial leader, which is the United States of America.
Figure 3 shows that there was a 34% drop against trend growth in real GDP per working age New Zealander between 1974 and 1992; a return to trend growth between 1992 and 2007; and a recession to 2010. this 34% drop against trend productivity growth is looked upon by the Council of Trade Unions as some sort of good old days.
A long period of no labour productivity growth and little real GDP per capita growth are pretty good reasons to rethink New Zealand’s economic policies at a fundamental level, which is exactly what happened after 1984 with the election of a Labour Government.
The unions have conveniently provided another explanation for the Lost Decades of growth in New Zealand from 1974 to 1992. That is the rapid growth of real wages ahead of real GDP per capita in the seven years before growth stalled in New Zealand in 1974 in the snapshot above. This real wages breakout was followed by two decades of lost growth.
Most ironically of all, steady growth in real wages in New Zealand did not return until after the passage of the Employment Contracts Act in 1991! After nearly 20 years of no real wages growth, real wages growth returned at long last in 1995.
After staying at about $24 per hour for 20 years from 1975 in the good old days of union power and collective bargaining, average wages in New Zealand have increased from $24 an hour to about $28 per hour by 2014 in one of the most deregulated labour markets in the world.
The Council of Trade Unions regards the return of real wages growth after a 20 year hiatus as an unwelcome development or something to complain about.
12 May 2015 Leave a comment
in economics of bureaucracy, economics of education, labour economics, labour supply, occupational choice, Public Choice, rentseeking, unions Tags: public sector wage premium, union power, union wage premium
12 May 2015 1 Comment
in discrimination, gender, human capital, labour economics, politics - New Zealand, unions Tags: employer discrimination, gender wage gap, gender wage gap discrimination, government discrimination, New Zealand Greens, sex discrimination
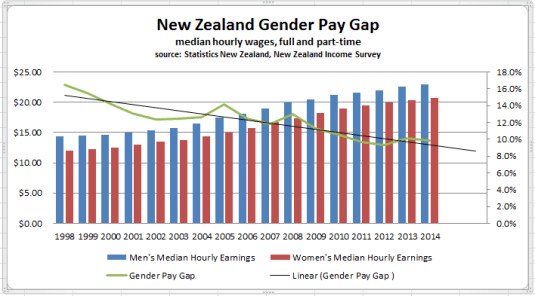
The unions representing public servants and the Green Party are very excited about the gender wage gap this week. So much so that the public service union presented the Treasury with an invoice for that wage gap in the public sector of 14.1%.
Women in the public service are paid 14.1% less than men. We've invoiced @honbillenglish for the missing $294,827,136 http://t.co/QW5z4tU7bv—
(@NZPSA) May 11, 2015
Oddly enough, despite their concerns with the gender wage gap in the public service, the public service unions are stridently against both privatisation and contracting out.
It is almost trite to note is that one of the earliest analytical results in the labour economics of discrimination was that profit maximising employers are much less likely to discriminate than firms that are not subject to a profit and loss constraint and the discipline of bankruptcy.
A prejudiced employer pays a wage above the competitive wage to attract the particular recruits he or she is prejudiced in favour of and does not hire enough workers because he must pay higher wages. This results in lower output and profits than without discrimination.
@greencatherine Unadjusted NZ gender pay gap is 6%, the best in world. http://t.co/2fYuVbJg9E—
Jim Rose (@JimRose69872629) March 19, 2015
Bureaucrats can indulge their prejudices without putting the survival of their business in jeopardy. Entrepreneurs who don’t hire on merit risk running out of going out of business because their costs are hire and their businesses less productive.
…market mechanisms impose inescapable penalties on profits whenever for-profit enterprises discriminate against individuals on any basis other than productivity. Though bigoted managers may hold sway for a time, in the long run the profit penalty makes profit-seeking enterprises tenacious champions of fair treatment.
Early examples of the greater propensity for discrimination in the public sector and non-profit organisations are by Armen Alchian and Ruben Kessel in Competition, Monopoly, and the Pursuit of Money in 1962 and Gary Becker’s pioneering The Economics of Discrimination in 1957.

24 Apr 2015 Leave a comment
in labour economics, unions Tags: union power, union wage premium, Withering away of the proletariat
*53* years of trade #union trends: compare your country among OECD/G7 bit.ly/1rS3hOS (scroll down for Excel) http://t.co/9NHj1YV7sL—
(@OECD) April 06, 2015
20 Apr 2015 1 Comment
in business cycles, fiscal policy, great depression, labour economics, labour supply, macroeconomics, politics - USA, unemployment, unions Tags: capital taxation, FDR, Herbert Hoover, Leftover Left, Leo Ohanian, New Deal, union power, union wage premium, unionisation
Our friends on the left at the Economic Policy Institute were good enough to remind us of the link between rapid unionisation of the US labour market in the early and mid-1930s and the petering out of the recovery from the great depression. That recession within a depression is the Roosevelt recession.
New blog on Mind The Gap: on labour #unions and income #inequality
oxfamblogs.org/mindthegap/201… http://t.co/FyrOboCaRk—
Ricardo FuentesNieva (@rivefuentes) April 17, 2015
Harold Cole and Lee Ohanian analysed in depth this double-dip depression in the USA in a paper in the Journal of Political Economy titled “New Deal Policies and the Persistence of the Great Depression: A General Equilibrium Analysis” about 10 years ago:
The recovery from the Great Depression was weak… Real gross domestic product per adult, which was 39 percent below trend at the trough of the Depression in 1933, remained 27 percent below trend in 1939. Similarly, private hours worked were 27 percent below trend in 1933 and remained 21 percent below trend in 1939.
The weak recovery is puzzling because the large negative shocks that some economists believe caused the 1929–33 downturn—including monetary shocks, productivity shocks, and banking shocks—become positive after 1933. These positive shocks should have fostered a rapid recovery, with output and employment returning to trend by the late 1930s.
The focus of the paper by Cole and Ohanian in explaining the weak recovery – the double-dip depression in the 1930s – are the New Deal cartelisation policies designed to limit competition and increase labour bargaining power through extensive unionisation of workforce.

The recovery from the depths of the Great Depression was weak but real wages in several sectors rose significantly above trend despite mass unemployment.

The view that limiting competition in product markets and the labour market was essential for economic prosperity was influential in the 1920s and 1930s. Both FDR and Hoover believed high wages were the key to prosperity.
FDR’s recipe for economic recovery from the great depression when he came to office in 1933 was raising prices and wages and the promotion of unions:
Union membership rose from about 13 percent of employment in 1935 to about 29 percent of employment in 1939, and strike activity doubled from 14 million strike days in 1936 to about 28 million in 1937.
The result of this suppression of market competition and the encouragement of unions was real wages increase despite the weak recovery:
The coincidence of high wages, low consumption, and low hours worked indicates that some factor prevented labour market clearing during the New Deal.
The combination of government interference with competition and strong unions stifled the recovery from the great depression rather than speed it up as was the plan of FDR:
New Deal labour and industrial policies did not lift the economy out of the Depression as President Roosevelt had hoped.
Instead, the joint policies of increasing labour’s bargaining power and linking collusion with paying high wages prevented a normal recovery by creating rents and an inefficient insider-outsider friction that raised wages significantly and restricted employment.
Not only did the adoption of these industrial and trade policies coincide with the persistence of depression through the late 1930s, but the subsequent abandonment of these policies coincided with the strong economic recovery of the 1940s.

U.S. unemployment fell from 22.9% in 1932 to 9.1% in 1937, a reduction of 13.8%, but was back up to 13% by 1938. The Social Security payroll tax debuted in 1937 on top of tax increases in the Revenue Act of 1935. In 1937, the economy fell into recession again. Cooley and Ohanian argue that:
The economy did not tank in 1937 because government spending declined. Increases in tax rates, particularly capital income tax rates, and the expansion of unions, were most likely responsible.
The Great Depression in the USA was unique in the fact that it was so long and the recovery, so weak:
Total hours worked per adult in 1939 remained about 21% below their 1929 level, compared to a decline of 27% in 1933… Per capita consumption did not recover at all, remaining 25% below its trend level throughout the New Deal, and per-capita non-residential investment averaged about 60% below trend.
After 1933, productivity growth was rapid, the banking system was stabilized, deflation was eliminated and there was plenty of demand stimulus as the Fed more than doubled the monetary base between 1933 and 1939. As Lee Ohanian noted:
Depressions are periods of low employment and low living standards. The normal forces of supply and demand should have reduced wages, which would have lowered business costs and increased employment and output. What prevented the normal forces of supply and demand from working?
Central to the faltering of this recovery by 1937 was the regime change when the Supreme Court finally upheld revised laws promoting unionisation:
The downturn of 1937-38 was preceded by large wage hikes that pushed wages well above their NIRA levels, following the Supreme Court’s 1937 decision that upheld the constitutionality of the National Labor Relations Act. These wage hikes led to further job loss, particularly in manufacturing.
The "recession in a depression" thus was not the result of a reversal of New Deal policies, as argued by some, but rather a deepening of New Deal polices that raised wages even further above their competitive levels, and which further prevented the normal forces of supply and demand from restoring full employment.
Lee Ohanian argues that the defining characteristic of the Great Depression was this failure of real wages to fall in the face of mass unemployment:
The defining characteristic of the Great Depression is a substantial and chronic excess supply of labour, with employment well below normal, and real wages in key industrial sectors well above normal.
Policies of Hoover and of FDR of propping up wages and encouraging unions and work sharing were the most important factors in precipitating and prolonging the Great Depression. The Great Depression was the first time U.S. wages did not fall in that you were administered a period of significant deflation.
The manufacturing sector, where unions and the threat of unionisation was much stronger which was much harder hit initially than the agricultural sector both in terms of loss of jobs and wages not falling. The Great Depression did not start as an ordinary garden variety recession, as argued by Milton Friedman. It was immediately severe and sector specific with industrial production declining by about 35% between late 1929 and the end of 1930.

This decline in industrial production occurs before any banking crises. Despite this sector specific nature of the onset that Great Depression, monetary policy might have some role in explaining the start of the Great Depression but not in its prolongation:
any monetary explanation of the Depression requires a theory of very large and very protracted monetary non-neutrality. Such a theory has been elusive because the Depression is so much larger than any other downturn, and because explaining the persistence of such a large non-neutrality requires in turn a theory for why the normal economic forces that ultimately undo monetary non-neutrality were grossly absent in this episode.

Source: A different view of the Great Depression’s cause | VOX, CEPR’s Policy Portal.
19 Apr 2015 Leave a comment
in labour economics, unions Tags: union wage premium
13 Apr 2015 1 Comment
in entrepreneurship, industrial organisation, labour economics, labour supply, managerial economics, occupational choice, organisational economics, personnel economics, politics - New Zealand, survivor principle, unions Tags: Aaron Director, creative production, David Friedman, inherent inequality of bargaining power between workers and employers, Richard Epstein, Ronald Coase, The fatal conceit, The pretence to knowledge, zero hours contracts

In another triumph of the Socialist Left of the National Party, the supposedly centre-right New Zealand government is considering outlawing zero hours contracts:
ONE News can exclusively reveal the Workplace Relations Minister is leaning towards outlawing the contracts and other employment provisions that he sees as unfair…
The Minister of Workplace Relations said the most punitive aspects of zero-hour contracts will be banned:
Mr Woodhouse has previously said a ban of zero-hour contracts would be an overreaction, but signalled the outlawing of aspects including:
•Restraint of trade clauses that stop someone working for a competing business if an employer does not provide the desired hours of work.
•The cancellation of shifts at short or no notice.
One reason for this is to neutralise a wedge issue with the Labour Party. The labour parties in both New Zealand and United Kingdom plan to outlaw zero hours contracts.
The NZ Labour Party’s Certainty at Work private member’s bill would require employment agreements to include an indication of the hours an employee will have to work to complete tasks expected of them.

Aaron Director pointed out that there are many real world business practices that behave differently from the caricatures in textbooks and arouse suspicious responses from economists (as well as from lay observers including lay observers with no ideological agenda).
Director said that visions of market power dance their heads and some of these suspect practices have been regulated for reasons he attributed in a large part to intellectual laziness. Ronald Coase made the same observation about knee-jerk responses to perplexing new business practices:
One important result of this preoccupation with the monopoly problem is that if an economist finds something—a business practice of one sort or other—that he does not understand, he looks for a monopoly explanation.
And as in this field we are very ignorant, the number of ununderstandable practices tends to be rather large, and the reliance on a monopoly explanation, frequent.
Much of the lasting influence of Aaron Director and of Ronald Coase came from their ability to show that simple judgements about business practices often cannot withstand rigorous scrutiny.
The organisation of and the contracting practices in the labour market is not a complicated despite the best efforts of the Left over Left and unions to pretend that it is so, as Richard Epstein explains:
Labour markets are not characterized by tricky externalities. They do not pollute streams or require the creation of public goods.
They are not characterized by genuine breakdowns in information, as workers are in a position to observe the conditions of their employment on a day-to-day basis.
Left to their own devices, without explicit support from union activities, they will be highly competitive, and thus work hard to allocate scarce human capital to its most productive use.
Workers have the option to quit for higher wages, and employers can always seek out low cost techniques to reduce their labour costs. Any short-term dislocation for firms or individuals is more than offset by the overall increase in the system productivity, spurred in part by clear signals that should increase investments in human capital.
In the UK, the Work Foundation found that 80% of those on zero hours contracts are not looking for another job; only 26% wanted longer hours. This implies that 74% were content with their current work times arrangements.
Labour's zero hours myth breitbart.com/london/2015/04… http://t.co/M8JsW6NWSF—
Alex Wickham (@WikiGuido) April 07, 2015
The inherent inequality of bargaining power between employers and workers and the reserve army of the unemployed must not be all that they are cracked up to be these days if low paid workers have to sign legally enforceable restraint of trade agreements, which is a common complaint about zero hours contracts. The worker does not have guaranteed hours but must promise not to work for someone else in the same line of business.
Obviously, the few members of the reserve army of the unemployed lucky enough to have a low pay, insecure job that offers no regular hours have so many other job options that their employers must get them to agree not to quit and job-hop at will. Jobs must be readily available to low paid workers for otherwise why do employers insist on this restraint of trade in employment agreements?
If there is an inherent inequality of bargaining power between the bosses and the workers, why do employers seek restraint of trade agreements against these downtrodden workers who are supposed to have few options but to accept the miserable zero hours job offer before them?
The question that must always be asked is why do people deemed competent to vote and drive cars sign zero hours contract? What is in it for them – for the worker who signs these contracts – especially for workers who already have a job and are switching to a zero hours contract? David Friedman asked this question about the economics of restraint of trade agreements for employees:
…the employer who insists on an employee signing a non- competition agreement will find that he must pay, in additional wages or other terms of employment, the cost that the agreement imposes upon the employee, as measured by the employee and revealed in his actions.
It follows that the employer will insist on such an agreement only if he believes that its value to him is greater than its cost to the employee… The contract is designed, after all, with the objective of getting the other party to sign it.
If I am designing the contract and offering it to many other parties, that may put me in a position to commit myself to insisting on terms that give me a large fraction of the benefit that the contract produces. But it is still in my interest to maximize the size of that net benefit-which I do by only insisting on terms that are worth at least as much to me as they cost the other party.
If zero hours contracts are as bad as the Left over Left claim, the job quit rates for these contracts should be high, and people moving from existing jobs should be under-represented in this section of the labour force. If a worker already has a job, they have few reasons to sign up to such a purportedly poor job offer. Show me the evidence.
Unless we have a good idea about why firms are moving to zero hours contracts, which we don’t, and why employees sign these contracts rather than work for other employers who offer more regular hours of work, meddling in these still novel to the officious observer arrangements is risky.
03 Apr 2015 Leave a comment
in labour economics, unions Tags: strikes, union power, union wage premium, Withering away of the proletariat
23 Mar 2015 Leave a comment
in applied welfare economics, international economics, poverty and inequality, unions Tags: free trade agreements, middle-class wage stagnation

Half of all U.S. workers represented by unions work for governments, and another 12% are in education or health care. Trade has very little direct impact on them. Another 20% of workers represented by unions are in construction, wholesaling, retailing or transportation doing jobs that are largely immune from import competition.
Less than 10% of all the workers that U.S. unions represent today are in manufacturing or agriculture, the industries most exposed to harm from globalization. Trade creates winners and losers; a small fraction of union workers are among the obvious losers.
The reasons advanced by the American union movement is trade deals enhance the bargaining power of employers over workers and is a major contributor to the wage stagnation over the last 20 years.
I hope the Unions got that analysis of trade and wages growth right because most union members benefit from the lower prices from import competition.
via Why Are Unions So Focused on Fighting Trade Deals? – Washington Wire – WSJ.
17 Mar 2015 Leave a comment
in applied welfare economics, economic growth, economic history, labour economics, poverty and inequality, unions
Today in the Dominion Post, Bill Rosenberg, a trade union self-described economist, argued that the workers are not getting their fair share of productivity gains in New Zealand over the last 35 years:
I calculate that wages in the 60 per cent of the economy studied by the commission would have been 12 per cent higher on average by March 2011, if they had kept up with productivity since 1978.
He then rounded up the usual Twitter Left suspects:
The commission’s study is important in that it finds that a large part of the fall in the labour share of income in the 1990s was due to high unemployment created by the radical restructuring of the economy that began in the 1980s and the Employment Contracts Act passed in 1991. Australia underwent similar restructuring during the period, but its labour income share fell only slightly. Its labour market is underpinned with an award system and other protections.
12%! 12% is at all that the class struggle is about over a 35 year period in terms of wage losses and labour surplus extract by the greedy bosses?
Figure 1: Real equivalised median household income (before housing costs) by ethnicity, 1988 to 2013 ($2013)

Source: Bryan Perry, Household incomes in New Zealand: Trends in indicators of inequality and hardship 1982 to 2013. Ministry of Social Development (July 2014).
As shown in figure 1, between 1994 and 2010, real equivalised median New Zealand household income rose by 47%; for Māori, this rise was 68%; for Pasifika, the rise in real equivalised median household income was 77%. Obviously these losses from the change in shares of GDP are dwarfed by the general increases in living standards over the last 20 years.
As is common with every member of the Left over Left that I run into these days, such as Bill Rosenberg, their analysis has no gender analysis.
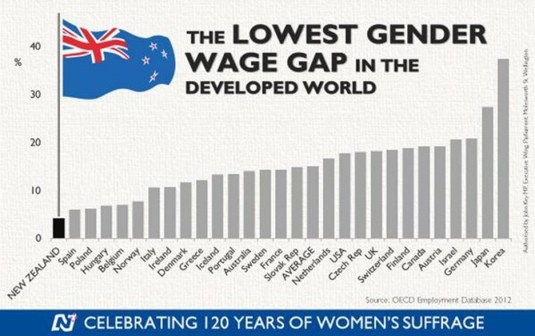
The Left over Left invariably fail to mention that New Zealand has the smallest gender wage gap of all the industrialised countries.
Over the last more than two decades in New Zealand, there has been sustained income growth spread across all of New Zealand society contrary to hopes and dreams of the Left over Left. Perry (2014) reviews the poverty and inequality data in New Zealand every year for the Ministry of Social Development. He concluded that:
Overall, there is no evidence of any sustained rise or fall in inequality in the last two decades. The level of household disposable income inequality in New Zealand is a little above the OECD median. The share of total income received by the top 1% of individuals is at the low end of the OECD rankings.
As for Rosenberg’s hypothesis that it’s all the fault of the Employment Contracts Act, that doesn’t stand up. Figure 2 shows that union membership has been in a long slow decline in New Zealand since the mid-1970s. This is been pretty much the pattern all round the world.
Figure 2: Union density, New Zealand, Australia, the UK and USA 1970-2013

Source: OECD Stats Extract
The much hated Employment Contracts Act 1991, much hated by the Left over Left, doesn’t really show up in the union density figures in figure 2. There is no sudden break in trend obvious in figure 2 in the early 1990s when the Employment Contract Act was passed.
Indeed, the passage of the Employment Contracts Act 1991 was followed by a 15 year economic boom in employment and economic growth, as shown in figure 3. This was after the lost decades of 1974 to 1992 when there was next to no growth in real GDP per New Zealander aged 15 to 64. The good old days when the Lost Decades for New Zealand.
Figure 3: Real GDP per New Zealander and Australian aged 15-64, converted to 2013 price level with updated 2005 EKS purchasing power parities, 1956-2013

Source: Computed from OECD Stat Extract and The Conference Board, Total Database, January 2014.
Things are so grim for the class struggle in New Zealand that the leader of the Labour Party has had to redefine the working class because it is withering away so rapidly because so many workers are joining the middle-class:
Andrew Little is looking to update Labour's definition of the 'working class': stuff.co.nz/national/polit… http://t.co/AQ9mJL7CQf—
NZ Stuff Politics (@NZStuffPolitics) November 30, 2014
04 Mar 2015 1 Comment
in economics of education, human capital, politics - New Zealand, politics - USA, unions Tags: charter schools, School choice
The New Zealand teachers union went into a very curious rant against chartered schools in a letter to the Dominion Post today. Instead of saying that they do not improve student outcomes, the usual propaganda, the author of the letter focused on system-wide outcomes after the introduction of charter schools.

It is usual for the teachers union to say that the schools themselves fail rather than argue that adding five or 10 schools to a system of thousands of public schools in New Zealand will through competition from these few schools to lift the entire system. For example, the teachers union sets a very high standard for the charter schools:
The United States has had charter schools for a more than a decade and there has been no measurable improvement in that country’s overall performance in literacy, maths and science. The United States lags far behind New Zealand on recent performance tests in all those areas.
It is unwise to say there is no evidence because that leaves you open to the cheap shot that will find one piece of evidence and then ask why you making things up. For example, the Maxim Institute found that:
The evidence from the small body of research that exists is mixed: some studies have found the presence of charter schools to have had a small negative impact on pupil achievement in regular state schools, while other studies have found charter schools to have had either a negligible or small positive impact…
There my work is done. All I had to show was that there was some evidence showing that charter schools improved the performance of neighbouring schools.

Why is the teachers union pretending that this evidence is not there when it can be found and so easily on the Internet?

Is the reason that the evidence that charter schools improve the outcomes of students that go to them is so strong that they have to move to new reasons for opposing them? The evidence is some chartered schools do very well and in particular for minority students. Their greatest strength is they are closed if they fail. No similar standard applies to failing public schools.

At a minimum, the teachers unions have conceded that the charter schools seem to work and that they do no harm to the rest of the system? If there was evidence of that, they would be quick to put it forward.
Celebrating humanity's flourishing through the spread of capitalism and the rule of law
Scholarly commentary on law, economics, and more
Beatrice Cherrier's blog
Celebrating humanity's flourishing through the spread of capitalism and the rule of law
Celebrating humanity's flourishing through the spread of capitalism and the rule of law
Celebrating humanity's flourishing through the spread of capitalism and the rule of law
Why Evolution is True is a blog written by Jerry Coyne, centered on evolution and biology but also dealing with diverse topics like politics, culture, and cats.
Celebrating humanity's flourishing through the spread of capitalism and the rule of law
Celebrating humanity's flourishing through the spread of capitalism and the rule of law
A rural perspective with a blue tint by Ele Ludemann
DPF's Kiwiblog - Fomenting Happy Mischief since 2003
Celebrating humanity's flourishing through the spread of capitalism and the rule of law
The world's most viewed site on global warming and climate change
Tim Harding's writings on rationality, informal logic and skepticism
A window into Doc Freiberger's library
Let's examine hard decisions!
Commentary on monetary policy in the spirit of R. G. Hawtrey
Thoughts on public policy and the media
Celebrating humanity's flourishing through the spread of capitalism and the rule of law
Politics and the economy
A blog (primarily) on Canadian and Commonwealth political history and institutions
Reading between the lines, and underneath the hype.
Economics, and such stuff as dreams are made on
"The British constitution has always been puzzling, and always will be." --Queen Elizabeth II
Celebrating humanity's flourishing through the spread of capitalism and the rule of law
Celebrating humanity's flourishing through the spread of capitalism and the rule of law
WORLD WAR II, MUSIC, HISTORY, HOLOCAUST
Undisciplined scholar, recovering academic
Celebrating humanity's flourishing through the spread of capitalism and the rule of law
Res ipsa loquitur - The thing itself speaks
Celebrating humanity's flourishing through the spread of capitalism and the rule of law
Researching the House of Commons, 1832-1868
Articles and research from the History of Parliament Trust
Reflections on books and art
Posts on the History of Law, Crime, and Justice
Celebrating humanity's flourishing through the spread of capitalism and the rule of law
Exploring the Monarchs of Europe
Cutting edge science you can dice with
Small Steps Toward A Much Better World
“We do not believe any group of men adequate enough or wise enough to operate without scrutiny or without criticism. We know that the only way to avoid error is to detect it, that the only way to detect it is to be free to inquire. We know that in secrecy error undetected will flourish and subvert”. - J Robert Oppenheimer.
The truth about the great wind power fraud - we're not here to debate the wind industry, we're here to destroy it.
Celebrating humanity's flourishing through the spread of capitalism and the rule of law
Celebrating humanity's flourishing through the spread of capitalism and the rule of law
Economics, public policy, monetary policy, financial regulation, with a New Zealand perspective
Celebrating humanity's flourishing through the spread of capitalism and the rule of law
Restraining Government in America and Around the World


Recent Comments