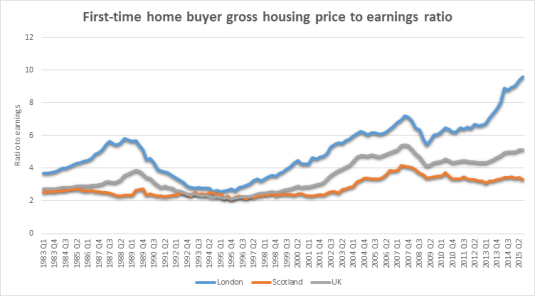
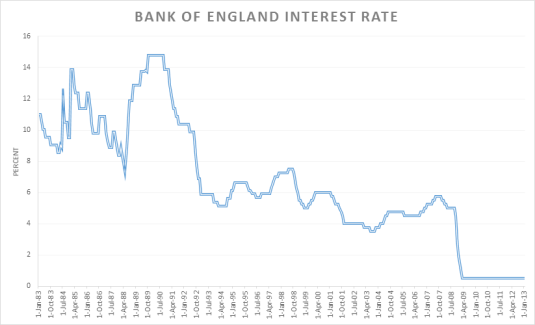
Many of the Twitter Left who voted in Jeremy Corbyn to lead the British Labour Party into what will be a self-inflicted electoral oblivion have no adult memory of paying high mortgage payments when there was high inflation.
Those who have escaped the overweening conceit of youth still have raw memories of high inflation and high mortgage payments and that was when housing was much, much cheaper.
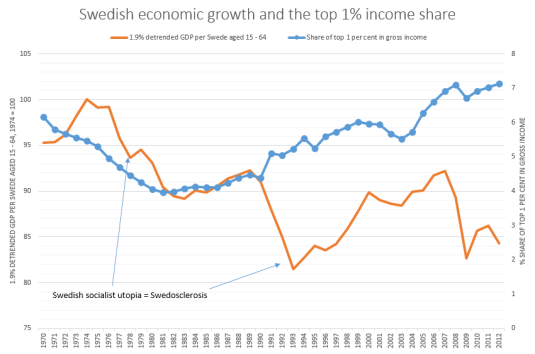
A fall in the share of the top 1% of total Swedish total incomes was in tune with the emergence of a new word in the English language which was Swedosclerosis. That was the long stagnation in the Swedish economy in the 1970s and the 1980s with Swedish economic growth well below that in the trend rate of growth in the USA. Only after an increase in the top 1% share in Sweden did economic growth start recovering to trend.
In the chart above, a flat-line in real GDP per working age Swede is growth at the trend rate of the US economy for the 20th century which was 1.9% per year. A falling line is Swedish growth below trend, a rising line is growth above that trend rate of 1.9% in Sweden. A trend rate of 1.9% is the trend rate of growth currently used by Edward Prescott for the USA in the 20th century.
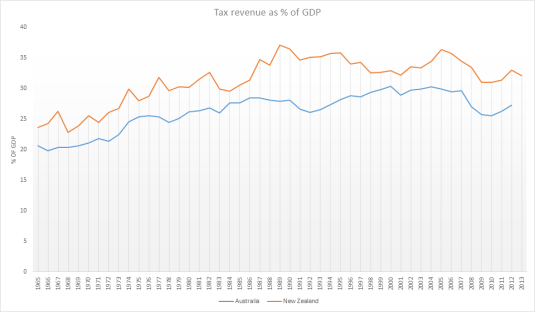
Revenue is a percentage of GDP has always been higher in New Zealand as compared to Australia for as far back as data is available. Tax revenue grew by a third as a percentage of GDP between 1965 and 1989 in New Zealand with a sharp spike from 1984 onwards. The growth in tax revenues as percentage of Australian GDP was smoother rather than spikes such as in the mid-1980s in New Zealand.
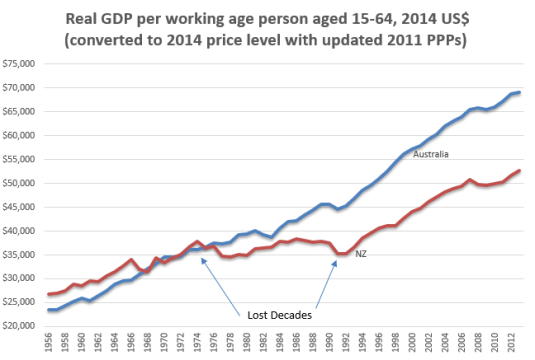
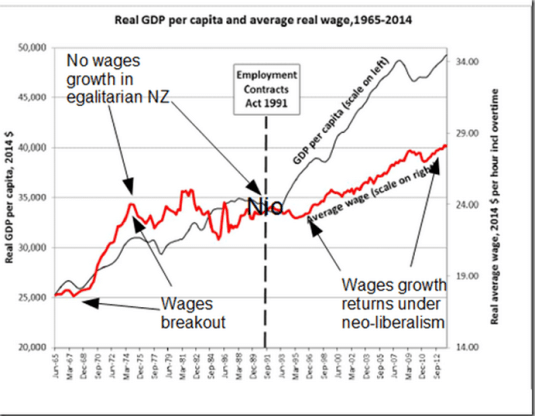
Interestingly, this faster growth in the New Zealand tax revenues as a percentage of GDP coincided with the two lost decades of New Zealand growth between 1974 and 1992. Furthermore, the chart below shows that an emerging recovery in labour productivity in the early 1980s stalled when tax revenues started growing again as a percentage of New Zealand GDP.
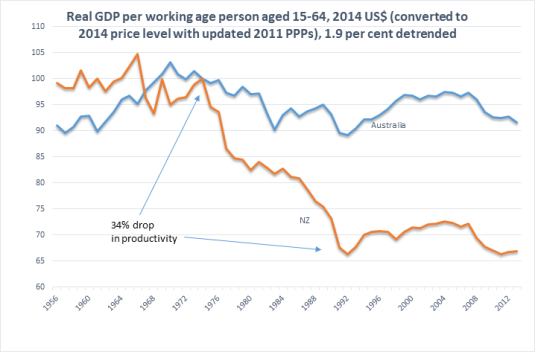
Between 1974 and 1992, New Zealand lost 34% and productivity against trend of 1.9%. In the chart below, a flat line is growth at a rate equal to the trend rate of growth for the USA in the 20th century which is 1.9%. A falling line indicates growth at less than 1.9% for the year. A rising line means growth in excess of 1.9% for the year. The chart below confirms what the chart above says. Productivity stopped falling in the early 1980s then started falling rapidly at the same time that tax revenues spiked as percentage of GDP in the early 1980s.
in the above chart, Australia had pretty steady growth since about 1970. There is a productivity slowdown in the 1970s and above-average growth as the economy recovered from the Keating recession in the early 1990s. The so-called mining boom is hardly noticeable in Australia’s trend growth rate.
The unemployment rate was zero in New Zealand in 1956, 1957 and 1961. Apparently no one was jobless even for a day in New Zealand when changing jobs or entering or re-entering the workforce from outside employment, from school or other educational callings or as a migrant, if the OECD data is to be believed.
Unemployment was 1% for the rest of the 1960s in New Zealand before skyrocketing to 2.5% in 1975. By 1983, under the best of the good old days before the scourge of neoliberalism, unemployment rate had reached 5.5% after a steady increase from more than a decade.
The less than 1% unemployment was mostly under National Party rule but this era is looked upon with great fondness by the left-wing in New Zealand. Same in Australia where the good old days are known as the Menzies era: 23 years of Conservative party rule but beloved now by the left-wing as the ideal mixed economy.
Australian unemployment rates in the late 1960s was also pretty low given the requirements of labour market churn and entry on re-entry into the labour force.
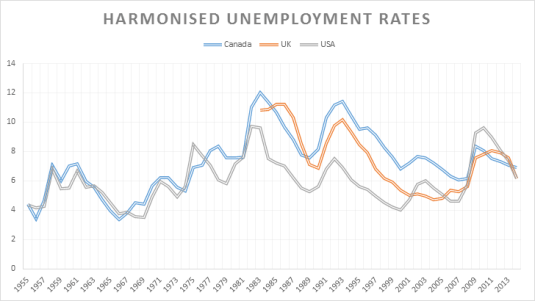
Canada has had much worse unemployment rates than the USA since the late 1970s. British unemployment rates have been doing okay since the late 1990s until the global financial crisis.
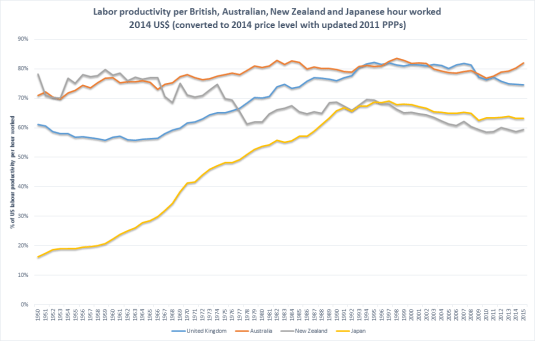
Australia stopped its very slow catch up with the USA in labour productivity at the end of the 1970s. The dramatic Japanese catch up stopped at the beginning of the lost decades in 1993. New Zealand had a dramatic decline in the early 1970s followed by a slow decline since 1990 relative to US hourly productivity. The British stopped catching up with the USA in 1990 after a catch up between 1964 and 1990 in hourly real labour productivity.
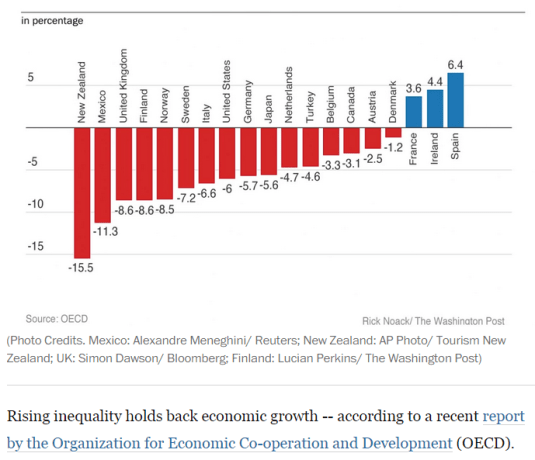
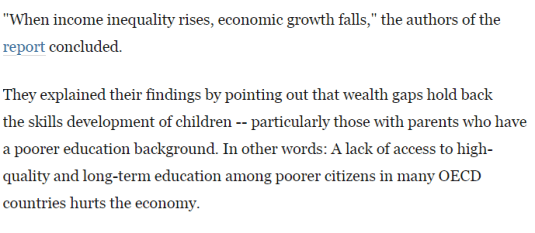
According to the OECD, it is all about the ability to lower middle class and working class families to finance the human capital investments of their children. The OECD theory of inequality and lower growth is there is a financing constraint because of inequality that reduces economic growth because of less human capital accumulation by lower income families.
There are a few common patterns in economic growth. All high-income countries have near-universal K-12 public education to build up human capital, along with encouragement of higher education. All high-income countries have economies where most jobs are interrelated with private and public capital investment, thus leading to higher productivity and wages. All high-income economies are relatively open to foreign trade.
In addition, high-growth economies are societies that are willing to allow and even encourage a reasonable amount of disruption to existing patterns of jobs, consumption, and ownership. After all, economic growth means change.
One of the findings of the Coleman report in the 1960s, which is been pretty much backed up since then such as by top labour economists such as James Heckman, is family background is the key to skills development in children, not the quality of their schools or their access to finance for higher education.
Schools work with what families present to them in terms of innate ability, and personality traits such as to pay attention and work. There is not much difference between an average bad public school and an average good public school when it comes to getting on in life. Going to really bad public school is different from just going to an average bad public school in terms of the chaos imposes on a child’s education and upbringing. What matters is the home environment rather than the ability to access good schools and families of ordinary means to finance higher education for their teenagers.
Most of the skill gaps that are present at the age of 18 – skill gaps which substantially explain gaps in adult earnings and employment in all groups – are also present at the age of five (Cunha and Heckman 2007). There is much evidence to show that disadvantaged children have lower levels of soft skills (non-cognitive skills): motivation, persistence, self-discipline, the ability to work with others, the ability to defer gratification and plan ahead, etc. (Heckman 2008). Most of the skills that are acquired at school build on these soft skills that are moulded and reinforced within the family.
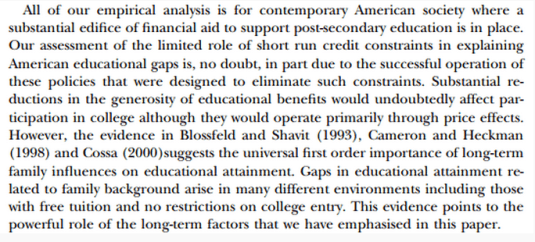
In 2002, with Pedro Carneiro, James Heckman showed that lack of access to credit is not a major constraint on the ability of young Americans to attend college. Short-term factors such as the ability to borrow to fund higher education has been found to be seriously wanting as an explanation for who and who does not go on to higher education.
Only a small percentage of young people are in any way constrained from going on to higher education because of the lack of money. This is not surprising in any society with student loans freely available at low or zero rates without any need to post collateral. Heavily subsidised tuition fees and cheap student loans have been around for several generations.
The biggest problem with the OECD hypothesis linking a lack of skill development within lower income and working class families is it is such an easy problem to solve for the ambitious politician of either the left or the right by throwing money at the problem. Schooling until the age of 16 has been free for a century and universities have been virtually free for at least two generations. Lack of access to a good education does not cut it as the explanation for large disparities in growth rates.
The OECD and more recently the IMF have placed a lot of weight in access to human capital as a driver of inequality because human capital accumulation is hypothesised to be a major driver of economic growth.
The evidence that human capital is a key contributor to higher economic growth is weakening rather than strengthening. If human capital accumulation is not a major driver of productivity growth and productivity disparities, the inequality and growth hypothesis of the OECD and the IMF based on access to finance for human capital accumulation does not get out of the gate. Moreover, as Aghion said:
Economists and others have proposed many channels through which education may affect growth–not merely the private returns to individuals’ greater human capital but also a variety of externalities.
For highly developed countries, the most frequently discussed externality is education investments’ fostering technological innovation, thereby making capital and labour more productive, generating income growth. Despite the enormous interest in the relationship between education and growth, the evidence is fragile at best.
The trend rate of productivity growth did not accelerate over the 20th century despite a massive rise in investments in human capital and R&D because of the rising cost of discovering and adapting new technological knowledge. The number of both R&D workers and highly educated workers increased many-fold over the 20th century in New Zealand and other OECD member countries including the global industrial leaders such as the USA, Japan and major EU member states.
Cross-country differences in total factor productivity are due to differences in the technologies that are actually used by a country and the degree in the efficiency with which these technologies are used. Differences in total factor productivity, rather than differences in the amount of human capital or physical capital per worker explain the majority of cross-country differences in per capita real incomes (Lucas 1990; Caselli 2005; Prescott 1998; Hall and Jones 1999; Jones and Romer 2010).
Differences in the skills of the individual worker or in the total stock of human capital of all workers in a country cannot explain cross national differences in value added per worker at the industry level.
The USA competes with Japan for productivity leadership in many manufacturing industries.
The Japanese services sector productivity can be as little as a one-third of that of the USA.
Japanese labour productivity is almost twice Germany’s in producing automobiles and is better that Germany by a large margin for many other manufactured goods.
The USA is uniformly more productive in services sector labour productivity. For example, British, French and German telecom workers were 38 to 56 per cent as productive as their American counter-parts.
The USA, Japan, France, the UK and Germany all have relatively well-educated, experienced and tested labour forces. For example, the 1993 McKinsey’s study inquired into the education and skills levels of Japanese and German steel workers. Comparably skilled German steel workers were half as productive as their Japanese counterparts (Prescott and Parente 2000, 2005).
The ability to finance human capital accumulation and go to good schools is a weak theory of inequality. Human capital accumulation itself is a weak theory of growth unless linked to sophisticated theories of the institutions fostering innovation and technology absorption which it now is.
Why Evolution is True is a blog written by Jerry Coyne, centered on evolution and biology but also dealing with diverse topics like politics, culture, and cats.
In Hume’s spirit, I will attempt to serve as an ambassador from my world of economics, and help in “finding topics of conversation fit for the entertainment of rational creatures.”
“We do not believe any group of men adequate enough or wise enough to operate without scrutiny or without criticism. We know that the only way to avoid error is to detect it, that the only way to detect it is to be free to inquire. We know that in secrecy error undetected will flourish and subvert”. - J Robert Oppenheimer.


Recent Comments