The looming fiscal crisis in the USA
22 Apr 2015 Leave a comment
in fiscal policy, global financial crisis (GFC), great recession, macroeconomics, politics - USA Tags: ageing society
US, UK and Japanese inflation adjusted for new good and quality bias, 1994-2014
22 Apr 2015 Leave a comment
in econometerics, inflation targeting, macroeconomics, politics - USA Tags: CPI bias
All agree that the consumer price index (CPI) is biased and overstates inflation. In 1996, economists hired by the Senate Finance Committee estimated that the U.S. CPI overstates annual inflation by 1.1% (Boskin et al. 1996). That estimated CPI bias has not gotten smaller with time. It is now up to 1.5%, even 2%.
The main biases in the consumer price index everywhere come from how to handle changes in the quality of goods and services and how to deal with completely new goods and services.
I thought I might see what happened if I took account of this one and a half percentage point annual bias because of new goods, quality variation and other known biases in the CPI estimates for the USA, UK and Japan in the relevant OECD StatExtract database for annual CPI inflation.

Source: OECD StatExtract.
Taking into account new good and quality bias, Japan is been in serious deflation for quite some time now – at least 20 years. Japanese inflation went positive in the last year or two because I believe they increased their consumption tax.
The USA has a low inflation for about 20 years. The UK had no inflation for about seven years from 1997 then it started to rise again until 2012.
People get hot and bothered with deflation. Breathless journalism aside, fears of inflation are just a legacy of the great depression in the 1930s.
The only depression where deflation was accompanied by mass unemployment was the Great Depression. Mild deflation with good growth is a common phenomenon as Atkinson and Kehoe found:
Are deflation and depression empirically linked? No, concludes a broad historical study of inflation and real output growth rates. Deflation and depression do seem to have been linked during the 1930s. But in the rest of the data for 17 countries and more than 100 years, there is virtually no evidence of such a link.
The social cost of high company tax rates is just too high
22 Apr 2015 Leave a comment
in economic growth, fiscal policy, human capital, income redistribution, labour economics, macroeconomics, Public Choice Tags: company tax rate, entrepreneurial alertness, tax reform
The rest of Europe can’t expect Germany to keep bailing them out
22 Apr 2015 Leave a comment
in Euro crisis, macroeconomics, population economics Tags: ageing society, European Union, Eurosclerosis, France, Germany, labour demographics
BofA-ML: Working age population projections, a serious problem for Germany http://t.co/eStgQePoVP—
Fabrizio Goria (@FGoria) March 30, 2015
Has New Zealand been in deflation since 2012?
21 Apr 2015 Leave a comment
in global financial crisis (GFC), great depression, inflation targeting, macroeconomics, monetary economics Tags: CPI bias, deflation, inflation, monetary policy
All agree that the consumer price index (CPI) is biased and overstates inflation. In 1996, economists hired by the Senate Finance Committee estimated that the U.S. CPI overstates annual inflation by 1.1% (Boskin et al. 1996). That estimated CPI bias has not gotten smaller with time. It is now up to 1.5%, even 2%.
One of the rationales for the inflation target of the Reserve Bank of New Zealand of 0-2% was the 2% was to account for the consumer price index was biased upwards. Targeting 0% would lead to mild deflation when inflation was properly measured.
The main biases in the consumer price index everywhere come from how to handle changes in the quality of goods and services and how to deal with completely new goods and services.
I thought I might see what happened if I took this one and a half percentage point annual bias in the CPI estimated for the USA and adjusted the New Zealand CPI inflation rates available at the Reserve Bank of New Zealand’s website over the last 20 years or so with this number.

If these consumer price index bias adjustments are correct, and they are roughly correct, inflation came to a dead stop in New Zealand after the global financial crisis in 2008, spiked again, and then moved into deflation in 2012. If anything, there’s been a mixture of price stability and the deflation since 2012.
People get quite hot and bothered with deflation. The New Zealand economy has been in a deflationary phase since the beginning of 2012 but it is recently grown so quickly that it is referred to in the media as the rock-star economy.
Breathless journalism aside , fears of inflation are just a legacy of the great depression in the 1930s. The only depression where deflation was accompanied by mass unemployment was the Great Depression. Mild deflation with good growth is a common phenomena as Atkinson and Kehoe found:
Are deflation and depression empirically linked? No, concludes a broad historical study of inflation and real output growth rates.
Deflation and depression do seem to have been linked during the 1930s. But in the rest of the data for 17 countries and more than 100 years, there is virtually no evidence of such a link.
Levels of output are nowhere near returning to pre-crisis trends
21 Apr 2015 Leave a comment
in business cycles, economic growth, Euro crisis, global financial crisis (GFC), great recession, macroeconomics Tags: Eurosclerosis

The role of unions in prolonging the Great Depression
20 Apr 2015 1 Comment
in business cycles, fiscal policy, great depression, labour economics, labour supply, macroeconomics, politics - USA, unemployment, unions Tags: capital taxation, FDR, Herbert Hoover, Leftover Left, Leo Ohanian, New Deal, union power, union wage premium, unionisation
Our friends on the left at the Economic Policy Institute were good enough to remind us of the link between rapid unionisation of the US labour market in the early and mid-1930s and the petering out of the recovery from the great depression. That recession within a depression is the Roosevelt recession.
New blog on Mind The Gap: on labour #unions and income #inequality
oxfamblogs.org/mindthegap/201… http://t.co/FyrOboCaRk—
Ricardo FuentesNieva (@rivefuentes) April 17, 2015
Harold Cole and Lee Ohanian analysed in depth this double-dip depression in the USA in a paper in the Journal of Political Economy titled “New Deal Policies and the Persistence of the Great Depression: A General Equilibrium Analysis” about 10 years ago:
The recovery from the Great Depression was weak… Real gross domestic product per adult, which was 39 percent below trend at the trough of the Depression in 1933, remained 27 percent below trend in 1939. Similarly, private hours worked were 27 percent below trend in 1933 and remained 21 percent below trend in 1939.
The weak recovery is puzzling because the large negative shocks that some economists believe caused the 1929–33 downturn—including monetary shocks, productivity shocks, and banking shocks—become positive after 1933. These positive shocks should have fostered a rapid recovery, with output and employment returning to trend by the late 1930s.
The focus of the paper by Cole and Ohanian in explaining the weak recovery – the double-dip depression in the 1930s – are the New Deal cartelisation policies designed to limit competition and increase labour bargaining power through extensive unionisation of workforce.

The recovery from the depths of the Great Depression was weak but real wages in several sectors rose significantly above trend despite mass unemployment.

The view that limiting competition in product markets and the labour market was essential for economic prosperity was influential in the 1920s and 1930s. Both FDR and Hoover believed high wages were the key to prosperity.
FDR’s recipe for economic recovery from the great depression when he came to office in 1933 was raising prices and wages and the promotion of unions:
Union membership rose from about 13 percent of employment in 1935 to about 29 percent of employment in 1939, and strike activity doubled from 14 million strike days in 1936 to about 28 million in 1937.
The result of this suppression of market competition and the encouragement of unions was real wages increase despite the weak recovery:
The coincidence of high wages, low consumption, and low hours worked indicates that some factor prevented labour market clearing during the New Deal.
The combination of government interference with competition and strong unions stifled the recovery from the great depression rather than speed it up as was the plan of FDR:
New Deal labour and industrial policies did not lift the economy out of the Depression as President Roosevelt had hoped.
Instead, the joint policies of increasing labour’s bargaining power and linking collusion with paying high wages prevented a normal recovery by creating rents and an inefficient insider-outsider friction that raised wages significantly and restricted employment.
Not only did the adoption of these industrial and trade policies coincide with the persistence of depression through the late 1930s, but the subsequent abandonment of these policies coincided with the strong economic recovery of the 1940s.
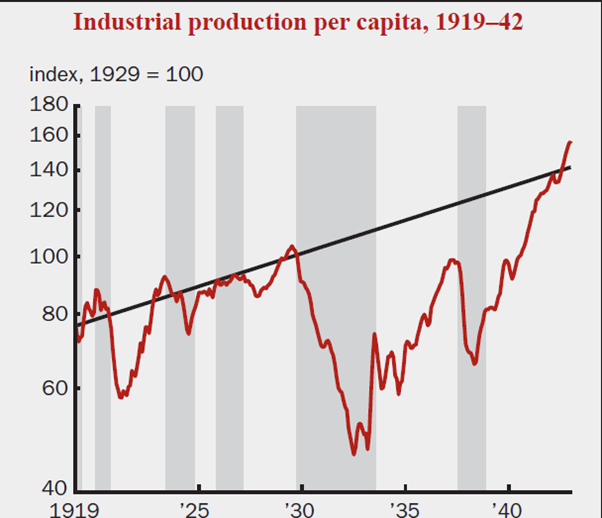
U.S. unemployment fell from 22.9% in 1932 to 9.1% in 1937, a reduction of 13.8%, but was back up to 13% by 1938. The Social Security payroll tax debuted in 1937 on top of tax increases in the Revenue Act of 1935. In 1937, the economy fell into recession again. Cooley and Ohanian argue that:
The economy did not tank in 1937 because government spending declined. Increases in tax rates, particularly capital income tax rates, and the expansion of unions, were most likely responsible.
The Great Depression in the USA was unique in the fact that it was so long and the recovery, so weak:
Total hours worked per adult in 1939 remained about 21% below their 1929 level, compared to a decline of 27% in 1933… Per capita consumption did not recover at all, remaining 25% below its trend level throughout the New Deal, and per-capita non-residential investment averaged about 60% below trend.
After 1933, productivity growth was rapid, the banking system was stabilized, deflation was eliminated and there was plenty of demand stimulus as the Fed more than doubled the monetary base between 1933 and 1939. As Lee Ohanian noted:
Depressions are periods of low employment and low living standards. The normal forces of supply and demand should have reduced wages, which would have lowered business costs and increased employment and output. What prevented the normal forces of supply and demand from working?
Central to the faltering of this recovery by 1937 was the regime change when the Supreme Court finally upheld revised laws promoting unionisation:
The downturn of 1937-38 was preceded by large wage hikes that pushed wages well above their NIRA levels, following the Supreme Court’s 1937 decision that upheld the constitutionality of the National Labor Relations Act. These wage hikes led to further job loss, particularly in manufacturing.
The "recession in a depression" thus was not the result of a reversal of New Deal policies, as argued by some, but rather a deepening of New Deal polices that raised wages even further above their competitive levels, and which further prevented the normal forces of supply and demand from restoring full employment.
Lee Ohanian argues that the defining characteristic of the Great Depression was this failure of real wages to fall in the face of mass unemployment:
The defining characteristic of the Great Depression is a substantial and chronic excess supply of labour, with employment well below normal, and real wages in key industrial sectors well above normal.
Policies of Hoover and of FDR of propping up wages and encouraging unions and work sharing were the most important factors in precipitating and prolonging the Great Depression. The Great Depression was the first time U.S. wages did not fall in that you were administered a period of significant deflation.
The manufacturing sector, where unions and the threat of unionisation was much stronger which was much harder hit initially than the agricultural sector both in terms of loss of jobs and wages not falling. The Great Depression did not start as an ordinary garden variety recession, as argued by Milton Friedman. It was immediately severe and sector specific with industrial production declining by about 35% between late 1929 and the end of 1930.
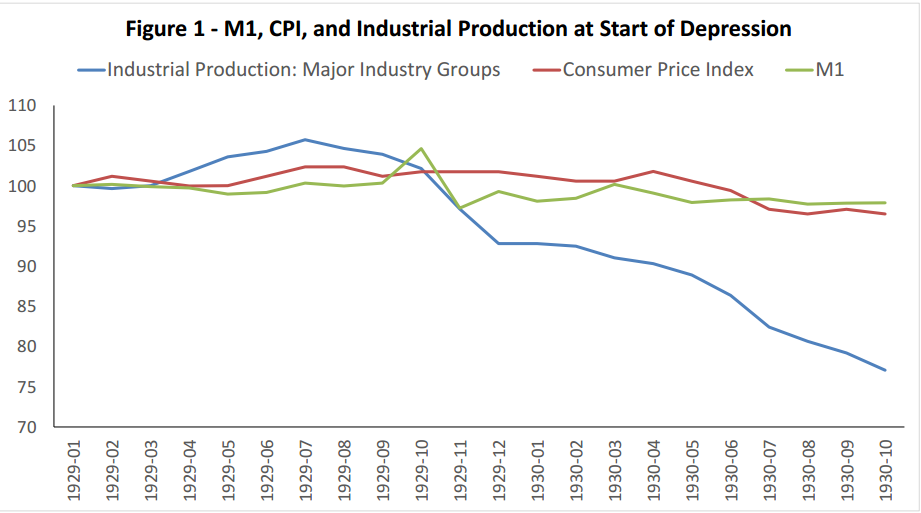
This decline in industrial production occurs before any banking crises. Despite this sector specific nature of the onset that Great Depression, monetary policy might have some role in explaining the start of the Great Depression but not in its prolongation:
any monetary explanation of the Depression requires a theory of very large and very protracted monetary non-neutrality. Such a theory has been elusive because the Depression is so much larger than any other downturn, and because explaining the persistence of such a large non-neutrality requires in turn a theory for why the normal economic forces that ultimately undo monetary non-neutrality were grossly absent in this episode.

Source: A different view of the Great Depression’s cause | VOX, CEPR’s Policy Portal.
50% more R&D since the 60s, but still no growth dividend?
18 Apr 2015 1 Comment
in applied price theory, economic growth, economics of education, entrepreneurship, history of economic thought, human capital, industrial organisation, macroeconomics, occupational choice, survivor principle Tags: Ben Jones, Chad Jones, creative destruction, endogenous growth theory, innovation, R&D
Spending on intellectual property products has risen in the USA from 1% in 1950 to 5% now. Public R&D spending in the USA has been pretty static for 60 years. Intellectual property products in the chart below includes traditional research and development, spending on computer software, and spending on entertainment such as movies, TV shows, books, and music. Spending on software and entertainment was only recently measured in the US national accounts. This inclusion of intangible capital investments will radically change the story of economic growth and the business cycle in the 20th century.
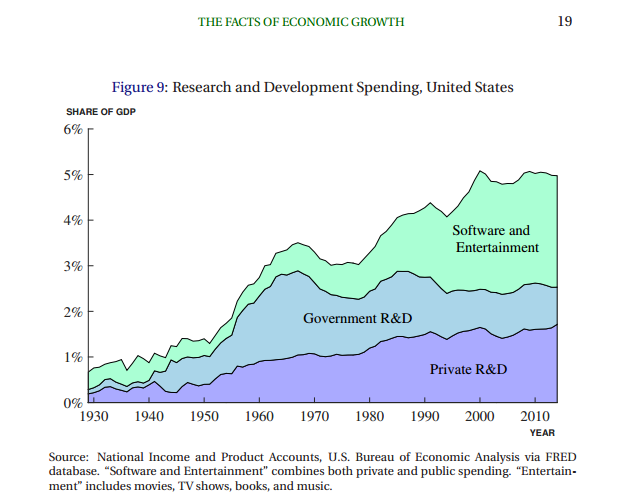
Source: Chad Jones (2015).
The growth rate in the USA hasn’t changed much despite this massive increase in intellectual property property product production. Is innovation getting harder? R&D is supposed to boost the growth rate, if you are to believe politicians bearing subsidies for it wherever they find it.
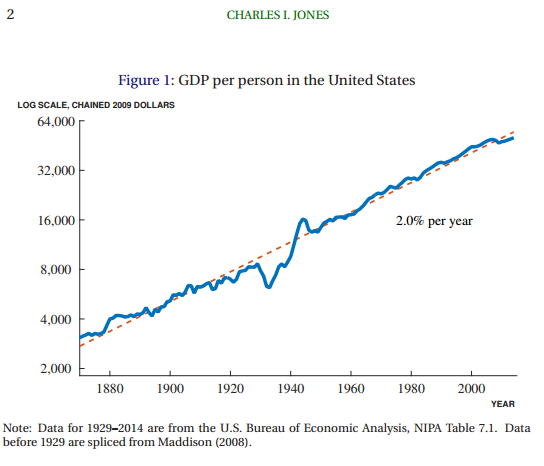
Source: Chad Jones (2015).
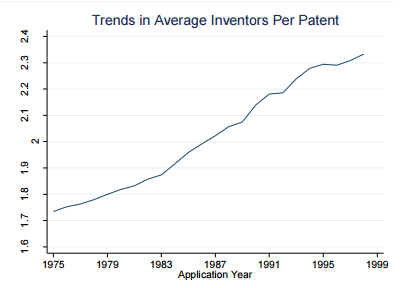
Ben Jones in The Burden of Knowledge and the Death of the Renaissance Man: Is Innovation Getting Harder? found that as knowledge accumulates as technology advances, successive generations of innovators may face an increasing educational burden. Innovators can compensate through lengthening their time in education and narrowing expertise, but these responses come at the cost of reducing individual innovative capacities. This has implications for the organization of innovative activity – a greater reliance on teamwork – and has negative implications for economic growth.
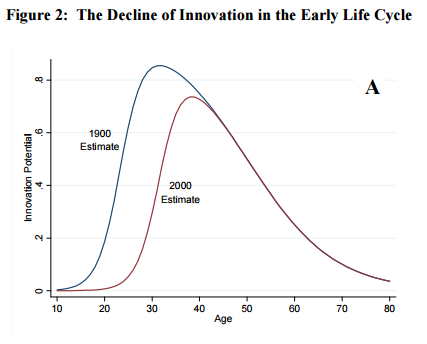
This longer period of education and initial study is not compensated by inventors innovating for longer spans of their lifestyle. This rising burden of knowledge is cutting into their best years of their lives. Jones found a broad and dramatic declines in early life-cycle productivity among great minds and ordinary inventors, and a close relationship of these trends with increased training duration.
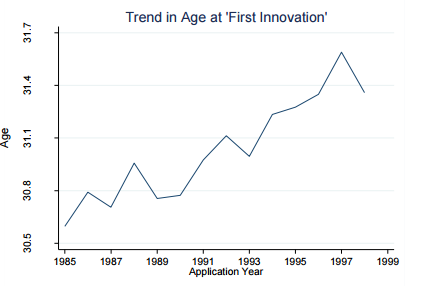
Jones found that the age at first invention, specialisation, and teamwork increased over time in a large micro-data set of inventors. Upward trends in academic collaboration and lengthening doctorates can also be explained in his framework of innovation getting harder because of a rising burden of knowledge. Co-authorship in academic literature has increased, including physics, biology, chemistry, mathematics, psychology, and economics. This measure of teamwork has increased 17% per decade.
Using data on Nobel Prize winners, Jones found that the mean age at which the innovations are produced to win the Prize has increased by 6 years over the 20th Century.
- Before 1901, two-thirds of the Nobel laureates did their prize-winning work before the age of 40 and 20 per cent did it before age of 30.
- By 2000, however, great achievements seldom occurred before the age of 40.
It’s now taking longer for scientists to get their basic training and start their careers. There is simply more to learn because knowledge in all fields has grown by quantum leaps in the past century. Nobels are being handed out for different types of work than a century ago.
- There has been a trend away from awarding prizes for abstract, theoretical ideas.
- Now more honours are being bestowed on people who have made discoveries through painstaking lab work and experimentation – which takes a lot of time to do.
Jones’ theory provides an explanation for why productivity growth rates did not accelerate through the 20th century despite an enormous expansion in collective research effort and levels of education and many more graduates. Innovation is getting harder?
Why are Europe’s strong employment protection laws still popular with the Left?
17 Apr 2015 Leave a comment
in economics of regulation, Euro crisis, global financial crisis (GFC), great recession, job search and matching, labour economics, macroeconomics, unemployment Tags: employment law reform, employment protections laws, Eurosclerosis, Germany
#Unemployment rate in #OECD area fell to 7.0% in Feb, w/42.9mn people jobless bit.ly/1FNK0W5 #stats http://t.co/RPUqvlR3mQ—
(@OECD) April 13, 2015
The countries with the more liberal labour markets are recovering fastest from the Great Recession and the Global Financial Crisis.
EZ unemployment rates http://t.co/vnfti1hhqe—
(@cigolo) March 31, 2015
This includes Germany where there were major labour market reforms a couple of years before the onset of the Global Financial Crisis. For that reason, German unemployment rates didn’t rise much in 2008 and after and are now falling quite rapidly because of their labour market liberalisations. Germany has the lowest unemployment rate in Europe.
UK youth unemployment high but lower than 20 other EU member states. #Budget2015 http://t.co/eBa8W9rr6C—
RBS Economics (@RBS_Economics) March 18, 2015

Average tax rates on consumption, investment, labour and capital in USA, UK and Canada, 1950-2013
17 Apr 2015 5 Comments
in business cycles, economic growth, economic history, fiscal policy, global financial crisis (GFC), great recession, macroeconomics, politics - USA, public economics Tags: British economy, Canada, sick man of Europe, tax incidence, tax reform
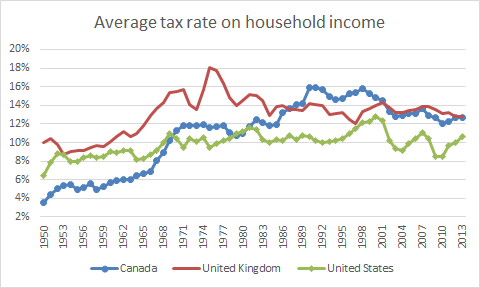
Income taxes in the USA and UK didn’t change all that much after the mid-70s. Prior to that, income tax rose quite steadily in the UK in the 1950s and 1960s and not surprisingly, Britain was the sick man of Europe in the 1970s. Income taxes rose quite steadily in Canada for most of the post-war period up until 1990 and then levelled out for most of that decade before a small tapered downwards.
Source: Cara McDaniel.
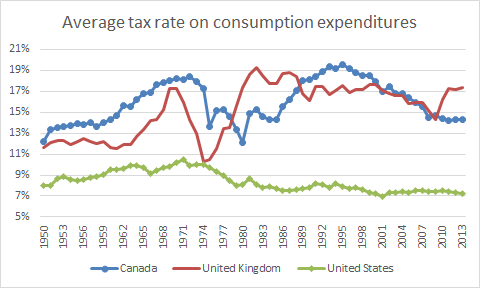
Taxes on consumption expenditure were very different stories across the Atlantic. There has been a tapering down in the average tax rate on American consumption expenditure since 1970 after modest increases before that. Canadian taxes on consumption expenditure rose steadily until the 1970s, then drop steadily in the 1970s and than rose in the 1980s and dropped again after 1992. British taxes on consumption expenditure rose sharply in the late 1960s, dropped sharply and then rose again in the 1970s and was pretty steady after that.
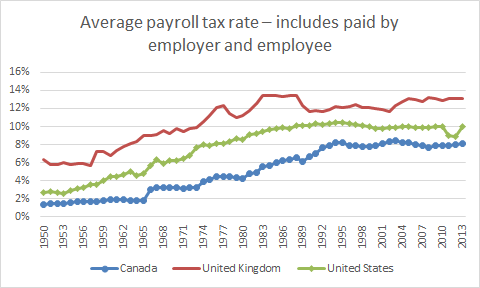
The sleeper tax in all three countries was payroll taxes to fund social security and the welfare state. These rose steadily in the USA, UK and Canada up until the 1990s.
Source: Cara McDaniel.
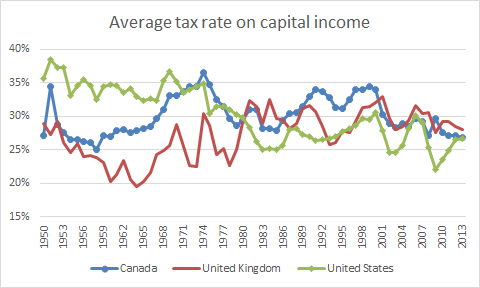
Despite all that nonsense about neoliberalism from the Left over Left, the average rate of tax on capital income did not appear to change much at all over the last 50 years. There was a modest taper in US capital income taxation from the mid-30s to the mid-20s over the entire post-war period. The average Canadian tax rate on income from capital rose steadily in the 60s, fell steadily in the 70s before rising again in the mid-1980s and fell again after 2000. The average British tax rate on capital income rose steadily in the 60s and 70s, coinciding with the emergence of Britain as a sick man of Europe, and then stabilised in the the 1980s onwards but with a dip in the late 80s before a rise in the early 1990s.. Despite the large cuts in the statutory corporate tax rate in the UK, there was only a mild taper in the average tax rate on capital income in the UK.
Source: Cara McDaniel.
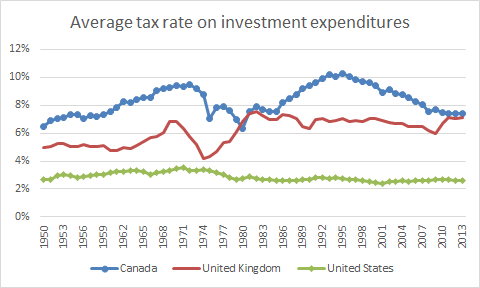
The average tax rate on investment expenditures is pretty stable in the USA for the entire post-war period. The only significant increase in the average tax rate on investment expenditures in the UK coincided with the emergence of the sick man in Europe after a drop in the early 70s. The average tax rate on investment expenditures do not change at all in the UK after the 1970s. The Canadian average tax rate on investment expenditures is higher than elsewhere. It rose steadily in the 50s and 60s, dropped in the 70s and rose again in the 80s before tapering from 1992 onwards.
Source: Cara McDaniel.
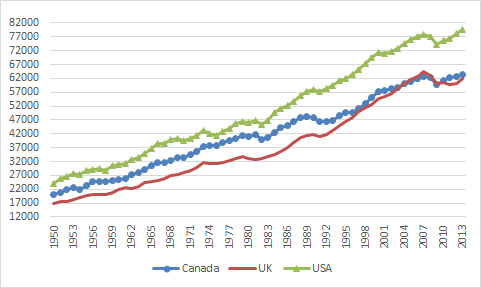
These higher on rising taxes and the UK and Canada did nothing for either country in catching up with the USA. The figure 1 below shows real GDP per working age per American, Canadian and British.
Figure 1: Real GDP per Canadian, British and American aged 15-64, converted to 2013 price level, updated 2005 EKS purchasing power parities, 1950-2013
Source: Computed from OECD StatExtract and The Conference Board, Total Database, January 2014, http://www.conference-board.org/economics
The USA is pulling away from Canada and the UK in GDP per working age person. The exception is British economy from about 1990 onwards which caught up with Canada.
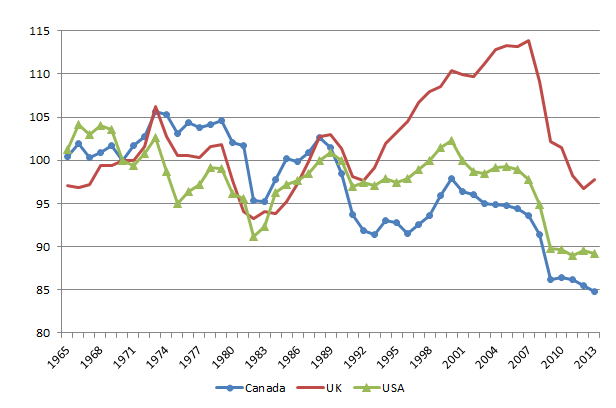
Figure 2, which is detrended GDP data, illustrates the British economic boom in the 1990s. Each country’s annual economic growth rate is detrended by 1.9%, the detrending value currently used by Ed Prescott. A flat line is growth at 1.9%, a rising line is above trend growth, a falling line is below trend growth.
Figure 2: Real GDP per Canadian, British and American aged 15-64, converted to 2013 price level, updated 2005 EKS purchasing power parities, detrended 1.9%, 1950-2013
Source: Computed from OECD Stat Extract and The Conference Board, Total Database, January 2014, http://www.conference-board.org/economics
Figure 2 shows that Canada has been in a long-term decline since the mid-1980s with much of this decline coinciding with periods of rising taxes on income from labour.
The British economy boomed in the 1990s, after the tax hikes of the 1970s and early 80s were reversed. This growth dividend was squandered by the Blair government in the 2000.
Figure 2 also shows that US growth was rather stable with some ups and downs up until 2007, expect during the productivity slowdown in the 1970s. The first major departure from trend growth of 1.9% was with the onset of the great recession.
Average tax rates on consumption, investment, labour and capital in Australia and New Zealand, 1959-2011–updated
16 Apr 2015 1 Comment
in economic growth, fiscal policy, macroeconomics, politics - Australia, politics - New Zealand, public economics Tags: GST, lost decades, taxation and the labour supply, taxation of capital
Cara McDaniel went to the mammoth task of constructing average tax rates for 15 OECD countries over the period 1950-2003 for consumption, investment, labour and capital:
Total tax revenue is divided into revenue generated from four different sources: consumption expenditures, investment expenditures, labour income and capital income.
To find the average tax rate, tax revenue from each source is then divided by the appropriate income or expenditure base.
She used that data to examine the role of taxes and productivity growth as forces influencing market hours. She used a calibrated growth model extended to include home production and subsistence consumption, both of which were key features influencing market hours. Her model was simulated for 15 OECD countries. She found the primary force driving changes in market hours is found to be changing labour income tax rates and productivity catch-up relative to the United States is found to be an important secondary force.
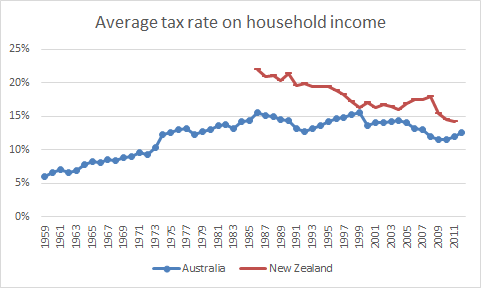
I thought I would summarise the tax rate data computed by Cara McDaniel for Australia and New Zealand.
Source: Cara McDaniel.
McDaniel’s data on average tax rates on household incomes in Australia and New Zealand suggests that the average tax rate New Zealand household incomes fell by a third since 1986. No estimates were calculated for earlier years for New Zealand.
As for Australia, taxes steadily increased between 1959 and 1987 stabilised until 2005 and then fell a bit.
Source: Cara McDaniel.
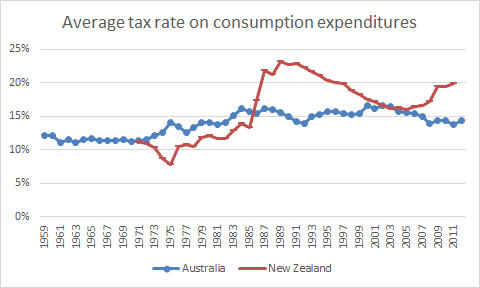
There is a big spike in the average tax rate on consumption expenditure in New Zealand in 1986 when a GST replaced the pre-existing sales taxes. The average tax rate on New Zealand consumption expenditures and tapered away until the end of2009 and started to increase again.
Not much happened in Australia regarding the average tax rate in consumption expenditures since about 1983 despite the introduction of a GST in 1998.
Source: Cara McDaniel.
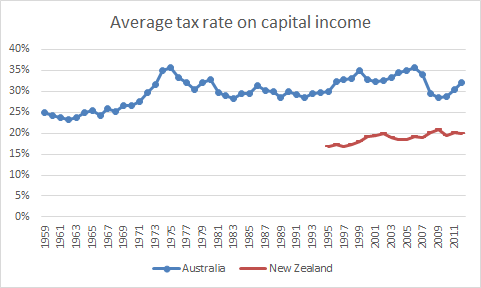
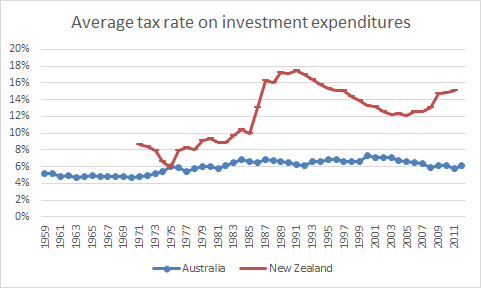
The average tax rate in capital income in Australia is much higher than in New Zealand. On the other hand, the average tax rate on investment expenditure is much higher New Zealand as compared to Australia.
Source : Cara McDaniel.
Taxes on investment expenditures increased quite significantly at the same time that a GST was introduced in New Zealand.
All in all, New Zealand cut taxes on personal income but that tax cut seemed to be pretty much offset by higher taxes on personal consumption through the introduction of a 10% and then 12.5% GST.
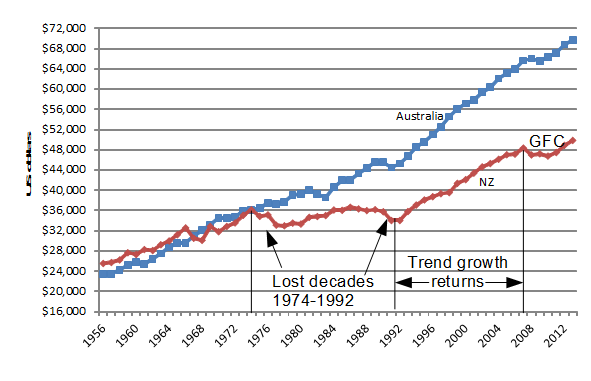
The most interesting finding in this database is the sharp increase in the average tax on investment expenditures in the mid-1980s. This prolonged New Zealand’s lost decades – the two decades of next to no GDP growth per working age New Zealander.
Real GDP per New Zealander and Australian aged 15-64, converted to 2013 price level with updated 2005 EKS purchasing power parities, 1956-2013
Source: Computed from OECD Stat Extract and The Conference Board, Total Database, January 2014.
New Zealand’s lost decades ended when the average tax rate on investment expenditures started to fall.
Relative productivity across the major economies
16 Apr 2015 Leave a comment
in economic growth, labour supply, macroeconomics Tags: Eurosclerosis, Japan, Lost Decade
Annual hours worked, USA, West Germany, Germany and France, 1950-2013
15 Apr 2015 Leave a comment
in economic growth, Euro crisis, fiscal policy, labour economics, labour supply, macroeconomics, politics - USA Tags: annual hours worked, Eurosclerosis, taxation and the labour supply, welfare state
The French and Germans work much less than the Americans
(via: bit.ly/1b2DfWo) http://t.co/S8XwIeLNBr—
Max Roser (@MaxCRoser) April 15, 2015
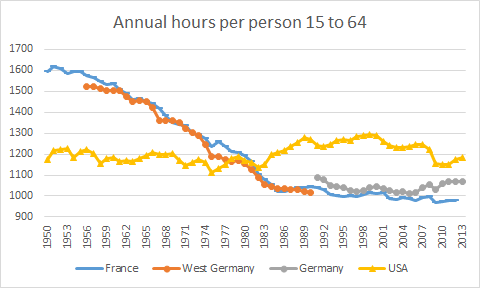
Max Roser tweeted this chart today showing that French and Germans work far fewer hours than Americans. His measure is annual hours worked divided by the number of persons engaged. Max Roser’s starter shows that French and German annual hours worked in a steady decline since 1950.
My measure below is annual hours worked per American, French, West Germany and German aged 15 to 64. My data shows a different picture. There are stable hours worked per working age American. European hours per worked per working age European fell rapidly up until 1986 or so and then stabilised. Each set of data, my data and Max Roser’s data, requires its own explanation. My explanation is the sharp rises in taxes Europe in the 1970s and 80s.
Source:OECD StatExtract and The Conference Board Total Economy Database, January 2014.
Each set of data, my data and Max Roser’s data, requires its own explanation. My explanation is the sharp rises in taxes net welfare state transfers in Europe in the 1970s and 80s.
Source: caramcdaniel.com
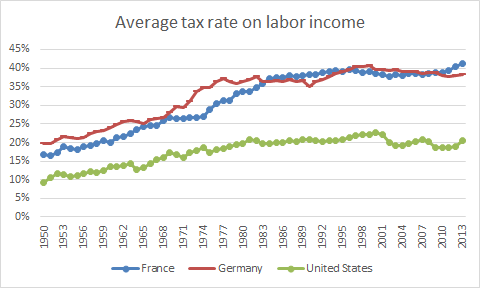
As an illustration, average tax rates on American labour incomes doubled between 1950 in 1980 and then was stable. Labour supply started recover after this point in time as well.
Average tax rates on French and German labour income more than doubled between 1950 to about 1990 and then stopped rising by much after that. At the same time, the fall in hours worked per working age German and French stopped. The average tax rate by that time in Europe was twice that of the USA.
Robert Lucas on the irrelevance of income redistribution to the Great Enrichment
15 Apr 2015 Leave a comment

Real GDP per Canadian and American aged 15-64, 2013 price level, updated 2005 EKS PPP, detrended, 1970-2013
15 Apr 2015 Leave a comment
in economic growth, economic history, macroeconomics, politics - USA Tags: Canada, living standards
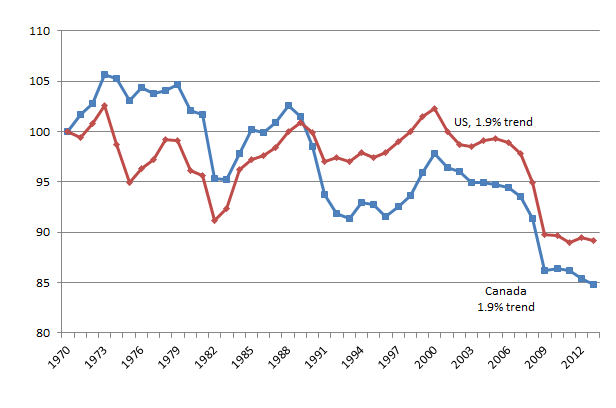
Figure 1: Real GDP per Canadian and American aged 15-64, converted to 2013 price level, updated 2005 EKS purchasing power parities, detrended 1.9%, 1970-2013, base 1970
Source: Computed from OECD Stat Extract and The Conference Board, Total Database, January 2014, http://www.conference-board.org/economics
A flat line means growth at the trend rate of 1.9%; a falling line means below trend rate of growth ; a rise in line means above trend rate of growth. Canada appears to have mostly been falling behind the USA.
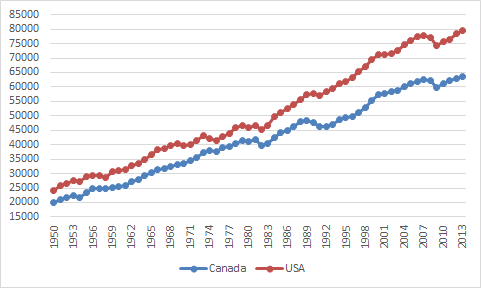
Figure 2: Real GDP per Canadian and American aged 15-64, converted to 2013 price level, updated 2005 EKS purchasing power parities, 1950-2013
Source: Computed from OECD Stat Extract and The Conference Board, Total Database, January 2014, http://www.conference-board.org/economics.


Recent Comments