
A history of commerce
06 May 2015 Leave a comment
in economic history, monetary economics Tags: mediums of exchange
The economic policy uncertainty index developed by Bloom, Davis & Baker
06 May 2015 Leave a comment
in business cycles, macroeconomics Tags: economic uncertainty, real business cycle
The eurozone stock rally has legs (in which I find @angelubide persuasive). on.wsj.com/1EhnZj7 via @WSJecon http://t.co/AUW8VSsKkv—
Greg Ip (@greg_ip) April 23, 2015
What is left of Greece
05 May 2015 Leave a comment
Greece.
(Source: wsj.com/article_email/…) http://t.co/ZWYwiKt9W1—
Justin Wolfers (@JustinWolfers) May 02, 2015
Post-war reconstruction then Eurosclerosis – Germany, Italy and France 1950-2013
04 May 2015 Leave a comment
in currency unions, economic growth, economic history, Euro crisis, macroeconomics Tags: Eurosclerosis, France, Germany, Italy, post-war reconstruction
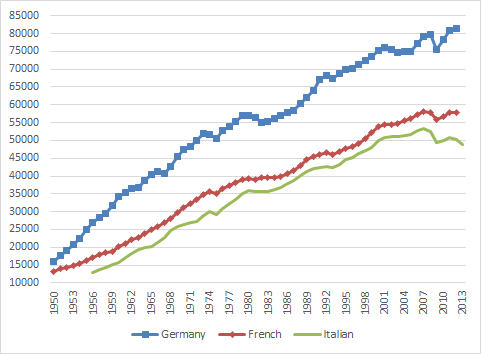
Figure 1: Real GDP per German, Italian and French aged 15-64, converted to 2013 price level with updated 2005 EKS purchasing power parities, 1950-2013
Source: Computed from OECD Stat Extract and The Conference Board, Total Database, January 2014, http://www.conference-board.org/economics
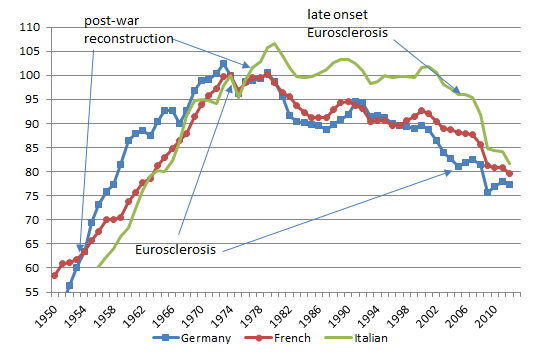
Figure 2: Real GDP per German, Italian and French aged 15-64, converted to 2013 price level with updated 2005 EKS purchasing power parities, 1.9 per cent detrended, 1950-2013
Source: Computed from OECD Stat Extract and The Conference Board, Total Database, January 2014, http://www.conference-board.org/economics
A flat line in figure 2 means real GDP growth of 1.9% per year, which is trend growth. A rising line means growth that is higher than trend rate; a falling line means growth at below the trend rate of 1.9%. 1.9% is the trend rate of growth of the USA in the 20th century. Figure 2 shows that:
- Germany, Italy and France all boomed until the mid-1970s;
- the French and German economies went into a long-term decline from that time; and
- the Italian economy stopped growing at anything more than the trend rate of growth between the mid-1970s and the mid-1990s and then went into a sharp decline that borders on the depression.
Further evidence of the success of the 1996 US welfare reforms and a lack of wage stagnation
03 May 2015 1 Comment
in economic growth, economic history, labour economics, labour supply, politics - USA, welfare reform Tags: middle-class wage stagnation, top 1%, US welfare reforms, wage stagnation
http://t.co/l7NzR1byNF—
EPI Chart Bot (@epichartbot) April 27, 2015
http://t.co/VZTp2A0H8n—
EPI Chart Bot (@epichartbot) April 05, 2015
Swedosclerosis and the British disease compared, 1950–2013
03 May 2015 2 Comments
in economic growth, economic history, entrepreneurship, macroeconomics, Public Choice, public economics Tags: British disease, British economy, Margaret Thatcher, poor man of Europe, Sweden, Swedosclerosis, taxation and the labour supply, welfare state
In 1970, Sweden was labelled as the closest thing we could get to Utopia. Both the welfare state and rapid economic growth – twice as fast as the USA for the previous 100 years.
Of course the welfare state was more of a recent invention. Assar Lindbeck has shown time and again in the Journal of Economic Literature and elsewhere that Sweden became a rich country before its highly generous welfare-state arrangements were created
Sweden moved toward a welfare state in the 1960s, when government spending was about equal to that in the United States – less that 30% of GDP.
Sweden could afford to expand its welfare state at the end of the era that Lindbeck labelled ‘the period of decentralization and small government’. Swedes in the 60s had the third-highest OECD per capita income, almost equal to the USA in the late 1960s, but higher levels of income inequality than the USA.
By the late 1980s, Swedish government spending had grown from 30% of gross domestic product to more than 60% of GDP. Swedish marginal income tax rates hit 65-75% for most full-time employees as compared to about 40% in 1960. What happened to the the Swedish economic miracle when the welfare state arrived?
In the 1950s, Britain was also growing quickly, so much so that the Prime Minister of the time campaigned on the slogan you never had it so good.

By the 1970s, and two spells of labour governments, Britain was the sick man of Europe culminating with the Winter of Discontent of 1978–1979. What happened?

Sweden and Britain in the mid-20th century are classic examples of Director’s Law of Public Expenditure. Once a country becomes rich because of capitalism, politicians look for ways to redistribute more of this new found wealth. What actually happened to the Swedish and British growth performance since 1950 relative to the USA as the welfare state grew?
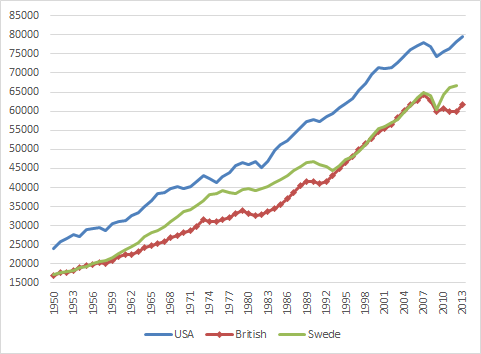
Figure 1: Real GDP per Swede, British and American aged 15-64, converted to 2013 price level with updated 2005 EKS purchasing power parities, 1950-2013, $US
Source: Computed from OECD Stat Extract and The Conference Board, Total Database, January 2014, http://www.conference-board.org/economics
Figure 1 is not all that informative other than to show that there is a period of time in which Sweden was catching up with the USA quite rapidly in the 1960s. That then stopped in the 1970s to the late 1980s. The rise of the Swedish welfare state managed to turn Sweden into the country that was catching up to be as rich as the USA to a country that was becoming as poor as Britain.
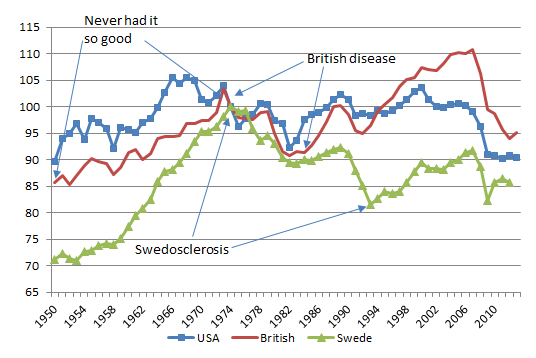
Figure 2: Real GDP per Swede, British and American aged 15-64, converted to 2013 price level with updated 2005 EKS purchasing power parities, detrended, 1.9%, 1950-2013
Source: Computed from OECD Stat Extract and The Conference Board, Total Database, January 2014, http://www.conference-board.org/economics
Figure 2 which detrends British and Swedish growth since 1950 by 1.9% is much more informative. The US is included as the measure of the global technological frontier growing at trend rate of 1.9% in the 20th century. A flat line indicates growth at 1.9% for that year. A rising line in figure 2 means above-trend growth; a falling line means below trend growth for that year. Figure 2 shows the USA growing more or less steadily for the entire post-war period. There were occasional ups and downs with no enduring departures from trend growth 1.9% until the onset of Obamanomics.
Figure 2 illustrates the volatility of Swedish post-war growth. There was rapid growth up until 1970 as the Swedes converged on the living standards of Americans. This growth dividend was then completely dissipated.
Swedosclerosis set in with a cumulative 20% drop against trend growth. The Swedish economy was in something of a depression between 1970 and 1990. Swedish economists named the subsequent economic stagnation Swedosclerosis:
- Economic growth slowed to a crawl in the 1970s and 1980s.
- Sweden dropped from near the top spot in the OECD rankings to 18th by 1998 – a drop from 120% to 90% of the OECD average inside three decades.
- 65% of the electorate receive (nearly) all their income from the public sector—either as employees of government agencies (excluding government corporations and public utilities) or by living off transfer payments.
- No net private sector job creation since the 1950s, by some estimates!
Prescott’s definition of a depression is when the economy is significantly below trend, the economy is in a depression. A great depression is a depression that is deep, rapid and enduring:
- There is at least one year in which output per working age person is at least 20 percent below trend; and
- there is at least one year in the first decade of the great depression in which output per working age person is at least 15 percent below trend; and
-
There is no significant recovery during the period in the sense that there is no subperiod of a decade or longer in which the growth of output per working age person returns to rates of 2 percent or better.
The Swedish economy was not in a great depression between 1970 and 1990 but it meets some of the criteria for a depression but for the period of trend growth between1980 and 1986.
Between 1970 and 1980, output per working age Swede fell to 10% below trend. This happened again in the late 80s to the mid-90s to take Sweden 20% below trend over a period of 25 years.
Some of this lost ground was recovered after 1990 after tax and other reforms were implemented by a right-wing government. The Swedish economic reforms from after 1990 economic crisis and depression are an example of a political system converging onto more efficient modes of income redistribution as the deadweight losses of taxes on working and investing and subsidies for not working both grew.
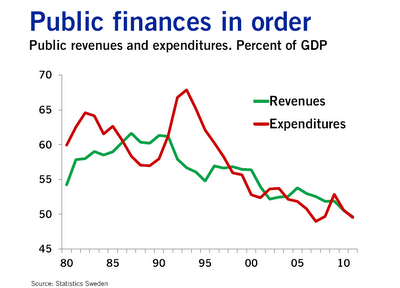
The Swedish economy since 1950 experienced three quite distinct phases with clear structural breaks because of productivity shocks. There was rapid growth up until 1970; 20 years of decline – Swedosclerosis; then a rebound again under more liberal economic policies.
The sick man of Europe actually did better than Sweden over the decades since 1970. The British disease resulted in a 10% drop in output relative to trend in the 1970s, which counts as a depression.

There was then a strong recovery through the early-1980s with above trend growth from the early 1980s until 2006 with one recession in between in 1990. So much for the curse of Thatchernomics?
After falling behind for most of the post-war period, the UK had a better performance compared with other leading countries after the 1970s.
This continues to be true even when we include the Great Recession years post-2008. Part of this improvement was in the jobs market (that is, more people in work as a proportion of the working-age population), but another important aspect was improvements in productivity…
Contrary to what many commentators have been writing, UK performance since 1979 is still impressive even taking the crisis into consideration. Indeed, the increase in unemployment has been far more modest than we would have expected. The supply-side reforms were not an illusion.
John van Reenen goes on to explain what these supply-side reforms were:
These include increases in product-market competition through the withdrawal of industrial subsidies, a movement to effective competition in many privatised sectors with independent regulators, a strengthening of competition policy and our membership of the EU’s internal market.
There were also increases in labour-market flexibility through improving job search for those on benefits, reducing replacement rates, increasing in-work benefits and restricting union power.
And there was a sustained expansion of the higher-education system: the share of working-age adults with a university degree rose from 5% in 1980 to 14% in 1996 and 31% in 2011, a faster increase than in France, Germany or the US. The combination of these policies helped the UK to bridge the GDP-per-capita gap with other leading nations.
British economic recoveries compared
03 May 2015 Leave a comment
in business cycles, global financial crisis (GFC), great depression, great recession, job search and matching, macroeconomics Tags: British economy, British general election, recessions and recoveries
Growth was good last year, will be okay in years to come. But overall? The slowest recovery in history #Budget2015 http://t.co/oMpkKpvIa1—
Fraser Nelson (@FraserNelson) March 18, 2015
College graduates don’t really notice recessions
02 May 2015 Leave a comment
in business cycles, economics of education, great recession, human capital, labour economics, macroeconomics, occupational choice, politics - USA, unemployment Tags: College premium, education premium, labour demographics
Our monthly update on the question: should I stay in school? blogs.wsj.com/economics/2015… http://t.co/IaVxoAJmqe—
Josh Zumbrun (@JoshZumbrun) April 03, 2015
On the New Deal and the rule of law
01 May 2015 Leave a comment
in economic history, macroeconomics, monetary economics, politics - USA Tags: gold standard, New Deal, regime uncertainty, rule of law
Recoveries from recessions across the G-7
28 Apr 2015 Leave a comment
in business cycles, economic growth, Euro crisis, global financial crisis (GFC), great recession, macroeconomics, politics - USA Tags: British economy, Canada, Eurosclerosis, France, Germany, Italy, Japan, recoveries from recessions
UK recovery: stronger than Italy, weaker than US & Canada. http://t.co/C0TEsbzMm3—
Jonathan Portes (@jdportes) April 28, 2015
The impact of the top tax rate in the depth and severity of the great depression
24 Apr 2015 Leave a comment
in business cycles, fiscal policy, great depression, macroeconomics, politics - New Zealand, politics - USA, public economics Tags: capital taxation, New Zealand, taxation and the labour supply, top tax rate
Source: Ellen McGrattan.
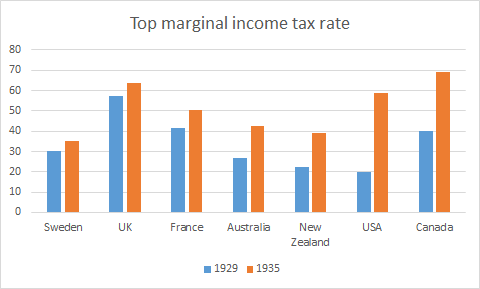
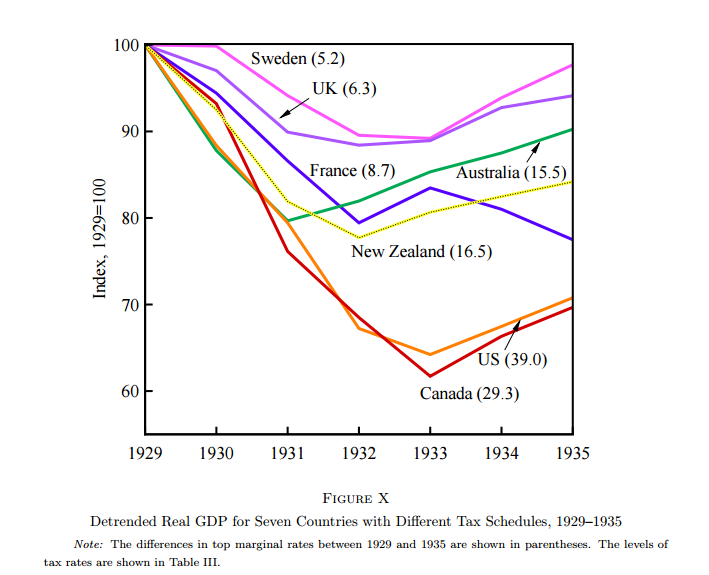
There were large differences in increases in the 1930s in the top marginal income tax rate between Sweden, the UK, France with Australia and New Zealand and between the USA and Canada and the rest as McGrattan explains:
These data show that there is a strong negative correlation, roughly −94%, between the change in the top income tax rates and the deviation in per capita real GDP relative to trend in 1933.
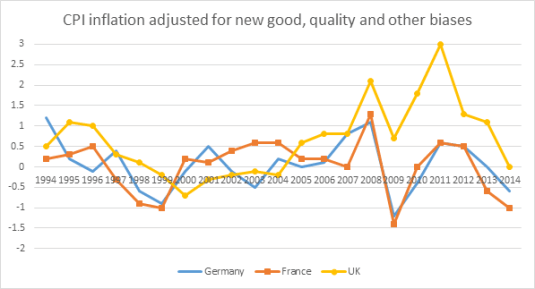
British, German and French inflation rates adjusted for 1.5% new goods and quality bias, 1994-2014
24 Apr 2015 Leave a comment
in economic history, inflation targeting, macroeconomics, monetary economics
There has been close to zero inflation in France and Germany for almost 20 years now. The UK had mild deflation between 1998 and 2005, followed by a spike in inflation.
Source: OECD StatExtract.
Note that the 1.5% bias adjustment includes other known biases in the CPI in addition to new goods and quality variation.
The role of new taxes in the Great Recession
24 Apr 2015 Leave a comment
in economic growth, fiscal policy, great recession, labour economics, labour supply, macroeconomics, politics - USA Tags: great recession, obama, Obamacare, taxation and entrepreneurship, taxation and investment, taxation and labour supply


.
Australian and New Zealand inflation rates adjusted for new goods and quality bias of 1.5%
23 Apr 2015 Leave a comment
in inflation targeting, macroeconomics, politics - Australia, politics - New Zealand Tags: Australia, CPI bias, inflation, New Zealand
In praise of measurement error: good thing no one noticed the severe deflation in Australia and in New Zealand in the late 1990s for otherwise the do-gooders might have felt the need to do something about it. Good thing no one is panicking over the recent mild deflation in New Zealand as well.
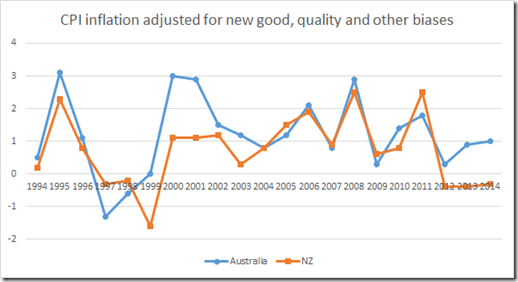
Source: OECD StatExtract


Recent Comments