Income from selling citizenships is now 16% of Malta government's budget http://t.co/VplY2a6IHD @dslesperance pic.twitter.com/C5HS8PjOb0
— Old Whig. 🇺🇲🇸🇪🇫🇮🇪🇪🇦🇹 (@aClassicLiberal) March 22, 2015
The macroeconomy of Euroland – the good, the bad, and the ugly
23 Mar 2015 Leave a comment
in Euro crisis, macroeconomics
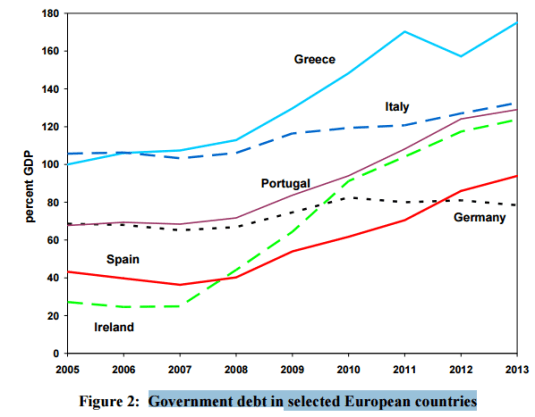
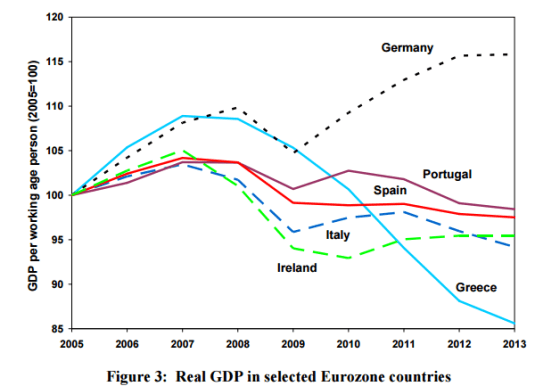
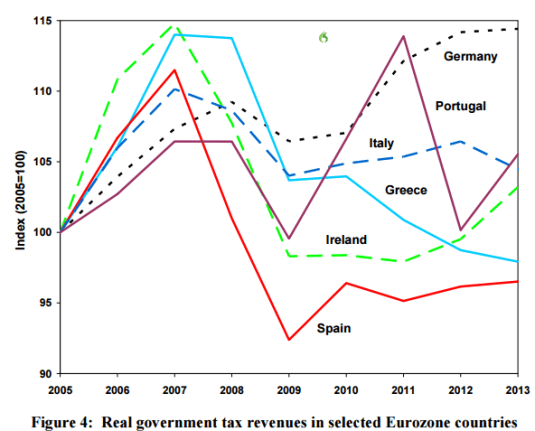
Why Portugal, Italy, Greece and Spain are called the PIGS
23 Mar 2015 Leave a comment
in economic growth, economic history, Euro crisis, macroeconomics

HT: Finn Kydland
The industries where personal connections matter the most in getting a job – The Washington Post
23 Mar 2015 Leave a comment
in job search and matching, labour economics, occupational choice Tags: job networks

via The industries where personal connections matter the most in getting a job – The Washington Post.
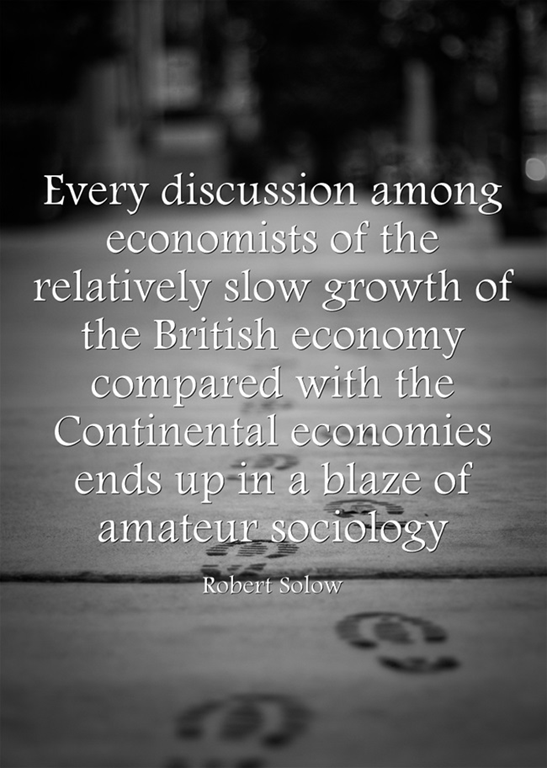
Roberts Solow on the British disease and Eurosclerosis
21 Mar 2015 Leave a comment
in currency unions, economic growth, economics of regulation, Euro crisis, fiscal policy, job search and matching, labour economics, labour supply, macroeconomics Tags: British disease, Euroland, European Union, Eurosclerosis, Robert Solow
HT: Brad Delong
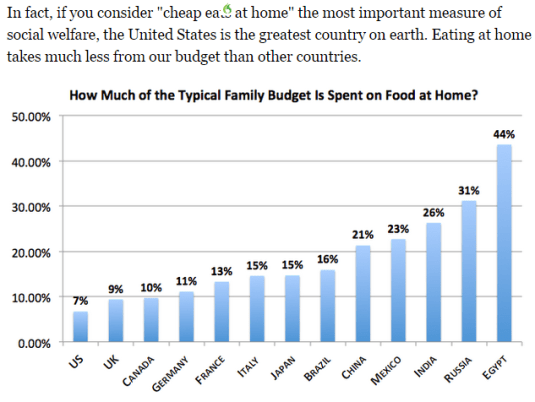
Why is it so expensive to eat in Europe as compared to America?
21 Mar 2015 Leave a comment
in applied welfare economics, economic growth, politics - USA
The fall and rise and fall of inflation in New Zealand
20 Mar 2015 Leave a comment
in economic history, inflation targeting, macroeconomics, monetary economics, politics - New Zealand
After the high inflation rates in the 70s and 80s, inflation disappeared by the end of the century. There is the occasional spike in the 2000s but now inflation is effectively zero. Measurement error in the consumer price index for increases in product quality and new goods means an inflation rate of about 2% rounds down the inflation rate to zero.
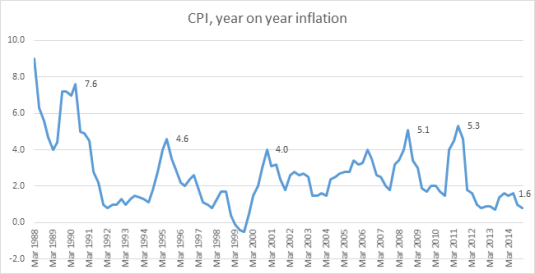
Source: Reserve Bank of New Zealand.
The Entire Global Economy in 1 Slide – Bloomberg Business
19 Mar 2015 Leave a comment
in business cycles, economic growth, Euro crisis, politics - Australia, politics - New Zealand, politics - USA Tags: global economic integration

Paul Samuelson on where he disagreed with Milton Friedman on macroeconomic policy
19 Mar 2015 Leave a comment
in budget deficits, business cycles, economic growth, fiscal policy, inflation targeting, macroeconomics, Milton Friedman, monetarism, monetary economics Tags: fiscal policy, monetary policy, Paul Samuelson, rules versus discretion, stabilisation policy
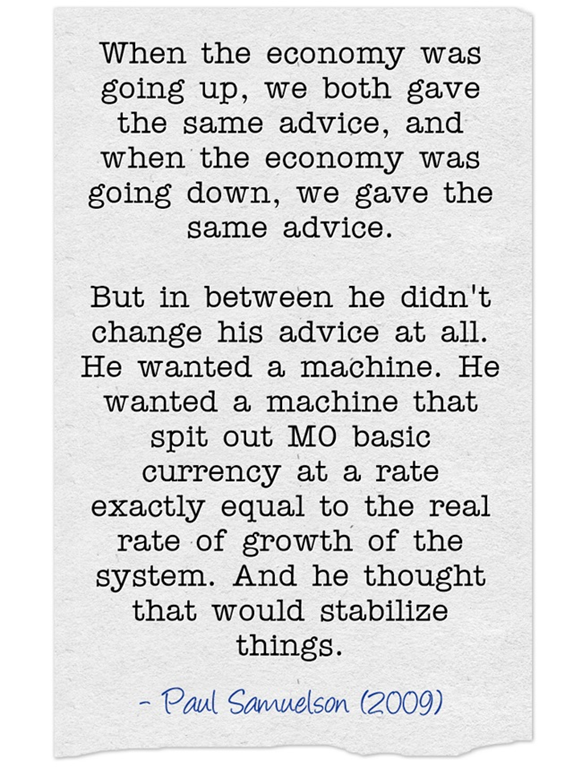
via Samuelson vs. Friedman, David Henderson | EconLog | Library of Economics and Liberty and An Interview With Paul Samuelson, Part One — The Atlantic.
Class war warrior @WJRosenbergCTU inadvertently refutes the case for the class struggle
17 Mar 2015 Leave a comment
in applied welfare economics, economic growth, economic history, labour economics, poverty and inequality, unions
Today in the Dominion Post, Bill Rosenberg, a trade union self-described economist, argued that the workers are not getting their fair share of productivity gains in New Zealand over the last 35 years:
I calculate that wages in the 60 per cent of the economy studied by the commission would have been 12 per cent higher on average by March 2011, if they had kept up with productivity since 1978.
He then rounded up the usual Twitter Left suspects:
The commission’s study is important in that it finds that a large part of the fall in the labour share of income in the 1990s was due to high unemployment created by the radical restructuring of the economy that began in the 1980s and the Employment Contracts Act passed in 1991. Australia underwent similar restructuring during the period, but its labour income share fell only slightly. Its labour market is underpinned with an award system and other protections.
12%! 12% is at all that the class struggle is about over a 35 year period in terms of wage losses and labour surplus extract by the greedy bosses?
Figure 1: Real equivalised median household income (before housing costs) by ethnicity, 1988 to 2013 ($2013)

Source: Bryan Perry, Household incomes in New Zealand: Trends in indicators of inequality and hardship 1982 to 2013. Ministry of Social Development (July 2014).
As shown in figure 1, between 1994 and 2010, real equivalised median New Zealand household income rose by 47%; for Māori, this rise was 68%; for Pasifika, the rise in real equivalised median household income was 77%. Obviously these losses from the change in shares of GDP are dwarfed by the general increases in living standards over the last 20 years.
As is common with every member of the Left over Left that I run into these days, such as Bill Rosenberg, their analysis has no gender analysis.
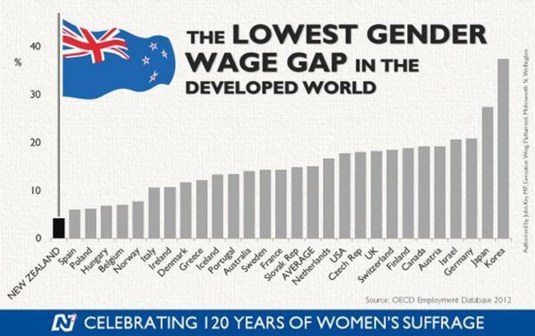
The Left over Left invariably fail to mention that New Zealand has the smallest gender wage gap of all the industrialised countries.
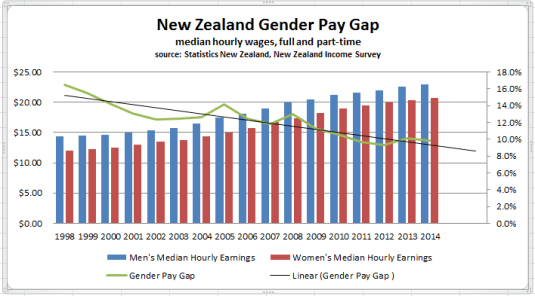
Over the last more than two decades in New Zealand, there has been sustained income growth spread across all of New Zealand society contrary to hopes and dreams of the Left over Left. Perry (2014) reviews the poverty and inequality data in New Zealand every year for the Ministry of Social Development. He concluded that:
Overall, there is no evidence of any sustained rise or fall in inequality in the last two decades. The level of household disposable income inequality in New Zealand is a little above the OECD median. The share of total income received by the top 1% of individuals is at the low end of the OECD rankings.
As for Rosenberg’s hypothesis that it’s all the fault of the Employment Contracts Act, that doesn’t stand up. Figure 2 shows that union membership has been in a long slow decline in New Zealand since the mid-1970s. This is been pretty much the pattern all round the world.
Figure 2: Union density, New Zealand, Australia, the UK and USA 1970-2013

Source: OECD Stats Extract
The much hated Employment Contracts Act 1991, much hated by the Left over Left, doesn’t really show up in the union density figures in figure 2. There is no sudden break in trend obvious in figure 2 in the early 1990s when the Employment Contract Act was passed.
Indeed, the passage of the Employment Contracts Act 1991 was followed by a 15 year economic boom in employment and economic growth, as shown in figure 3. This was after the lost decades of 1974 to 1992 when there was next to no growth in real GDP per New Zealander aged 15 to 64. The good old days when the Lost Decades for New Zealand.
Figure 3: Real GDP per New Zealander and Australian aged 15-64, converted to 2013 price level with updated 2005 EKS purchasing power parities, 1956-2013
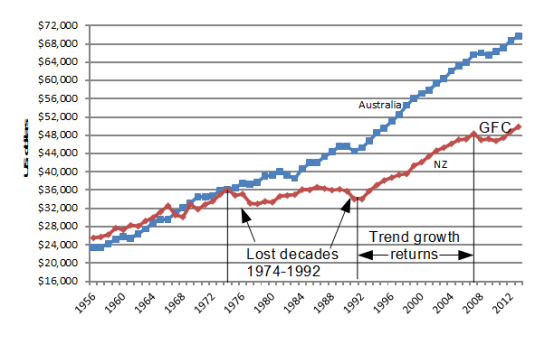
Source: Computed from OECD Stat Extract and The Conference Board, Total Database, January 2014.
Things are so grim for the class struggle in New Zealand that the leader of the Labour Party has had to redefine the working class because it is withering away so rapidly because so many workers are joining the middle-class:
Andrew Little is looking to update Labour's definition of the 'working class': stuff.co.nz/national/polit… http://t.co/AQ9mJL7CQf—
NZ Stuff Politics (@NZStuffPolitics) November 30, 2014

After reading the annual reports of the Fed, Milton Friedman noticed the following pattern
16 Mar 2015 Leave a comment
in business cycles, great depression, macroeconomics, Milton Friedman, monetarism, monetary economics Tags: lags on monetary policy, monetary policy

.
Monetary Policy When One Size Does Not Fit All
15 Mar 2015 Leave a comment
in currency unions, Euro crisis, inflation targeting, macroeconomics
When members of a monetary union are experiencing different macroeconomic conditions, a single policy rate is unlikely to fit circumstances in all countries. Currently, the ECB’s target rate seems to be in line with a Taylor rule recommendation for the euro area as a whole. However, economic differences between peripheral and core euro-area countries are sharp. The core countries are recovering, while the peripheral countries still have large unemployment gaps. Thus, the ECB target rate is not in line with Taylor rule recommendations for the peripheral countries.
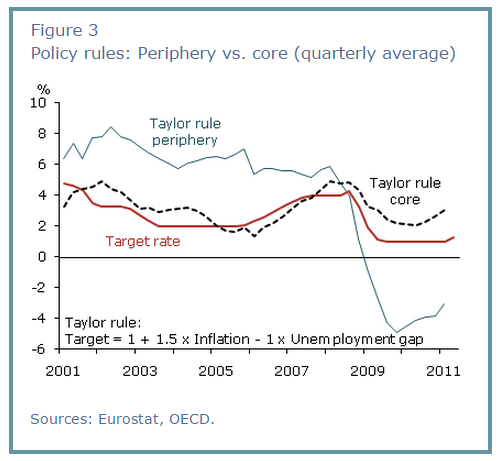

via Federal Reserve Bank San Francisco | Monetary Policy When One Size Does Not Fit All.


Recent Comments