Trailblazers: The New Zealand Story – Full Video
29 Apr 2017 Leave a comment
in economic history, economics of regulation, industrial organisation, politics - New Zealand, Public Choice, public economics, rentseeking, survivor principle
Important to mention tax credits when discussing the working poor? @JordNZ
21 Apr 2017 Leave a comment
in labour economics, politics - New Zealand, poverty and inequality, public economics, welfare reform Tags: child poverty, family poverty, family tax credits, taxation and labour supply

Which matters more to the incentive effects of income tax? @JordNZ
20 Apr 2017 Leave a comment
in politics - New Zealand, public economics Tags: average tax rates, family taxation, Marginal tax rates, taxation and labour supply

So New Zealanders do not pay much income tax @TaxpayersUnion
19 Apr 2017 Leave a comment
in politics - USA, public economics Tags: family tax credits, family taxation, Marginal tax rates, taxation and labour supply

Do smokers stockpile in anticipation of tax rises?
16 Apr 2017 Leave a comment
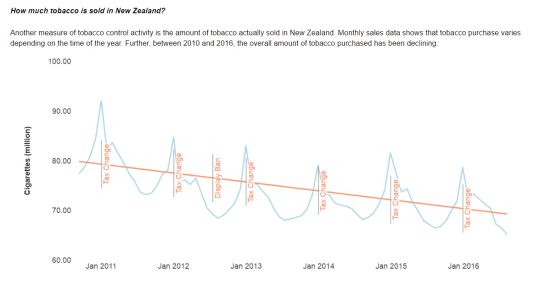
Source: TCDR – Overview
No income tax to cut anymore until household incomes in the six figures!
31 Mar 2017 Leave a comment

The wage bump from 1% Oz company tax cut @TheAusInstitute @GrattanInst @JordNZ
31 Mar 2017 Leave a comment
in economic growth, fiscal policy, politics - Australia, politics - New Zealand, public economics Tags: company tax incidence, endogenous growth theory, optimal tax theory

How wasteful is the Oz company tax? @TheAusInstitute @GrattanInst
30 Mar 2017 Leave a comment

Source: The incidence of company tax in Australia, Xavier Rimmer, Jazmine Smith and Sebastian Wende, Australian Treasury working paper.
Morgan’s capital tax forgot 30% retirees move every 5 years @TaxpayersUnion
30 Mar 2017 Leave a comment
in politics - New Zealand, population economics, public economics Tags: 2017 New Zealand election, capital taxation, inheritance taxes, Opportunities Party, optimal tax theory

With 30% of retirees changing address every 5 years, they will have to downsize into hovels because they have to pay IRD the great big new tax on their capital championed by Morgan and his Opportunities Party well before they die.

Morgan’s 1.8% tax on equity capital is not an inheritance tax for the majority of retirees. It is a nest egg tax as they downsize after the kids fly the nest, grandchildren appear or they move to a more convenient place as they become frail.
Because they will have to pay back taxes of tens of thousands of dollars to IRD every time they sell their house, retirees either will not be able to move closer to family because of grand-children or health issues or they will have difficulty moving into a retirement home of their choice.
This is the first in a series of blogs showing how the Opportunities Party is too clever by half in its manifesto development. By insisting on having different policies to everybody else by a good country mile, it ends up having to take up the policies others rejected because they do not work.
In the case at hand, they put an inheritance tax on ordinary New Zealanders at the same rate as the rich including the founder of the Opportunities Party. This tax will be the only capital tax anywhere that is not progressive.
Over 70% of the retired own their own house mortgage free. The majority of that equity will now go to IRD plus interest by the time both members of the couple die given the average capital tax will be about $10,000 per year in Wellington and twice that in Auckland. They face up to 20 to 25 years of deferred capital taxation that will take half the value of their house easily. It will be hardest if they must cash-out their house to go into retirement home.

The purpose of buying a house is to have a nest egg for retirement. You may draw down that capital because of health issues or pass it on to children if you are luckier than that.
Morgan wants to radically change the way in which retirees go into the evening of their days. People who just managed to save for a house will have nothing to pass on to their children. No more bank of mum and dad either.
Sharp ratios of @NZSuperFund since inception @TaxpayerUnion
28 Mar 2017 Leave a comment
in financial economics, fiscal policy, politics - New Zealand, public economics Tags: sharp ratios, sovereign wealth funds
The Sharp ratio describes how much excess return you are receiving for the extra volatility that you endure for holding a riskier asset. If manager A generates a return of 15% while manager B generates a return of 12%, it would appear that manager A is a better performer. But if manager A took much larger risks than manager B, manager B may be a better risk-adjusted return.
The Sharpe Ratio such as those below of the NZ Superannuation Fund can be used to compare two funds on how much risk a fund had to bear to earn excess return over the risk-free rate.
Source:New Zealand Superannuation Fund response to Official Information Act request.
The Kidney Machine Gambit & @NZSuperFund @VernonSmall @TaxpayersUnion
27 Mar 2017 Leave a comment
in fiscal policy, politics - New Zealand, public economics, television Tags: sovereign wealth funds, Yes Prime Minister
Prime Minister Jim Hacker: “Well, of course we do what we can. There are many calls on the public purse: inner cities, schools, hospitals, kidney machines…”

98% top US economists disagree @NZSuperFund strategy @VernonSmall @JordNZ
24 Mar 2017 Leave a comment
in financial economics, fiscal policy, politics - New Zealand, public economics Tags: active investing, efficient markets hypothesis, passive investing, sovereign wealth funds

There is always one. Liran Einav had to be the only economist out of 100 or so top American and European economists who disagreed with the proposition that:
In general, absent any inside information, an equity investor can expect to do better by choosing a well-diversified, low-cost index fund than by picking a few stocks.
The New Zealand Superannuation Fund’s policy of active investing has one supporter out of 100 surveyed by the Initiative for Global Markets. I suppose it is better than none.
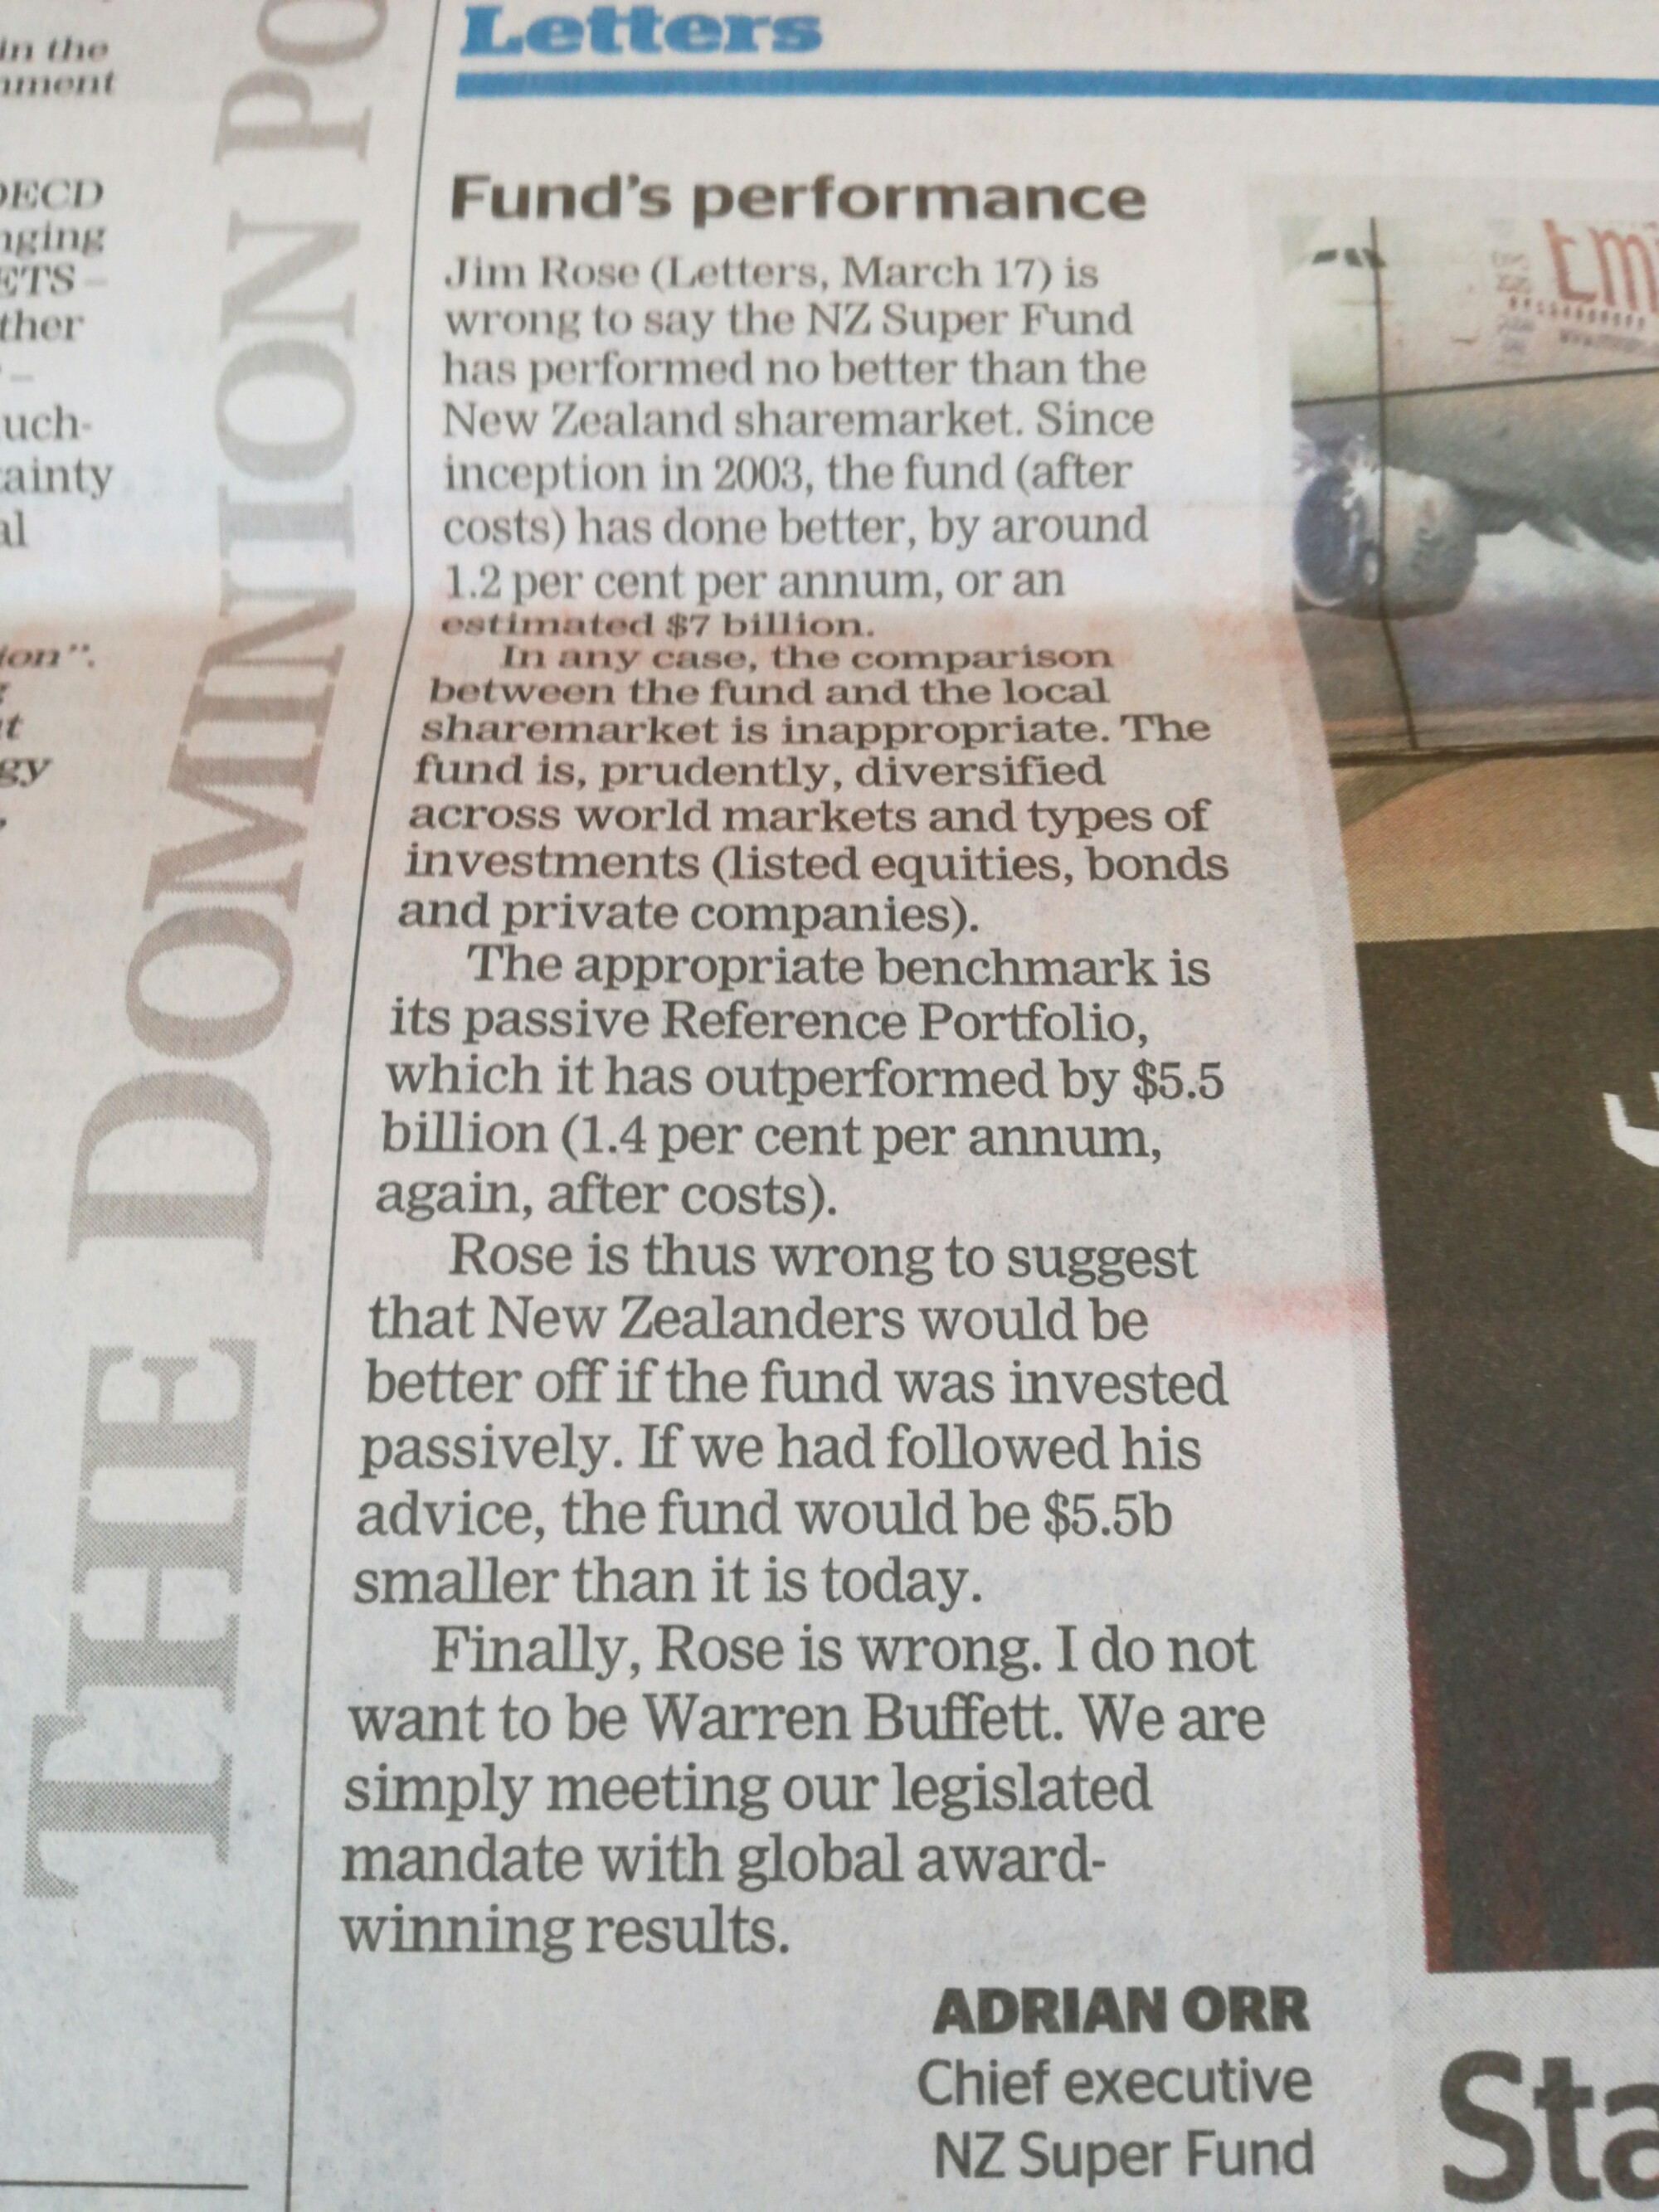
Letter to @DomPost on @NZSuperfund performance @Taxpayersunion utopiayouarestandinginit.com/2017/03/18/let… https://t.co/wxo6F1zZn5—
Jim Rose (@JimRose69872629) March 18, 2017
The chief executive of the fund quibbles by claiming there is a 3rd way between active and passive investing but there is not as William Sharp explained in his timeless 1991 article, The Arithmetic of Active Management:
- A passive investor always holds every security from the market, with each represented in the same manner as in the market. Thus if security X represents 3 per cent of the value of the securities in the market, a passive investor’s portfolio will have 3 per cent of its value invested in X. Equivalently, a passive manager will hold the same percentage of the total outstanding amount of each security in the market2.
- An active investor is one who is not passive. His or her portfolio will differ from that of the passive managers at some or all times. Because active managers usually act on perceptions of mispricing, and because such misperceptions change relatively frequently, such managers tend to trade fairly frequently — hence the term “active.”
An active fund is a fund that is not a passive fund. If you do not own a balanced portfolio of every security in the market, you are an active investor.
The majority of the New Zealand Superannuation fund is passively invested but some of it is not. It is invested in dogs like KiwiBank, in Z service stations and even in some bad Portuguese loans.
It’s "threadbare" to question @NZSuperFund’s investment strategy @TaxpayersUnion
23 Mar 2017 Leave a comment
There really is an issue on which economists are unanimous, a big issue to boot.

Source: Diversified Investing | IGM Forum.

Actively-managed mutual funds cannot earn excess returns over index funds because in aggregate they earn the same as index funds, less the difference in cost. This was proposed by Sharpe in his timeless 1991 article, The Arithmetic of Active Management.
Of course, certain definitions of the key terms are necessary. First a market must be selected — the stocks in the S&P 500, for example, or a set of “small” stocks. Then each investor who holds securities from the market must be classified as either active or passive.
- A passive investor always holds every security from the market, with each represented in the same manner as in the market. Thus if security X represents 3 per cent of the value of the securities in the market, a passive investor’s portfolio will have 3 per cent of its value invested in X. Equivalently, a passive manager will hold the same percentage of the total outstanding amount of each security in the market2.
- An active investor is one who is not passive. His or her portfolio will differ from that of the passive managers at some or all times. Because active managers usually act on perceptions of mispricing, and because such misperceptions change relatively frequently, such managers tend to trade fairly frequently — hence the term “active.”
… Properly measured, the average actively-managed dollar must underperform the average passively-managed dollar, net of costs. Empirical analyses that appear to refute this principle are guilty of improper measurement.
In 2008, Warren Buffett made a bet of $1 million with Protégé Partners LLC that, including fees, costs and expenses, an S&P 500 index fund would outperform a hand-picked portfolio of hedge funds over the 10 years ending December 31, 2017.


Recent Comments