The New Zealand Labour Party and New Zealand Greens both make much of the fact that when you privatise a state-owned enterprise the taxpayer is no longer entitled to dividends from the privatised business. The fact that the sale price is the net present value of those future dividends is a rating fallacy that is not the subject of this post.
Source: New Zealand Treasury – data released under the Official Information Act.
What is the subject of this post is whether there are indeed any dividends paid to taxpayers after capital injections. 2007 was the last year in which dividends to the taxpayer exceeded capital injections. The reason was that dog called KiwiRail.
I asked for information from the Treasury for as far back as 2000 but could only get information back to 2008 on the return on equity of the portfolio of state-owned enterprises to the taxpayer.
Source: New Zealand Treasury – released under Official Information Act.
Apparently, long-term information on the performance of the state-owned enterprise portfolio is not available. Anyone wanting to know the performance of an individual or group of listed companies simply looks at the share price was far back as they want. The prices of individual shares reflect market expectations of future dividends and future price movements, and they go up and down as new information is revealed. The history of a share price indicates the ups and downs of a company in one number far better than any other available indicator.
I also included the adjusted rate of return on equity taking out the two dogs in the portfolio: Solid Energy and KiwiRail.
Source: New Zealand Treasury – released under Official Information Act.
Some public goods can be not provided much at all if even a few do not contribute – free ride. These are called weakest shot public goods. The link in the chain is only as strong as the weakest link for some public goods. The fighting against communicable diseases is an example of that.
Similar examples would be the protection of a military front, taking a convoy across the ocean going at the speed of the slowest ship, or maintaining an attractive village/landscape (one eyesore spoils the view).
Many instances of teamwork involve weak-link elements, for example moving a pile of bricks by hand along a chain or providing a theatrical or orchestral performance (one bad individual effort spoils the whole effect.)
Another example of weakest shot public goods is community cooperation after disasters. The quality of the public good provided is equal to the contribution of the weakest person who may start a criminal rampage despite the good efforts of everyone else.
People tend to be more cooperative after natural disasters. They realise their contribution is more important than normal to the maintaining of the social fabric which is currently hanging by a thread.
Vaccinations are example of a weakest shot public good. The quality of herd immunity depends fundamentally on just about everybody contributing by getting vaccinated. Not all public goods depend on the some of those contributions made. In some cases just a few people choosing to free ride can greatly undermine the public interest.
The reverse of a weakest shot public good is best shot public goods. Example of this is the development of vaccines themselves. The public good is only as good as the best effort at developing the new vaccine with all the others efforts pointless because the best of the vaccines is chosen.
The most curious people in New Zealand to oppose measures to address the under provision of weakest shot public goods are the New Zealand Greens.
Herd immunity protects those who cannot be safely vaccinated including new babies, those for whom the vaccine fails, which occasionally happens, and those with compromised immunity such as adults receiving chemotherapy.
We are all in this together. It is time for the New Zealand Greens to stop pandering to those are only think of themselves and what a free ride on others including the very sick and new babies.
Herd immunity requires vaccination rates of about 94%. The near universal vaccination rates required for herd immunity are to smaller margin to pander to an awkward squad who do not want to vaccinate despite the harm they do to others.
Harm to others is grounds and has always been grounds for public policy and public health interventions. Instead, the Greens are anti-science, anti-public health.
Measles is the most contagious disease known to man. Seven children died in New Zealand in the last measles outbreak in 1991. The dead are already too many from the anti-vaccination quacks and cranks.
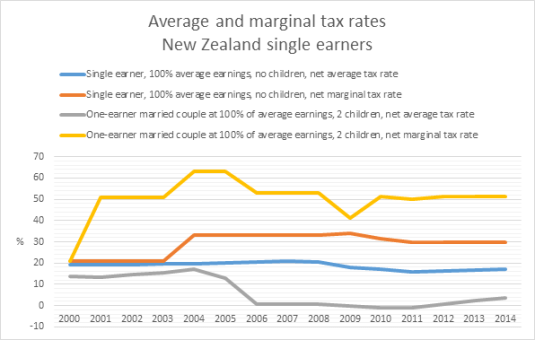
Interesting to notice that in New Zealand and the USA after these increases in marginal tax rates on single taxpayers, their economies slowed down. What appears to have happened is a number of people reached the next income tax marginal tax rate threshold.
21% would have been a good guess of the average and marginal tax rates of the New Zealand single earner or couple including with children and even a second earner in 2001. New Zealand average and marginal tax rates have been on a wild ride since the year 2000.
As the above chart shows, while the average tax rate of a single earner with no children is pretty much unchanged at about 20%, he now faces a marginal tax rate of 30% or more rather than 21% in 2001.
For a married couple with one income, as the above chart shows, their average tax rate has been about zero for a good 10 years now but their net marginal tax rate is a good 50% or more because of abatement rates on family tax credits, which is a skewed incentive situation. A large income effect from the family tax credit encourages the consumption of leisure but a high marginal tax rate discourages working more.
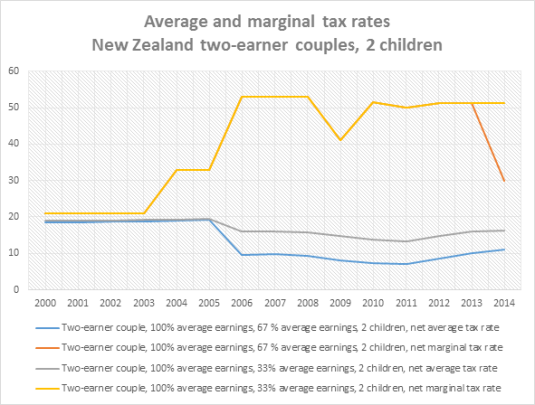
For two earner couples, their average tax rates have fallen because of family tax credits but their marginal tax rates have gone through the roof as the above chart shows. A tax system that discourages quite severely any further work or investment in human capital by average earners may have adverse effects on the long-term trend growth rate of New Zealand.
The New Zealand Superannuation Fund, the sovereign wealth fund part funding New Zealand’s old-age pension from 2029/2030 onwards, has been a bit of a wild ride. Sometimes the earnings of the Fund were well below and sometimes earning well above the long-term bond rate.
Source: New Zealand Superannuation Fund Annual Report 2014.
Since its inception, the Fund earned an average annual return of 9.78%, which was 5.06% above the long-term bond rate, and 1.03% above its reference portfolio.
No information was given in the annual report of the New Zealand Superannuation Fund on the marginal dead weight cost of the taxes raised to fund the New Zealand Superannuation Fund to see whether there is any net benefit to taxpayers from its establishment and continued operation.
The New Zealand Government has contributed $14.88 billion to the fund from prior its inception in 2001 to the suspension of contributions in 2009 by the incoming National Party Government.
Source: New Zealand Treasury.
Over the nine years in which contributions were made, the company tax rate of 28% could have easily been up to 10 percentage points lower.
The New Zealand Treasury estimates that a one percentage point cut in the company tax costs about $220 million in forgone revenue if there are no other changes to the tax system. These are static estimates that do not include any feedback from greater investment and higher growth.
The New Zealand Superannuation Fund must beat the market every single year to make up for the deadweight cost of its funding, a premium for the investment risk added to the Crown’s portfolio and the cost to New Zealand’s growth rate of higher than otherwise taxes on income, entrepreneurship and investment.
Nearly eleven months after holding the State of Washington in contempt for failing to provide an adequate funding plan for financing primary education in the state, the Washington Supreme Court issued an order fining the state $100,000.00 per day until the legislature satisfies the Court’s judgement in its landmark McCleary decision.
After three special sessions, the Legislature failed to provide a clear and fully funded plan. The Court acted, much to the chagrin of many of the state legislators. A few of which had some rather interesting solutions to address their failures to act.
Why Evolution is True is a blog written by Jerry Coyne, centered on evolution and biology but also dealing with diverse topics like politics, culture, and cats.
In Hume’s spirit, I will attempt to serve as an ambassador from my world of economics, and help in “finding topics of conversation fit for the entertainment of rational creatures.”
“We do not believe any group of men adequate enough or wise enough to operate without scrutiny or without criticism. We know that the only way to avoid error is to detect it, that the only way to detect it is to be free to inquire. We know that in secrecy error undetected will flourish and subvert”. - J Robert Oppenheimer.


 People tend to be more cooperative after natural disasters. They realise their contribution is more important than normal to the maintaining of the social fabric which is currently hanging by a thread.


![image_thumb[3]](https://utopiayouarestandinginit.com/wp-content/uploads/2015/08/image_thumb310.png "image_thumb[3]")


Recent Comments