Why @GreenpeaceNZ @NZGreens are not @nzlabour’s comrades
13 Feb 2016 Leave a comment
in environmental economics, environmentalism, Marxist economics, politics - New Zealand
The only other fat man in North Korea
11 Feb 2016 Leave a comment
in defence economics, Marxist economics

I think he is the top party man in the military. The fat general 2nd from the right is still alive as far as I know.
The thin guy with the heightening hat just to his left has just been executed – he was Chief of the Army staff.
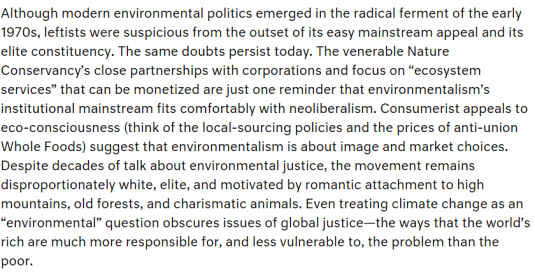
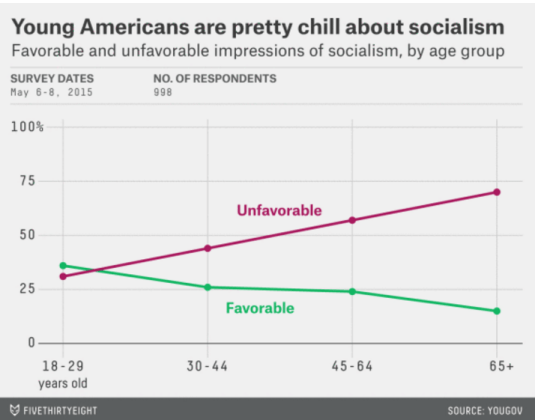
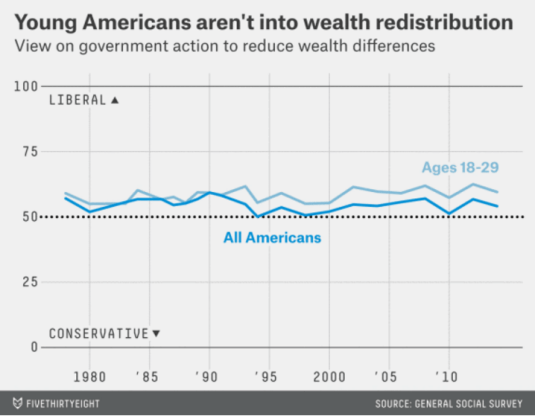
Young Democrats like @BernieSanders & socialism but oppose income redistribution as much as their parents do
09 Feb 2016 Leave a comment
in Marxist economics, politics - USA, Public Choice, public economics
#TPPANoWay @oxfamNZ @GreenpeaceUSA The Effects of Globalization
07 Feb 2016 Leave a comment
in applied price theory, applied welfare economics, development economics, economic history, growth disasters, growth miracles, international economics, Marxist economics Tags: customs unions, expressive voting, free trade, Leftover Left, ODA, preferential trading agreements, rational ignorance, rational irrationality, The Great Escape, The Great Fact, TPA, TPPA, Twitter left, Tyler Cowen
China controls dissidents abroad through relatives back home
06 Feb 2016 Leave a comment
in defence economics, economics of education, liberalism, Marxist economics Tags: China, dissent, Japan, tinpot dictatorships, totalitarian dictatorships
At graduate school in Japan, I was careful to rarely talk politics to Chinese students.
The reason was I assumed they were being spied on by fellow students at the behest of the Chinese security services.
@OwenJones84 @K_Niemietz GDP per capita has not more than doubled @chavezcandanga
05 Feb 2016 Leave a comment
in development economics, economic history, growth disasters, growth miracles, Marxist economics Tags: Argentina, Chile, China, left-wing populism, Leftover Left, Oil prices, The Great Fact, Twitter left, Venezuela

Source: The Conference Board. 2015. The Conference Board Total Economy Database™, May 2015, http://www.conference-board.org/data/economydatabase/
138,000 people out of poverty every day for 25 years while @oxfamnz claimed neo-liberalism ruined the world
25 Jan 2016 Leave a comment
in development economics, economic history, growth miracles, Marxist economics Tags: extreme poverty, global poverty, overseas aid, Oxfam, The Great Escape, The Great Fact
Deirdre McCloskey’s message for @oxfamnz @jeremycorbyn @BernieSanders
24 Jan 2016 Leave a comment
in applied price theory, development economics, economic history, economics of bureaucracy, economics of regulation, Marxist economics, politics - USA
Globalisation is Good – Johan Norberg on Globalisation
23 Jan 2016 Leave a comment
in applied welfare economics, development economics, economic history, growth miracles, international economics, Marxist economics Tags: capitalism and freedom, extreme poverty, global poverty, globalisation, The Great Escape, The Great Fact
@TheDailyBlogNZ’s only good tax cheat is a student loan defaulter?!
23 Jan 2016 Leave a comment
in economics of education, Marxist economics, politics - New Zealand, public economics

The life satisfaction gap between former workers’ paradises and capitalist economies is closing
22 Jan 2016 Leave a comment
in Marxist economics Tags: transitional economies
On the decline of socialism in the Americas
21 Jan 2016 Leave a comment
in applied price theory, development economics, economics of bureaucracy, growth disasters, Marxist economics, Public Choice, rentseeking Tags: 2016 presidential election, Argentina, Brazil, Venezuela
@jeremycorbyn betrays #Falklands self-determination
18 Jan 2016 1 Comment
in defence economics, Marxist economics
https://twitter.com/Mulder1981/status/681611193849634816
https://twitter.com/DGoodinson/status/688766431605968896
https://twitter.com/DavidJo52951945/status/688662517783113728
https://twitter.com/brokenbottleboy/status/686221142038806528

Recent Comments