Max Roser seems upset that British inequality rose since the 1980s for the top 1%. Other measures of inequality did not rise such as for disposable income.
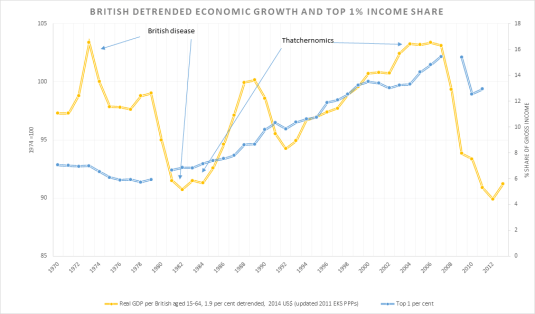
At the same time as top income shares grew at a pace, as shown in the chart below, the British economy boomed under the Thatchernomics, and if the British Left is to believed, under Thatchernomics by another name under Tony Blair. I’m not suggesting much in the way of linkages but the British Left gets excited about the relationship between top income shares and British economic prosperity. Britain grew at well above the trend rate of growth for the USA in the 20th‘s century for most of the period of Thatchernomics despite rising top 1% income shares or maybe course of that. Let’s not get carried away about linkages.
In the chart above, British economic growth since 1970 is detrended by the growth rate of the USA for the 20th century. The USA is taken to be the global technological frontier. A flat-line in the chart above is British growth at the same rate the USA which is 1.9%; a rising line is growth in that year faster than trend; and a falling line is growth below the trend rate growth.
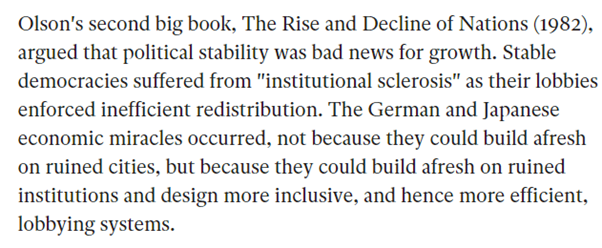
1. There will be no countries that attain symmetrical organization of all groups with a common interest and thereby attain optimal outcomes through comprehensive bargaining.
2. Stable societies with unchanged boundaries tend to accumulate more collusions and organizations for collective action over time.
3. Members of “small” groups have disproportionate organizational power for collective action, and this disproportion diminishes but does not disappear over time in stable societies.
4. On balance, special-interest organizations and collusions reduce efficiency and aggregate income in the societies in which they operate and make political life more divisive.
5. Encompassing organizations have some incentive to make the society in which they operate more prosperous, and an incentive to redistribute income to their members with as little excess burden as possible, and to cease such redistribution unless the amount redistributed is substantial in relation to the social cost of the redistribution.
6. Distributional coalitions make decisions more slowly than the individuals and firms of which they are comprised, tend to have crowded agendas and bargaining tables, and more often fix prices than quantities.
7. Distributional coalitions slow down a society’s capacity to adopt new technologies and to reallocate resources in response to changing conditions, and thereby to reduce the rate of economic growth.
8. Distributional coalitions, once big enough to succeed, are exclusive, and seek to limit the diversity of incomes and values of their membership.
9. The accumulation of distributional coalitions increases the complexity of regulation, the role of government, and the complexity of understandings, and changes the direction of social evolution.
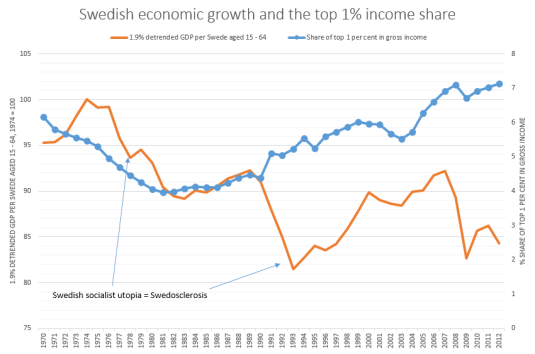
A fall in the share of the top 1% of total Swedish total incomes was in tune with the emergence of a new word in the English language which was Swedosclerosis. That was the long stagnation in the Swedish economy in the 1970s and the 1980s with Swedish economic growth well below that in the trend rate of growth in the USA. Only after an increase in the top 1% share in Sweden did economic growth start recovering to trend.
In the chart above, a flat-line in real GDP per working age Swede is growth at the trend rate of the US economy for the 20th century which was 1.9% per year. A falling line is Swedish growth below trend, a rising line is growth above that trend rate of 1.9% in Sweden. A trend rate of 1.9% is the trend rate of growth currently used by Edward Prescott for the USA in the 20th century.
Zoe Williams is not grumbling about the failed states and predatory government responsible for the last pockets of extreme poverty, but about the inequality from economic progress under capitalism.
China and India escaped from extreme poverty by rejecting socialism.
Just released: new global poverty estimates from 1990-2015 using updated extreme poverty line http://t.co/LxD5q2n6Mg— Laurence Chandy (@laurencechandy) October 04, 2015
China and India received next to no overseas development assistance in their Great Escape from extreme poverty.
There’s been some clear-cut natural experiments such as between Chile and Venezuela and Japan, Hong Kong, Singapore and just about any other developing country in terms of capitalism as the only path to prosperity.
And people say I'm pessimistic! Is this the most important graph on the economic history of the world? HT @MaxCRoserhttp://t.co/pawcLOSadv— Nick Galasso (@vngalasso) June 22, 2015
Why Evolution is True is a blog written by Jerry Coyne, centered on evolution and biology but also dealing with diverse topics like politics, culture, and cats.
In Hume’s spirit, I will attempt to serve as an ambassador from my world of economics, and help in “finding topics of conversation fit for the entertainment of rational creatures.”






Recent Comments