
Charter Schools: 5 Myths in 7 Minutes
21 Jan 2015 Leave a comment
in economics of education, politics - Australia, politics - New Zealand, survivor principle Tags: chartered schools, School choice
Today Parliament commemorates 750th anniversary of first Parliament summoned by Simon De Montfort
21 Jan 2015 Leave a comment
in economic history, politics, Public Choice Tags: British parliament, UK politics
Australia and New Zealand – inequality chart books
20 Jan 2015 Leave a comment
in applied welfare economics, politics - Australia, politics - New Zealand Tags: Leftover Left, poverty and inequlaity, top 1%
| New Zealand | Australia | |
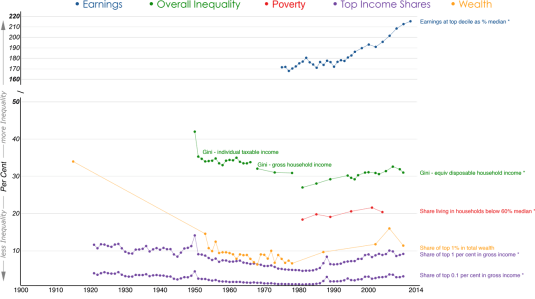
| Has the dispersion of earnings been increasing in recent decades? | Yes, the top decile has risen from 143 per cent of median in 1986 to 186 per cent in 2012. | Yes, top decile of earnings has increased from 175 per cent of median in 1975 to 215 per cent in 2012. |
| Has overall inequality increased in recent years? | No, the Gini coefficient has been relatively stable around 32 percent since 1996. However, it rose by 7 percentage points between 1988 and 1996. | Yes, Gini coefficient has increased by 5 percentage points since 1981. |
| Have there been periods when overall inequality fell for a sustained period? | Yes, from mid-1950s to mid-1970s. | Yes, overall inequality and top shares fell from early 1950s to end of the 1970s. |
| Has poverty been falling or rising in recent decades? | Poverty has substantially increased from 1996 to 2004 before decreasing mildly till 2009. | Risen since 1981. |
| Has there been a U-pattern for top income shares over time? | Yes, top gross income shares fell from mid-1950s to mid-1980s, then rose from mid-1980s to mid-1990s. | Yes, top gross income shares fell from 1921 to around 1980 and then began to rise, reaching pre-war levels before the 2007 crisis. |
| Has the distribution of wealth followed the same pattern as income? | Insufficient evidence. | Yes, the share in total wealth of the wealthiest 1% of the population dropped more than threefold from 1915 to the end of 1970s before rising again till the onset of 2007 crisis. However, the rise was not sufficient to return to pre-war levels of concentration. |
| Additional noteworthy features | U-shape over post-war period. Top income shares estimates for the years 1998, 1999 and 2000 are affected by changes in the income tax laws. Top shares series have a break in 1951 (change in tax units). | Rising inequality on all (observable) dimensions for past thirty years. |
Australia has become more unequal over the past 30 years as compared to New Zealand, but it is also become 30% richer than New Zealand.
Looks like John Rawls was right for the average Australian as compared to the average New Zealander. Australia is a more unequal society but a far richer society because of it, which is a fair deal if Rawls is to be believing.
Figure 1: New Zealand inequality chart book
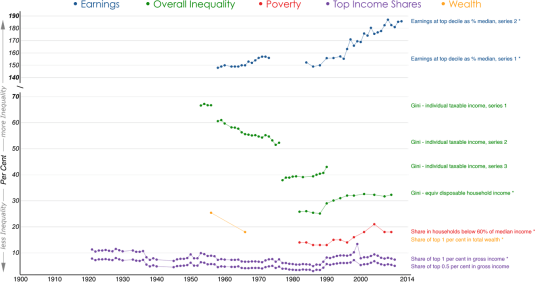
Figure 2: Australian inequality chart book
You are welcome to share but please refer to A. B. Atkinson and S. Morelli (2014) – ‘The Chartbook of Economic Inequality’ at http://www.ChartbookOfEconomicInequality.com
This visualisation is licensed under a Creative Commons BY-NC-SA license, Data visualisation by: Max Roser
The World is Getting Richer…& Much More Equal
20 Jan 2015 Leave a comment
in applied welfare economics, politics - Australia, politics - New Zealand, politics - USA Tags: Leftover Left, Oxfam, Thomas Piketty
Denying Problems When We Don’t Like the Solutions
20 Jan 2015 Leave a comment
in applied welfare economics, politics - New Zealand, politics - USA, Public Choice Tags: advocacy bias, anti-capitalist mentality, Anti-Economics Left, Anti-Science left, expressive voting

There is often a curious distinction between what the scientific community and the general population believe to be true of dire scientific issues, and this skepticism tends to vary markedly across groups.
…What causes such radical group differences? We suggest, as have previous accounts, that this phenomenon is often motivated.
However, the source of this motivation is not necessarily an aversion to the problem, per se, but an aversion to the solutions associated with the problem.
This difference in underlying process holds important implications for understanding, predicting, and influencing motivated skepticism.
In 4 studies, we tested this solution aversion explanation for why people are often so divided over evidence and why this divide often occurs so saliently across political party lines.
Studies 1, 2, and 3—using correlational and experimental methodologies—demonstrated that Republicans’ increased skepticism toward environmental sciences may be partly attributable to a conflict between specific ideological values and the most popularly discussed environmental solutions.
Study 4 found that, in a different domain (crime), those holding a more liberal ideology (support for gun control) also show skepticism motivated by solution aversion.


HT: http://today.duke.edu/2014/11/solutionaversion and http://www.washingtonpost.com/blogs/wonkblog/wp/2014/11/10/conservatives-dont-hate-climate-science-they-hate-the-lefts-climate-solutions/
Media completely missed this report in the lead-up to 2014 election: Rich-poor gap not growing in New Zealand and hasn’t for 20 years
20 Jan 2015 Leave a comment
in applied welfare economics, politics - New Zealand Tags: 2014 New Zealand election, child poverty, Gini coefficient, inequality and poverty, media bias, top 1%
Figure 1: Gini coefficient New Zealand 1980-2015
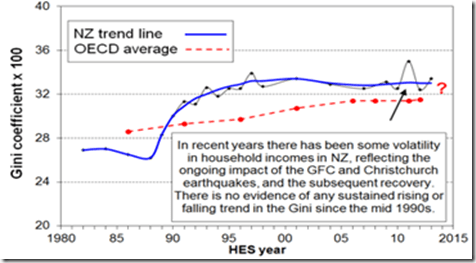
Source: Bryan Perry, Household incomes in New Zealand: Trends in indicators of inequality and hardship 1982 to 2013. Ministry of Social Development (July 2014).
Figure 2: Real household incomes (BHC), changes for top of income deciles, 1994 to 2013

Source: (Perry 2014).
Figure 3: Real equivalised median household income (before housing costs) by ethnicity, 1988 to 2013 ($2013).

Source: (Perry 2014).

HT: http://www.listener.co.nz/current-affairs/new-deal-for-kids/

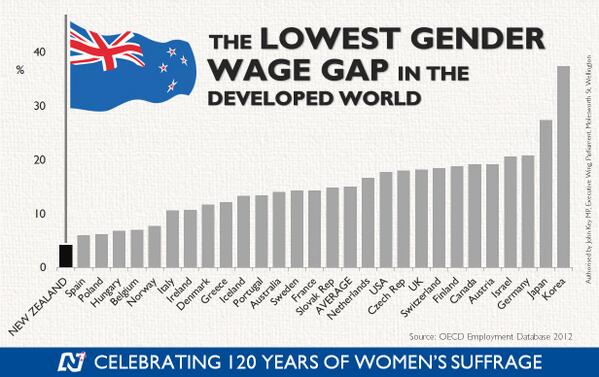
HT: http://i.stuff.co.nz/business/industries/10244667/Rich-poor-gap-not-growing-report
New Zealand – Chartbook of Economic Inequality
20 Jan 2015 Leave a comment
in applied welfare economics, politics - New Zealand, poverty and inequality Tags: Gini coefficient, poverty and inequality, top 1%
| Has the dispersion of earnings been increasing in recent decades? | Yes, the top decile has risen from 143 per cent of median in 1986 to 186 per cent in 2012. |
| Has overall inequality increased in recent years? | No, the Gini coefficient has been relatively stable around 32 percent since 1996. However, it rose by 7 percentage points between 1988 and 1996. |
| Have there been periods when overall inequality fell for a sustained period? | Yes, from mid-1950s to mid-1970s. |
| Has poverty been falling or rising in recent decades? | Poverty has substantially increased from 1996 to 2004 before decreasing mildly till 2009. |
| Has there been a U-pattern for top income shares over time? | Yes, top gross income shares fell from mid-1950s to mid-1980s, then rose from mid-1980s to mid-1990s. |
| Has the distribution of wealth followed the same pattern as income? | Insufficient evidence. |
| Additional noteworthy features | U-shape over post-war period. Top income shares estimates for the years 1998, 1999 and 2000 are affected by changes in the income tax laws. Top shares series have a break in 1951 (change in tax units). |

You are welcome to share but please refer to A. B. Atkinson and S. Morelli (2014) – ‘The Chartbook of Economic Inequality’ at http://www.ChartbookOfEconomicInequality.com
This visualisation is licensed under a Creative Commons BY-NC-SA license Data visualisation by: Max Roser
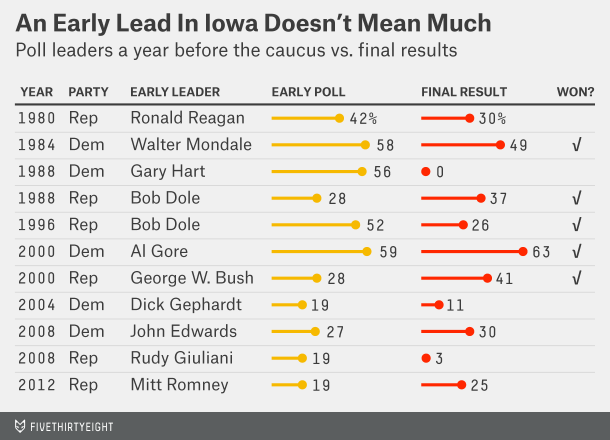
One Year From The Iowa Caucus: What We Know | FiveThirtyEight
19 Jan 2015 Leave a comment
in politics - USA, TV shows Tags: 2016 presidential election
Why there are a wide partisan differences in the USA of the policy priorities
18 Jan 2015 Leave a comment

Cause Célèbre – Gender Split behind Celebrity Charity Work | Information Is Beautiful
18 Jan 2015 Leave a comment
in economics of media and culture, election campaigns, movies, Music, politics - USA, Public Choice, sports economics, televison, TV shows Tags: activists, Celebrities

HT: http://www.informationisbeautiful.net/2014/cause-celebre-gender-split-behind-celebrity-charity-work/
How many children live with their parents?
18 Jan 2015 Leave a comment
in labour economics, politics - Australia, politics - New Zealand, politics - USA Tags: single parenthood


Recent Comments