A taxonomy of 24 authoritarian types
22 Dec 2014 Leave a comment
in liberalism, politics - New Zealand, politics - USA Tags: economics, expressive voting, ideologies, Personality traits

Groucho Marx on evidence-based policy
21 Dec 2014 Leave a comment
in politics, Public Choice Tags: evidence-based policy, Groucho Marx, public choice

History of crude oil prices 1861-2014
21 Dec 2014 Leave a comment
Did the World Bank just solve the puzzle of low NZ growth relative to Australia?
20 Dec 2014 1 Comment
in economic growth, macroeconomics, politics - New Zealand Tags: lost decades
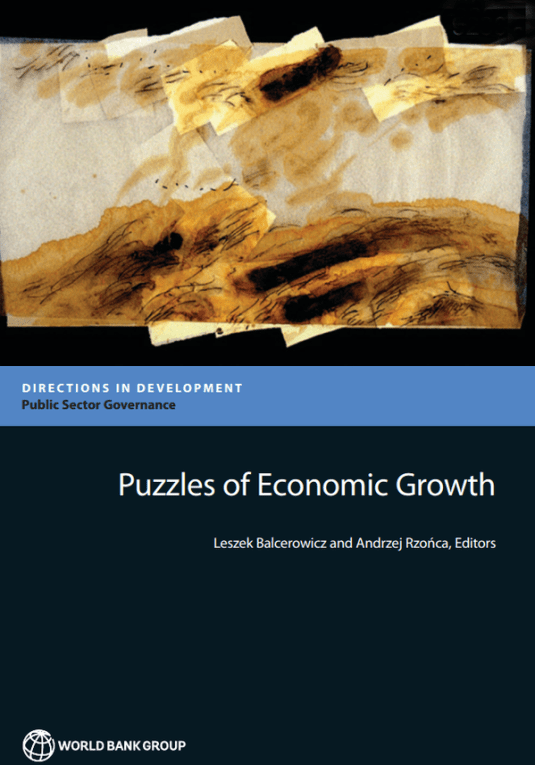
The World Bank published a major 300 odd page report that discussed puzzles of economic growth around the world included a chapter on New Zealand’s slow economic growth relative to Australia.
The World Bank publication is copyrighted 2015, so I assume that it has been published very recently. However, the data analysis in the chapter on New Zealand stop in 2002.
The conclusions of the World Bank with regard to the emergence of the trans-Tasman income gap were as follows:
The extent of economic freedom—as determined by propelling institutions—evolved in a similar manner in both countries.
The small differences in propelling institutions in both countries mostly netted out and as such cannot account for the differences in economic performance.
One exception was the fiscal position of the state—a rise in public expenditure after the first oil crisis entailed increased tax burdens in both countries.
A particularly sharp rise in taxation in New Zealand (in comparison to Australia) occurred during the country’s second downturn.
Differences in the size of the public sector figure prominently in the analysis of the World Bank of the emergence of the trans-Tasman income gap. The measure by the World Bank of the size of the public sector in New Zealand and Australia is reproduced below – its figure 3.3.
Figure 3.3 Government expenditure in Australia and New Zealand, 1970–2002
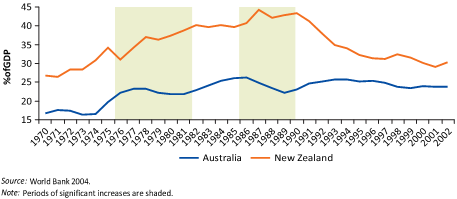
In particular, the World Bank was concerned about the rapid growth in the size of the public sector in New Zealand while the size of the public sector was shrinking in Australia:
In 1977–82 Australia’s government expenditure rose more slowly than that of New Zealand (and in 1975–80 Australia’s expenditure was smaller than New Zealand’s by 13 percent of GDP.
Then, as relative economic growth declined in New Zealand, between 1987 and 1990 public expenditure increased by around 5 percent of GDP from the 1982–86 level. In the meantime, public expenditure in Australia fell by 4 percent of GDP.
As a result, the difference in the general government expenditure level between New Zealand and Australia increased to over 18 percent of GDP in 1987–90.
After 1990 and until 2002 government spending in New Zealand decreased steadily—from approximately 44 percent of GDP in 1990 to roughly 30 percent of in 2002.
In Australia this expenditure was maintained at an average of 25 percent of GDP over the same period (see figure 3.3 with highlighted periods of significant increases of government expenditures in New Zealand).
A spike in the size of state sector in the 1980s may explain a delay in productivity growing rapidly again, but the state sector in New Zealand is now smaller.
Indeed, figure 3.3 above shows that the public sector in New Zealand as measured by general government expenditure has fallen by a quarter in size, by 10 percentage points of GDP in a matter of seven years between 1990 and 1996. There should be rapid growth because of the greatly reduced crowding out by the state sector but that rapid growth is not there.
Figure 2 shows that GDP growth per working age New Zealander resumed at its trend rate of 2% after 1992. This resumption of growth was in conjunction with the decline in the size of public sector tax burden rather than after it. Figure 2 shows that there was no significant growth in real GDP per working age New Zealander from 1974 to 1992. New Zealand lost almost two decades of productivity growth. Real GDP per New Zealander aged 15-64 on a purchasing power parity basis dropped from equality with Australia up until 1974 to a 30 per cent gap by 1992.
Figure 2: Real GDP per New Zealander and Australian aged 15-64, converted to 2013 price level with updated 2005 EKS purchasing power parities, 1956-2012
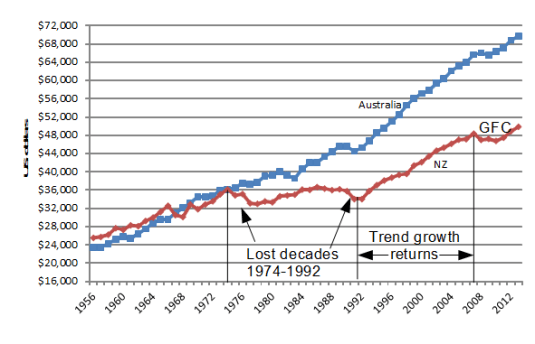
Source: Computed from OECD Stat Extract and The Conference Board, Total Database, January 2014, http://www.conference-board.org/economics
There was no growth rebound when the burden of an oversized public sector was lifted. That is the greater puzzle. The World Bank did not address that greater puzzle. If there is a global pool of useful technological knowledge accessible at a low cost by suitably prepared people, what stops New Zealand from using this knowledge to grow faster until it catches-up with Australia and the USA?
Another puzzle for the World Bank is that it is using general government expenditure estimates by the OECD.
When tax revenue as a percentage of GDP is used to measure the size of the public sector and the burden on private sector initiative, figure 3 shows that the tax burden in the two countries is not that different and is in the low 30% range, not the 40% plus range as is suggested by the general government expenditure data in Figure 3.3.
Figure 3: tax revenue as a percentage of New Zealand and Australian GDP, 1965-2011
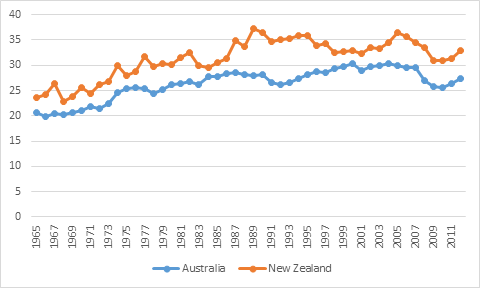
Source: OECD Stats
There are no 14 point gaps in tax burdens in figure 3 as suggested in the World Bank’s analysis. This is because the World Bank’s using general government expenditure shown in its figure 3.3 reproduced above.
A major conclusion about the causes of New Zealand’s poor growth performance in the last few decades should be robust to different measures of the size of the public sector, but it is not.
Economic reforms returned real GDP growth per New Zealander aged 15-64 from no growth from 1974 to 1992 to the previous two per cent trend rate from 1993. There was no sustained productivity growth rebound beyond 2 per cent growth a year for New Zealand to recover the lost ground in the 1980s and 1970s. That is the great puzzle that the World Bank did not address, much less solve.

The rise of the working rich among the top 0.1% in the USA
19 Dec 2014 Leave a comment
in applied welfare economics, economic history, entrepreneurship, politics - USA, poverty and inequality

Source: “Income Inequality in the United States, 1913-1998” with Thomas Piketty, Quarterly Journal of Economics, 118(1), 2003, 1-39
(Tables and Figures Updated to 2012 in Excel format, September 2013) via Chad Jones
Before 1940, most of the income of the top 0.1% of income earners in the USA was income from investments.
By the end of the 20th century, the top 0.1% were earning their incomes as wages and salaries, business incomes and capital gains. Very little of that income of the top 0.1% was in the form of passive income from capital. The top 0.1% of the USA are now working rich – entrepreneurs.
Was Moynihan, right? The role of prospective success in assortative mating in family poverty
19 Dec 2014 1 Comment

What Might Persuade Hillary Clinton Not To Run In 2016 | FiveThirtyEight
19 Dec 2014 Leave a comment
in politics - USA Tags: 2016 US presidential election, Hillary Clinton

How Good Are Jeb’s Chances?
19 Dec 2014 Leave a comment
in politics - USA Tags: 2016 US presidential election
Also note the difference in the voting record and public issue statements of Rand Paul.
There is no front runner in the Republican race at the moment.
I think one of the lesser known candidates will be the eventual winner. Will be neither of Jeb Bush or Rand Paul.

by Dish Staff
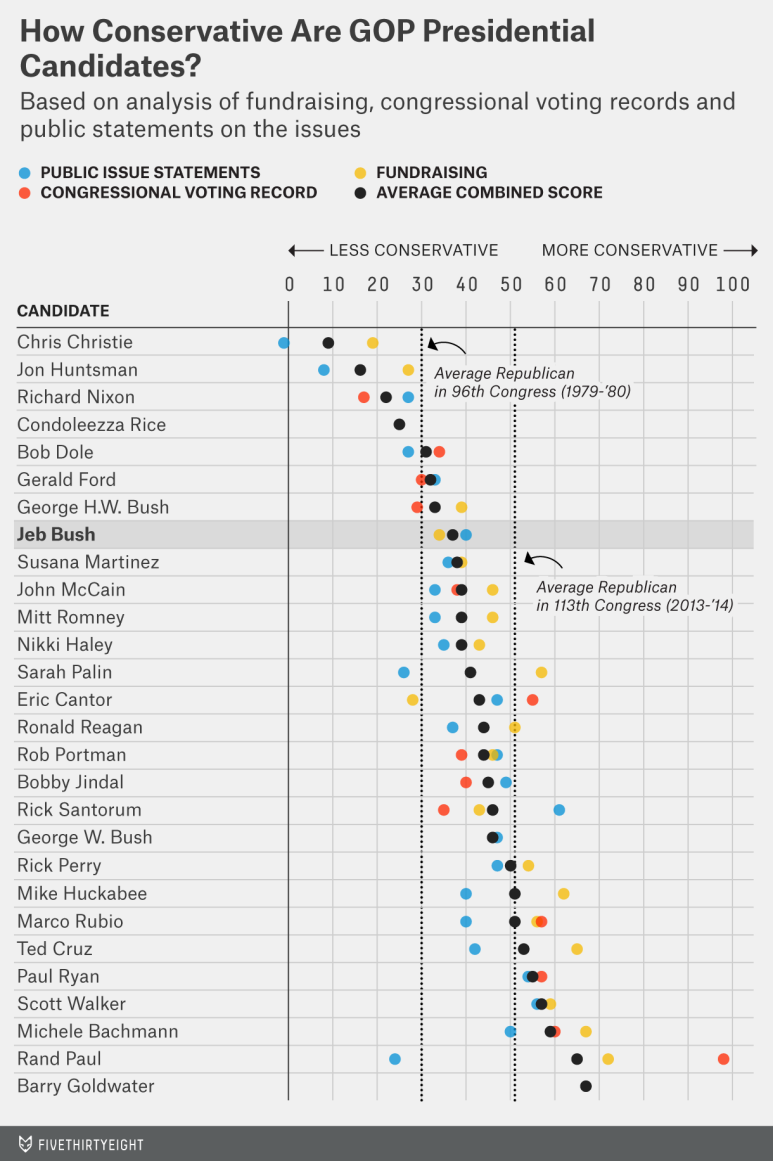
Nate Silver and his team created “ideological scores for a set of plausible 2016 Republican candidates based on a combination of three statistical indices: DW-Nominate scores (which are based on a candidate’s voting record in Congress), CFscores (based on who donates to a candidate) and OnTheIssues.org scores (based on public statements made by the candidate)”:
Bush scores at a 37 on this scale, similar to Romney and McCain, each of whom scored a 39. He’s much more conservative than Huntsman, who rates at a 17.
Still, Bush is more like his father, George H.W. Bush, who rates as a 33, than his brother George W. Bush, who scores a 46. And the Republican Party has moved to the right since both Poppy and Dubya were elected. The average Republican member in the 2013-14 Congress rated a 51 on this scale, more in line with potential candidates…
View original post 863 more words
Men (No Longer) At Work
19 Dec 2014 Leave a comment
in human capital, labour economics, labour supply, politics - USA, population economics
by Dish Staff
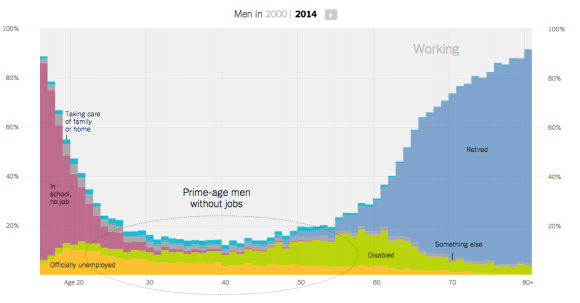
Binyamin Appelbaum looks into the causes of the decline in America’s male work force:
Working, in America, is in decline. The share of prime-age men — those 25 to 54 years old — who are not working has more than tripled since the late 1960s, to 16 percent. … Many men, in particular, have decided that low-wage work will not improve their lives, in part because deep changes in American society have made it easier for them to live without working. These changes include the availability of federal disability benefits; the decline of marriage, which means fewer men provide for children; and the rise of the Internet, which has reduced the isolation of unemployment. …
The resulting absence of millions of potential workers has serious consequences not just for the men and their families but for the nation as a whole. A smaller work force is likely to…
View original post 372 more words
Martin Place, Sydney, 18 December 2014
19 Dec 2014 Leave a comment
in politics - Australia, war and peace
HT: Nick Toonan
The starkness of Cuba’s technology gap, charted
18 Dec 2014 Leave a comment
in development economics, growth disasters, growth miracles, politics - USA, technological progress Tags: Cuba, Elysium
Not much better than north Korea. Elysium was a great movie showing the differences between Cuba and Florida.

The war on drugs: Drug induced mortality rates compared
18 Dec 2014 Leave a comment
in applied welfare economics, comparative institutional analysis, economics of regulation, political change, politics - Australia, politics - New Zealand, politics - USA Tags: drug decriminalisation, marijuana decriminalisation, Portugal, war on drugs


Recent Comments