
More on wages boom after Employment Contracts Act was passed @CloserTogether
23 Dec 2016 Leave a comment

A wages boom followed a surge in corporate profits and the Employment Contracts Act 1993 after 20 years of stagnation
21 Dec 2016 Leave a comment
in economic history, labour economics, politics - New Zealand
Child poverty and top 1% income shares seems to have been stable for 20 years, more or less
21 Dec 2016 Leave a comment
in economic history, politics - New Zealand, poverty and inequality
The madness of the @NZGreens about electric trains
21 Dec 2016 Leave a comment
in environmental economics, environmentalism, politics - New Zealand, transport economics
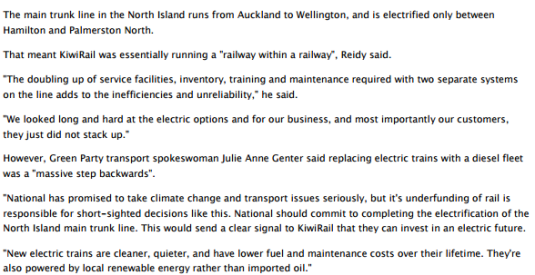
Source: KiwiRail to replace ageing electric train fleet with diesel engines – Business – NZ Herald News.
Crown company results run the gamut
21 Dec 2016 Leave a comment
in economics of bureaucracy, industrial organisation, politics - New Zealand


Myth busting @JulieAnneGenter supports light rail because it’s a good investment!
17 Dec 2016 Leave a comment
in applied welfare economics, politics - New Zealand, transport economics, urban economics

How much does a NZ superannuation eligibility age to 67 save? @nzlabour
13 Dec 2016 Leave a comment
in fiscal policy, politics - New Zealand
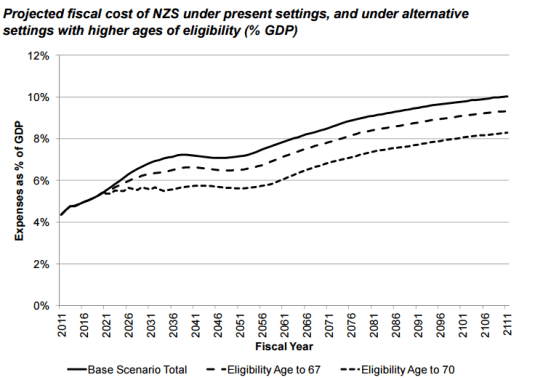
Source: New Zealand Treasury (2013) Long-term fiscal statement.
Is inequality just getting worse and worse in #NewZealand?
23 Nov 2016 Leave a comment
in applied welfare economics, economic history, politics - New Zealand, poverty and inequality

Source: New Zealand Treasury Long-Term Fiscal Projections 2016.

Fossil Fuels: The Greenest Energy
20 Nov 2016 Leave a comment
in economic history, energy economics, politics - Australia, politics - New Zealand, politics - USA Tags: Fossil Fuels

#nzeq Post-disaster labour market adjustment: Alaska in the pipeline era & Darwin after Cyclone Tracy
17 Nov 2016 Leave a comment
in economics of natural disasters, labour economics, labour supply, politics - New Zealand, transport economics, urban economics Tags: Alaska, Cyclone Tracy
Experiences from abroad suggest that labour markets have a history of rapid adaptation to regional surges in construction demand and that workers are prepared to tolerate lower quality housing provided there are compensating wage premiums.
The Trans-Alaska Pipeline was the largest privately funded construction project to that time. Alaskan wages during the building period between 1974 and 1977 were very flexible in the construction and related industries.
Labour supply was responsive in terms of more hours worked per worker and more local workers entering the workforce with many others moved temporarily to Alaska even though the Alaskan climate and culture would not appeal to everyone.
The Alaskan labour force increased by 50%, from about 50,000 to about 90,000 workers, hours worked per week increased by about the same, and many people worked 2 jobs.
High school hours were moved to the morning so that students and their teachers could take an afternoon job in pipeline construction. There is hot beading of accommodation and a 1000% labour turnover rate at the local McDonald’s. By 1979, the Alaskan labour force returned pretty much to its preconstruction era size.
![]()
Moving to a region still prone to after-shocks also would not appeal to everyone. Many energy industry construction projects in modern times were completed in unappealing locations and extreme climates on land and sea.
As another and much nearer example, Cyclone Tracy destroyed about 60 per cent of the 8,000 houses in Darwin on 24 December 1974 and more than 30 per cent were severely damaged. Most of Darwin’s population of 48,000 people became homeless; 71 lives were lost.

After a mass evacuation of 35,000, Darwin’s population was 10,000 by 1 January 1975. Darwin’s population recovered to 30,000 by May 1975. This influx was dominated by newcomers, especially construction workers. Temporary housing, caravans, hotels and an ocean liner were all pushed into service.
When the Darwin Reconstruction Commission was wound up two years ahead of the initial reconstruction timeline on 12 April 1978, 3,000 new dwellings had been completed. By mid-1978, the city could again house its pre-Tracy population numbers. Darwin is now home for about 125,000 people.
The key role of housing costs in disaster recovery @ericcrampton @JordNZ #nzeq
16 Nov 2016 Leave a comment
in applied price theory, economic history, economics of natural disasters, economics of regulation, politics - New Zealand, politics - USA, urban economics Tags: land supply, land use planning, NYMBYs, RMA, zoning
The evidence abroad after earthquakes, hurricanes, flooding, tornados, and wartime bombing is that for growing cities, disasters, including carpet bombing and atomic bombs, are only temporary set-backs with few long-run economic and population consequences. A few years after a disaster, these cities even recover the industries they had before their calamities.

For growing cites, the loss of housing and other destruction does not affect the underlying demand from workers and businesses to be at the location. Florida has prospered despite over twenty hurricanes striking since 1988 and five of the six most damaging Atlantic hurricanes of all time striking since 1988.
Cities that are already in decline drop down onto an even faster downward population and economic trend after a major natural disaster. A large scale destruction of housing takes away the one compensating feature of these declining cities, which was cheap housing.
Housing prices in declining cities are usually well below construction costs. Low living costs partly offset the relative lack of local economic opportunity in these cities. New Orleans is an example of a declining city that did not recover fully from a disaster for this reason.
After Hurricane Katrina, New Orleans had much higher costs of housing because of flood damage but there were limited local economic opportunities to attract back old and new residents. About 20 per cent of the Katrina evacuees did not return.
Natural disasters be they earthquakes or hurricanes turn declining cities and towns from a dump with cheap housing to a dump with expensive housing. They can be a killer blow.
The main policy enabler of growing cities in the USA has been the avoidance of land use regulations that raise housing costs. Over the past 20 years, the fastest growing U.S. regions have not been those with the highest income or most attractive climates.
Flexible housing supply is the key determinant of regional growth. Land use regulations drive housing supply and determine which regions are growing. A regional approach to enabling increases in land and housing supply might reduce the tendency of many localities to block new construction.

Recent Comments