Low Pay Britain? More employees in UK are low paid than in most countries in OECD and Europe resolutionfoundation.org/?post_type=cpt… http://t.co/t2wQQfbRav—
ResolutionFoundation (@resfoundation) October 05, 2015
New Zealand low pay incidence one of lowest in OECD @greencatherine @MaxRashbrooke @nzlabour @dpfdpf
22 Oct 2015 Leave a comment
in applied welfare economics, income redistribution, politics - New Zealand
NZ gender pay gap has closed – at the bottom anyway @YWCAAuckland @SFWU @JanLogie @FairnessNZ @ncwnz
21 Oct 2015 2 Comments
in discrimination, economics of education, gender, human capital, labour supply, politics - New Zealand Tags: Claudia Goldin, gender wage gap, pay equity, Solomon Polachek
Good on you @janlogie, @TraceyMartinMP and Louisa Wall, the next 3 MPs to pledge support at equalpay.org.nz http://t.co/D2rh75VjZx—
SFWU (@SFWU) September 07, 2015
The Auckland YMCA has made some strong claims about the persistence of gender wage gap saying that it is stubbornly stuck at 14% (when measured against average earnings).
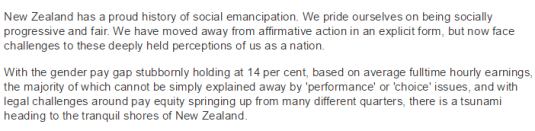
Source: The gender pay gap needs to start closing.
It is not usual to measure the gender wage gap against average earnings. Median earnings preferably on an hourly basis is the normal measure. Moreover, more long-term data is readily available on the Internet about median earnings rather than average earnings.
For example, as the chart below shows the unadjusted gender wage gap in New Zealand is a little bit less than the 14% claimed by Auckland YMCA when measured against median earnings and has been slowly tapering down for 15 years.
Source: Statistics New Zealand New Zealand Income Survey.
My larger claim is the gender pay gap has been in a long-term decline for generations. More importantly, the gender will pay gap is disappeared at the bottom of the labour market. For the past 5 to 10 years, the unadjusted gender wage gap rounds down to zero at the bottom of the pay structure for full-time employees.
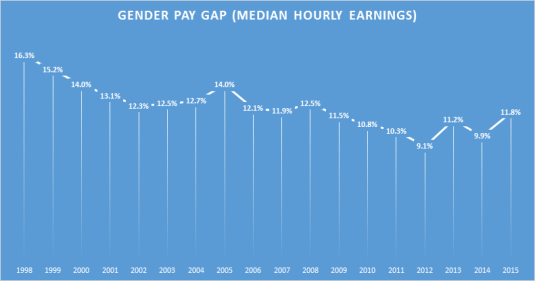
Source: OECD Employment Database.
The gender wage gap remains stubbornly high at the high end of the wage market at 15-20% because of compensating differentials. Women are balancing families and careers in choosing the occupations that best suits each individual woman.
How big is the wage gap in your country? bit.ly/18o8icV #IWD2015 http://t.co/XTdntCRfDQ—
(@OECD) March 08, 2015
Studies of top earning professionals show that they make quite deliberate choices between family and career. The better explanation of why so many women are in a particular occupation is job sorting: that particular job has flexible hours and the skills do not depreciate as fast for workers who take time off, working part-time or returning from time out of the workforce. Low job turnover workers will be employed by firms that invest more in training and job specific human capital.
- Higher job turnover workers, such as women with children, will tend to move into jobs that have less investment in specialised human capital, and where their human capital depreciates at a slower pace.
- Women, including low paid women, select careers in jobs that match best in terms of work life balance and allows them to enter and leave the workforce with minimum penalty and loss of skills through depreciation and obsolescence.
This is the choice hypothesis of the gender wage gap. Women choose to educate for occupations where human capital depreciates at a slower pace. This gender wage gap for professionals can be explained by the marriage market combined with assortative mating:
- Graduates are likely to marry each other and form power couples; and
-
There tends to be an age gap between men and women in long-term relationships and marriages of two years.
This two-year age gap means that the husband has two additional years of work experience and career advancement. This is likely to translate into higher pay and more immediate promotional prospects. Maximising household income would imply that the member of the household with a higher income, and greater immediate promotional prospects stay in the workforce. This is entirely consistent with the choice hypothesis and equalising differentials as the explanation for the gender wage gap. As Solomon Polachek explains:
At least in the past, getting married and having children meant one thing for men and another thing for women. Because women typically bear the brunt of child-rearing, married men with children work more over their lives than married women. This division of labour is exacerbated by the extent to which married women are, on average, younger and less educated than their husbands.
This pattern of earnings behaviour and human capital and career investment will persist until women start pairing off with men who are the same age or younger than them.
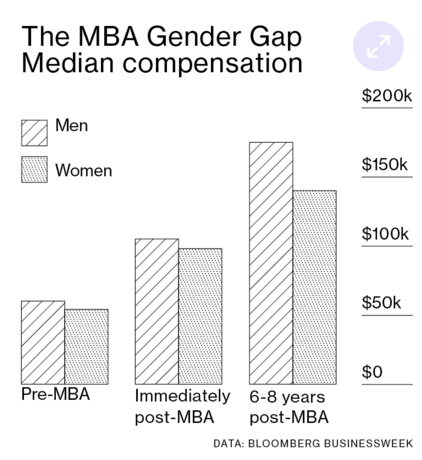
Claudia Goldin did a great study of Harvard MBAs using online surveys of their careers. She found that three proximate factors accounted for the large and rising gender gap in earnings:
- differences in training prior to MBA graduation,
- differences in career interruptions, and
- differences in weekly hours.
The greater career discontinuity and shorter work hours for female MBAs are largely associated with motherhood. There are some jobs that are severely penalise any time out of the workforce. A 2014 Harvard Business School study found that 28 percent of recent female alumni took off more than six months to care for children; only 2 percent of men did.
Claudia Goldin has described pharmacy is the most family friendly occupation. She compares it to law. In law, if you work long hours, you are on partnership track and win the top clients. In pharmacy, the only advantage of working longer hours as you earn more money that week. Also, pharmacists are completely interchangeable. Do you care which pharmacist fills out your prescription at your local pharmacy or even know which one fills it out? Lawyers are not interchangeable: they cannot just handover a case. Detailed briefings would be required. You expect your lawyer to show up in court or at meetings on time anywhere without fail.

Claudia Goldin found one counterfactual that cancels out the gender wage gap amongst MBA professionals: hubby earns less! Female MBAs who’ve have a partner who earn less than them earn as much as the average MBA professional on an hourly basis but work a few less hours per week.
The gender wage gap is persisted in high-paying jobs because career women have so many options. They can mix and match career and motherhood in fine detail.
In low-paying jobs, there is little in the way of trade-offs other than full-time or part-time work. Low-paid jobs do not involve choosing majors at university, choosing careers, industries and employers that call for long hours and uninterrupted careers or not so long hours, fewer human capital and promotional penalties for time off and more work-life balance.
The choice hypothesis is the far better explanation for the persistence of the unadjusted gender wage gap in New Zealand, which is small by international standards. As Polachek explains:
The gender wage gap for never marrieds is a mere 2.8%, compared with over 20% for marrieds. The gender wage gap for young workers is less than 5%, but about 25% for 55–64-year-old men and women.
If gender discrimination were the issue, one would need to explain why businesses pay single men and single women comparable salaries. The same applies to young men and young women. One would need to explain why businesses discriminate against older women, but not against younger women. If corporations discriminate by gender, why are these employers paying any groups of men and women roughly equal pay?
Why is there no discrimination against young single women, but large amounts of discrimination against older married women? … Each type of possible discrimination is inconsistent with negligible wage differences among single and younger employees compared with the large gap among married men and women (especially those with children, and even more so for those who space children widely apart)
The main drivers of the gender wage gap are unknown to employers such as whether the would-be recruit or employer is married, their partner is present, how many children they have, how many of these children are under 12, and how many years are there between the births of their children.
In countries such as Sweden, the gender wage gap is no better than the OECD average, despite generous maternity and paternity leave. The reason is obvious. You do not close the gender wage gap for professional women by paying them to stay out of the workforce for a year or more perhaps several times over at critical junctures early in their careers.
Long parental leave in Sweden is responsible for a thick Swedish glass ceiling because of lower levels of human capital investment among women and employers’ responses by placing fewer women in fast-track career. Extensive parental leave makes holding a job easier and more family-friendly, it may not be as effective as some might think in eradicating the gender gap for professional women.
Property purchases by buyer type – Auckland
20 Oct 2015 Leave a comment
in politics - New Zealand, urban economics
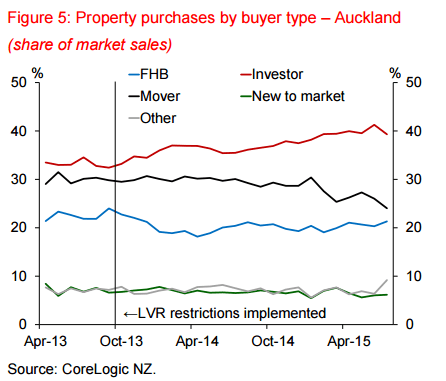
Source: A deeper look at recent housing market trends: insights from unit-record data Hayden Skilling, Reserve Bank of New Zealand (October 2015).
Tertiary education premium by gender in the English-speaking countries, 2012
19 Oct 2015 1 Comment
in discrimination, economics of education, gender, human capital, labour economics, occupational choice, politics - Australia, politics - New Zealand, politics - USA Tags: Australia, British economy, Canada, College premium, education premium, gender wage gap, Ireland, New Zealand, reversing gender gap
There are large differences in the education premium between English speaking countries and also by gender. The tertiary premium in New Zealand is pretty poor compared to the USA, UK or Ireland and is still mediocre when compared to Australia and Canada.

Source: Education at a Glance 2014.
Taxation as a % of GDP in Australia and NZ and New Zealand’s Lost Decades
18 Oct 2015 1 Comment
in applied price theory, applied welfare economics, economic growth, economic history, politics - New Zealand, public economics
Revenue is a percentage of GDP has always been higher in New Zealand as compared to Australia for as far back as data is available. Tax revenue grew by a third as a percentage of GDP between 1965 and 1989 in New Zealand with a sharp spike from 1984 onwards. The growth in tax revenues as percentage of Australian GDP was smoother rather than spikes such as in the mid-1980s in New Zealand.
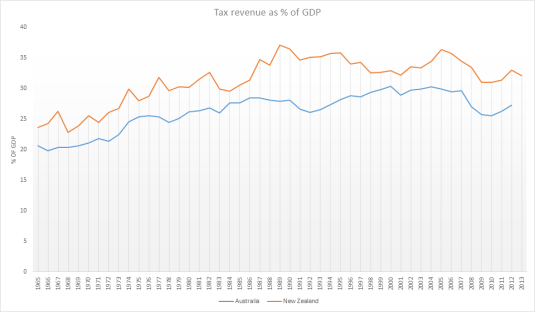
Data extracted on 18 Oct 2015 02:10 UTC (GMT) from OECD.Stat.
Interestingly, this faster growth in the New Zealand tax revenues as a percentage of GDP coincided with the two lost decades of New Zealand growth between 1974 and 1992. Furthermore, the chart below shows that an emerging recovery in labour productivity in the early 1980s stalled when tax revenues started growing again as a percentage of New Zealand GDP.
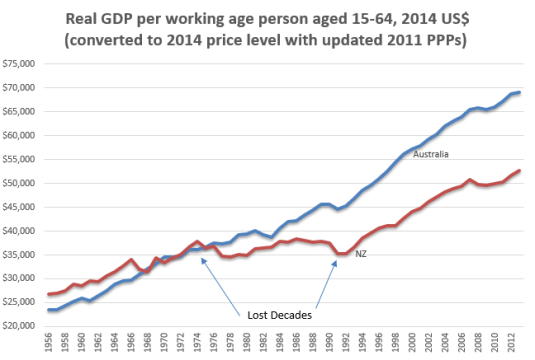
Source: Computed from OECD StatExtract and The Conference Board. 2015. The Conference Board Total Economy Database™, May 2015, http://www.conference-board.org/data/economydatabase/
Between 1974 and 1992, New Zealand lost 34% and productivity against trend of 1.9%. In the chart below, a flat line is growth at a rate equal to the trend rate of growth for the USA in the 20th century which is 1.9%. A falling line indicates growth at less than 1.9% for the year. A rising line means growth in excess of 1.9% for the year. The chart below confirms what the chart above says. Productivity stopped falling in the early 1980s then started falling rapidly at the same time that tax revenues spiked as percentage of GDP in the early 1980s.
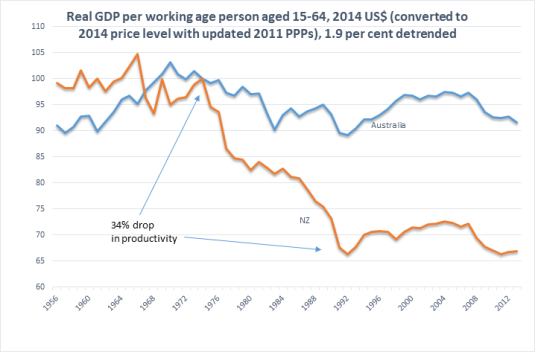
Source: Computed from OECD StatExtract and The Conference Board. 2015. The Conference Board Total Economy Database™, May 2015, http://www.conference-board.org/data/economydatabase/
in the above chart, Australia had pretty steady growth since about 1970. There is a productivity slowdown in the 1970s and above-average growth as the economy recovered from the Keating recession in the early 1990s. The so-called mining boom is hardly noticeable in Australia’s trend growth rate.
@GreenpeaceNZ @jamespeshaw The Futility and Farce of Global Climate Negotiations @RichardTol
18 Oct 2015 Leave a comment
in constitutional political economy, development economics, economics of bureaucracy, environmental economics, environmentalism, global warming, growth disasters, growth miracles, international economics, politics - Australia, politics - New Zealand, politics - USA, Public Choice, rentseeking Tags: bootleggers and baptists, climate alarmism, expressive voting, free-riders, global warming, green tariffs, international public goods, Leftover Left, New Zealand Greens, Twitter left
It is time for the environmental movement to face up to the fact that there never will be an international treaty to restrain carbon emissions. The practical way to respond to global warming is healthier is wealthier, richer is safer. Faster economic growth creates more resources for resilience and adaptation to a changing environment.

NEW REPORT: The Futility and Farce of Global Climate Negotiations bit.ly/1LvFFv3 http://t.co/TwbFUwaPlm—
Manhattan Institute (@ManhattanInst) October 17, 2015
India's target compared to its recent history http://t.co/pIvwhoSTpL—
Richard Tol (@RichardTol) October 02, 2015
@AndrewLittleMP @jamespeshaw @BillEnglishMP Real housing prices New Zealand, Australia & USA: 1975 January quarter – 2015 June quarter
17 Oct 2015 Leave a comment
in economic history, economics of regulation, politics - Australia, politics - New Zealand, politics - USA, rentseeking, urban economics Tags: green rentseeking, housing affordability, land supply, New Zealand Greens, New Zealand Labour Party, RMA
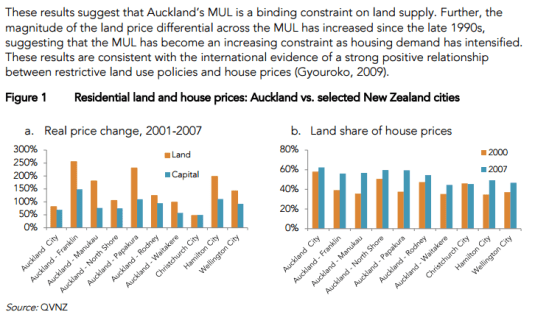
mg src=”https://utopiayouarestandinginit.com/wp-content/uploads/2015/10/101715_0817_andrewlittl1.png” alt=”” />
Source and notes: International House Price Database – Dallas Fed June 2015; nominal housing prices for each country is deflated by the personal consumption deflator for that country.
New Zealand housing prices were pretty stable until the passage of the Resource Management Act in 1993. After that, prices took off New Zealand and didn’t slow that much for the recession subsequent to the Global Financial Crisis.
American prices just had a bubble because of loose monetary policy by the Fed and loose lending criteria by banks at the behest of regulators. Real housing prices in the USA started to rise again last year after a dramatic fall.
Australian prices were rising steadily until about 2000 but then took off with a strong economy and the usual restrictions on land supply by local governments at the behest of the existing homeowners.
@nzlabour @metiria It’s impossible to build affordable housing
17 Oct 2015 2 Comments
in applied price theory, economics of regulation, politics - New Zealand, Public Choice, rentseeking, urban economics Tags: land supply, land use planning, New Zealand Greens, New Zealand Labour, RMA, zoning
The Labour Party and the Greens both plan to build 100,000 affordable houses as a way of offsetting soaring housing prices in Auckland and other New Zealand cities. These plans were announced in the 2014 Election in New Zealand.
A trite but insurmountable objection to the proposal to build 100,000 affordable houses is there are no plans to increase the supply of land. That would require RMA reform which both Labour and the Greens oppose. They oppose RMA reform partly for ideological reasons and partly to cultivate middle-class home owner votes.
Unless there is an increase in the supply of land in Auckland and the other New Zealand cities, the government under the plans of the Labour Party and the Greens are building houses the private sector would have built anyway but for the government bought from the same new supply of land released every year by local councils.
The proposals of Labour and the Green to build affordable houses simply changes the identity of who builds the same number of new houses in New Zealand. There is no net increase in this supply of houses so there will not be any improvement in housing affordability.
If the supply of land were to be increased through RMA reforms, there be no need to for the government to build the houses. This is because the market will take care of building the houses on the additional land released by local councils if there is a demand for them and they’re obviously is.
Attempts by a Labour and Green Government to build affordable houses is no more than displace the efforts of private developers to supply houses but in configurations more closely aligned with market demand in terms of the quality and size of the house.
Another insurmountable but still minor objection to supplying 100,000 affordable houses is Friedman’s second law of economics: you can’t give anything away for free because people will queue up for access.
If the government is selling cheap houses to ordinary families, people change that circumstances to make themselves more eligible for the house, which presumably will be targeted by income. Easiest way to do that is to fund a low income family member such as a student to buy the house and sell it to you. Alternatively, you could make an advanced of them against their inheritances as a way of them buying a house.
The classic New Zealand example of the inability to give anything away for free was the introduction of school zoning. People now pay hundreds of thousands of dollars more for a house if it is in a favourable school zone.
A more serious objection that can never be overcome is as soon as the lucky ordinary family buys the affordable house, they will renovate it to the proper standing reflecting the underlying value of the land. Affordable houses under the plans of the New Zealand Labour Party and the Greens is to build a cheap house on expensive land in Auckland. Land in Auckland is 60% of the price of a house. Land use to be 40% of the value of the house in Auckland.
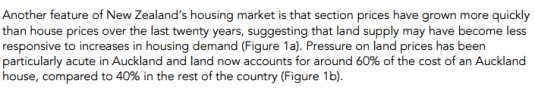
Source: New Zealand Productivity Commission (2013).
Plenty of people are in the game of home renovation; some do it as a full-time occupation. They buy an old rundown house on good land and a good location and renovate the house to match the value of the underlying land and location.
The possibility of subsequent renovation to the cheap house on the good land is the death knell of any attempt to sell affordable housing in Auckland or the other New Zealand cities where house prices are spiralling upwards because of restrictions on the supply of land.
Building 100,000 affordable houses were simply present 100,000 renovation opportunities to entrepreneurs. The families who are lucky enough to be first to buy the affordable house will get a marvellous windfall. There will be no long-term impact on the price of land in Auckland because you can’t give anything away for free. Any undervalued good as quickly resold at a profit by budding entrepreneurs after renovating the house to bring it up to market standard given the value of the underlying land.
If the Labour Party and the Greens want more affordable housing, they must support RMA reforms that will increase the supply of land. They won’t do out of sheer political expediency. Labour and the Greens want to win the votes of disgruntled National party voters who already own homes.
Kelvin Davis @NgatiBird wants @AndrewLittleMP job?
17 Oct 2015 Leave a comment
in politics - New Zealand, Public Choice
Action speaks louder than words in the eyes of the voters who might vote for Labour in the 2017 New Zealand General Election. Kelvin Davis clearly is leadership material.
@NgatiBird about to talk to @TheNationTV3 at Perth airport, about to head to Xmas Island on fact finding mission http://t.co/eLSHoQrLqY—
Brook Sabin (@BrookSabin) October 16, 2015
kelvin Davis talking human rights advocate & family outside Villawood. #advocacy #politics #labour NZers need help http://t.co/MesWFFSbOq—
Jodi Ihaka (@JodiIhaka) October 16, 2015
Oppressed by randomness
16 Oct 2015 Leave a comment
Legalize All Drugs by Jeff Miron
16 Oct 2015 Leave a comment
in economics of crime, economics of regulation, law and economics, liberalism, politics - Australia, politics - New Zealand, politics - USA Tags: Jeff Morin, marijuana decriminalisation, war on drugs
An American President on what @nzlabour @NZGreens have become (on housing affordability and trade and investment)
15 Oct 2015 Leave a comment
in politics - New Zealand, Public Choice, rentseeking Tags: American President, expressive voting, New Zealand Greens, New Zealand Labour, rational ignorance, rational irrationality
% of public cash benefits paid to the bottom income quintile, USA, UK, Australia and New Zealand – corrected
15 Oct 2015 Leave a comment
in applied welfare economics, politics - Australia, politics - New Zealand, politics - USA, poverty and inequality
Australia does far better than any other country in targeting its welfare state to the bottom of the income distribution. Having an old age pension that is asset tested and income tested has a lot to do with that. New Zealand has an old age pension that is not income tested or asset tested. The USA has a contributory social insurance system that also ensures a considerable amount of its public social benefits are paid to the well off because they paid in Social Security taxes.
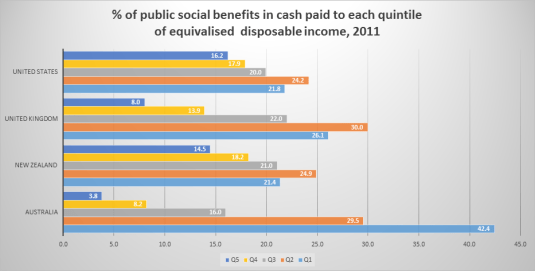
Source: OECD Income Distribution database, via http://oe.cd/idd
@janlogie The dramatic closing of the gender pay gap at the 10th percentile in the US, UK, Australia and NZ since 1970 but not at the 90th percentile!
15 Oct 2015 4 Comments
in discrimination, economic history, gender, human capital, labour economics, politics - Australia, politics - New Zealand, politics - USA Tags: asymmetric marriage premium, compensating differentials, gender wage gap, marriage and divorce
It seems that the top 10% of men are so busy oppressing the top 10% of women that they forgot to keep up the violence inherent in the capitalist system against the bottom 10% of women. The gender pay gap at the bottom of the economic strata closed quite dramatically and consistently since 1970 or as far back as data was available in Australia, New Zealand, the UK and USA. Much of the closing of the gender pay gap for the low-paid was under the scourge of Reagan, Thatcher, Hawke and Keating and Rogernomics.
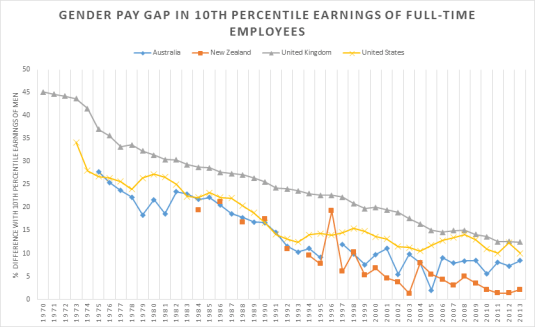
Source and Notes: OECD Employment Database. The gender gap plotted below is unadjusted. It is calculated as the difference between the 10th percentile earnings of men and the 10th percentile earnings of women relative to the 10th percentile earnings of men. Estimates of earnings used in the calculations refer to gross earnings of full-time wage and salary workers. However, this definition may slightly vary from one country to another.
By comparison to this dramatic liberation of women from the gender pay gap at the bottom, the gender pay gap for full-time employees has not really tapered down that much at the top of the income distribution and has been pretty flat for coming on 20 years. It seems the class war is over and has been won by women at the bottom but not at the top?
Younger, more educated women delay having families and can earn as much as their partners. bit.ly/1jw98Ky http://t.co/BaDIlBIBA2—
Ninja Economics (@NinjaEconomics) October 14, 2015
Rather than up the workers, the battle cry of the Posh Trots is up the managers, liberate them from insidious pay inequities imposed upon them by a vast sexist conspiracy of male managers.
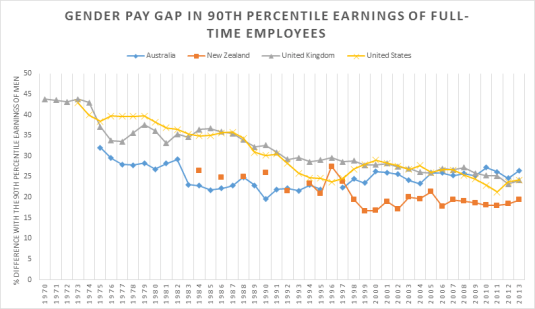
Source and Notes: OECD Employment Database. The gender gap plotted below is unadjusted. It is calculated as the difference between the 10th percentile earnings of men and the 10th percentile earnings of women relative to the 10th percentile earnings of men. Estimates of earnings used in the calculations refer to gross earnings of full-time wage and salary workers. However, this definition may slightly vary from one country to another.
This failure to close the gender pay gap at the top requires more investigation. The available of reliable contraceptives in the late 1960s led to an explosion of investment by women in long duration professional education and in careers where absences because of motherhood in their 20s and 30s was penalised in terms of human capital depreciation and promotional opportunities.

The reason for the endurance of the gender pay gap at the top of the income distribution is compensating differentials. Women at the top were able to have it all.

Professional women could invest in a career and a family and mix-and-match according to their own preferences for career and family and timing of births rather than the preferences of others who looked upon them as some sort of pathfinder for their gender. It is at the top of the income distribution where short absences from the workplace can has very large consequences for wages and promotion.
How @MaxRashbrooke showed housing costs is the main driver of poverty when trying to argue rising inequality was not driven by housing costs
13 Oct 2015 Leave a comment
in applied welfare economics, economics of regulation, politics - New Zealand, poverty and inequality, Rawls and Nozick, rentseeking, urban economics
Rashbrooke then goes on to discuss how housing costs were not a main driver of the growing gap between the top 10% and the bottom 10% of the income distribution in New Zealand. My point is he is more concerned with the politics of envy than with building political support for action against poverty.
What children say about poverty #childpovertynz #itsnotchoice http://t.co/vYfxTn7aG7—
Child Poverty NZ (@povertymonitor) September 07, 2015
Rashbrooke showed that the main driver of poverty in New Zealand is rising housing costs. That is easy to redress but for the opposition of the left-wing parties to reforms to the Resource Management Act that will increase the supply of land and thereby drive down housing costs and rents.
Children's views on poverty #childpovertynz occ.org.nz/assets/Uploads… http://t.co/wZHJ19QcpN—
Child Poverty NZ (@povertymonitor) September 08, 2015
Housing costs gobbled up much of the rising incomes of the poor for many years now in New Zealand as Rashbrooke showed today. The New Zealand Labor Party and New Zealand Greens are doing nothing about it. The regulatory constraints on the supply of land could be gone by lunchtime if the self-proclaimed champions of the poor and social justice supported the reform of the RMA.
The proposals of the New Zealand Labour Party and Greens for the government to build more houses is pointless unless there is more land is supplied. If there is no increase in land supply, all the building of more houses by government does is build the same houses of private developers would have built on the same fixed supply of land. There must be an increase in the supply of land to drive housing costs down for the poor.


Recent Comments