Nearly one in six New Zealand children live in workless households
04 Dec 2015 Leave a comment
in labour supply, politics - New Zealand, poverty and inequality, welfare reform
Electricity and gas prices doubled since 2000 @charles_finny @MatthewHootonNZ
04 Dec 2015 Leave a comment
in economic history, energy economics, environmental economics, politics - New Zealand
Auckland, Wellington and Canterbury housing costs to income ratios since 2007
04 Dec 2015 Leave a comment
in economic history, politics - New Zealand, urban economics
Energy consumption in New Zealand
04 Dec 2015 Leave a comment
in economic history, energy economics, environmental economics, politics - New Zealand
Trade union membership, USA, UK, Australia & New Zealand since 1960 @FairnessNZ
04 Dec 2015 2 Comments
in labour economics, politics - Australia, politics - New Zealand, politics - USA, unions Tags: union membership, union power
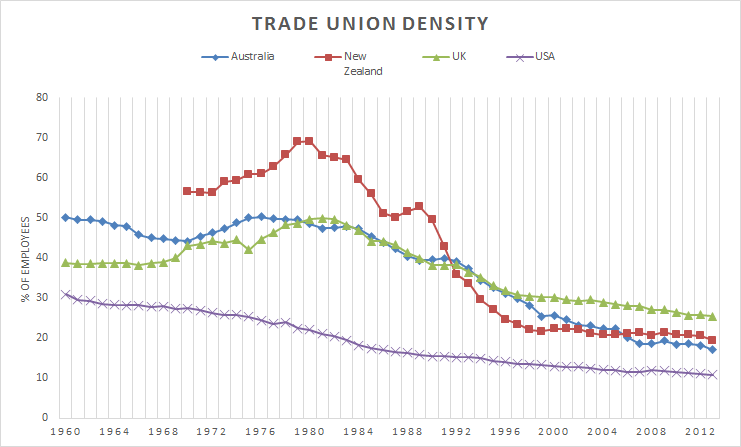
Union membership was in a long-term decline in New Zealand before the passage of the hated Employment Contracts Act in 1991. If anything, union membership stopped falling after the passage of that law.
Source: OECD Stat.
As for the other countries, steady decline in membership has been the trend since 1980. The already low level of union membership in the USA has been in a steady decline since at least 1960.
Cut drug lags with Free To Choose Medicine @annetterongotai @dbseymour @PeterDunneMP
03 Dec 2015 Leave a comment
in economics of regulation, health economics, politics - New Zealand, politics - USA, Sam Peltzman
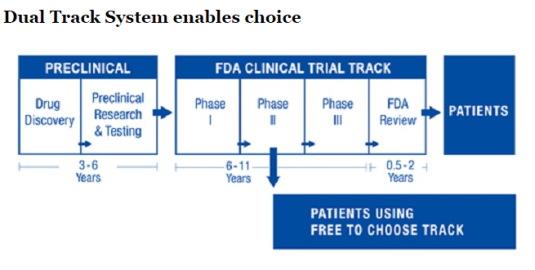
Bart Madden and Vernon Smith outlined a brilliant proposal charted above to shorten lags in the availability of life-saving medicine based on reforms in Japan:
Recently, Japanese legislation has implemented the core FTCM [Free to Choose Medicine] principles of allowing not-yet-approved drugs to be sold after safety and early efficacy has been demonstrated; in addition, observational data gathered for up to seven years from initial launch will be used to determine if formal drug approval is granted. In order to address the pressing needs of an aging population, Japanese politicians have initially focused on regenerative medicine (stem cells, etc.).
Source: Give The FDA Some Competition With Free To Choose Medicine – Forbes via A Dual-Track Drug Approval Process.
This process would release the relevant data behind the drug including its clinical trials on a web portal so that patients and their doctors can work out whether a new drug is suitable to them given their genetic markers. Madden and Smith explain the operation of the web portal for Free to Choose Medicine (FTCM) as follows:
Doctors would be empowered to use their medical knowledge and in-depth knowledge of their patients similar to how they decide on off-label use for approved drugs, i.e., for uses that the FDA has neither tested nor approved but, in the opinion of doctors, are likely to be beneficial to patients. To gain early access, patients would purchase the drug from developers and consent to doctor and developer immunity from lawsuits except in the case of gross negligence or willful misconduct.
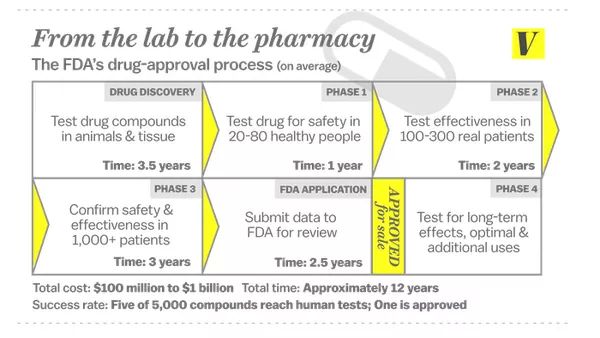
Off label use of medicines arises because the current Food and Drug Administration (FDA) process for drug approval has several phases. Phase 1 tests for the safety of the drug. Later phases are about whether the drug has its predicted effects. That should not be a concern of the FDA or its superfluous New Zealand equivalent Medsafe.
If a new drug isn’t better than the existing competition, that’s a problem for its investors for backing the wrong horse. It’s up to its investors and potential buyers to work out for themselves whether a new drug is more effective than the existing options. That’s a commercial decision, not a decision from regulators.
https://twitter.com/Carolynyjohnson/status/667696845615968257
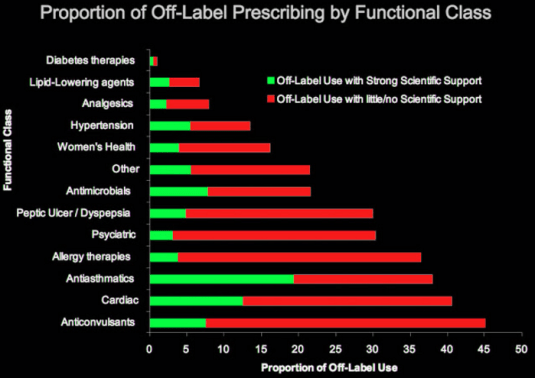
Once a drug is approved by the FDA for particular uses, doctors and researchers often discover that a drug has other clinical applications.
Source: Pharma Marketing Blog
Rather than go through another round of FDA approvals, doctors simply prescribe that drug despite the fact it is not approved by the FDA for that particular clinical use. This is what is called off label prescription.
A number of US states have passed hopelessly unconstitutional Right to Try legislation that authorises the prescription of new drugs not approved by the FDA.
The Free to Choose Medicine proposal is similar to Right to Try legislation. Free to Choose Medicine would allow doctors to make their own prescription choices for their patients as long as the new drug has been shown to be safe. That is, it has passed Phase 1 of the FDA drug approval process. Phase 1 is about drug safety.
In 1962, an amended law gave the FDA authority to judge if a new drug produced the results for which it had been developed. Formerly, the FDA monitored only drug safety. It previously had only sixty days to decide this. Drug trials can now take up to 10 years.
https://twitter.com/MaxCRoser/status/627581135355310080
Sam Peltzman showed in a famous paper in 1973 that the 1962 amendments to US Federal drug approval laws reduced the introduction of effective new drugs in the USA from an average of forty-three annually in the decade before the 1962 amendments to sixteen annually in the ten years afterwards. No increase in drug safety was identified.

Peltzman found that the unregulated market quickly weeded out ineffective drugs prior to the 1962 law change in the USA. The sales of ineffective new drugs declined rapidly within a few months of their introduction.
Doctors stop prescribing medicines that don’t work. Patients complain quickly about medicines that don’t work. What matters is they had the chance to try this drug.

If economists have a bitter drinking song, a battle cry that unites the warring schools of economic thought all, it would be “how many people has the FDA killed today”. Many drugs became available years after they were on the market outside the USA because of drug approval lags at the FDA. The dead are many. To quote David Friedman:
In 1981… the FDA published a press release confessing to mass murder. That was not, of course, the way in which the release was worded; it was simply an announcement that the FDA had approved the use of timolol, a ß-blocker, to prevent recurrences of heart attacks. At the time timolol was approved, ß-blockers had been widely used outside the U.S. for over ten years. It was estimated that the use of timolol would save from seven thousand to ten thousand lives a year in the U.S. So the FDA, by forbidding the use of ß-blockers before 1981, was responsible for something close to a hundred thousand unnecessary deaths.
Free to Choose Medicine is an excellent way to break the regulatory deadlock over drug lags. Free to Choose Medicine should be adopted in New Zealand. Any new drug that has passed the phase 1 drug safety part of regulatory approval processes in any one of the USA, UK, Australia, Canada or Germany should be lawful to prescribe in New Zealand. New drugs should not have to go through the superfluous processes of Medsafe.

The existing drug regulatory regime is based upon making the drug safe for the average patient. That has been swept aside by pharmaceutical innovation as Madden and Smith explain:
Today’s world of accelerating medical advancements is ushering in an age of personalized medicine in which patients’ unique genetic makeup and biomarkers will increasingly lead to customized therapies in which samples are inherently small. This calls for a fast-learning, adaptable FTCM environment for generating new data.
In sharp contrast, the status quo FDA environment provides a yes/no approval decision based on statistical tests for an average patient, i.e., a one-size-fits-all drug approval process. In a FTCM environment, big data analytics would be used to analyze TEDD [Tradeoff Evaluation Drug Database] in general and, in particular, to discover subpopulations of patients who do extremely well or poorly from using a FTCM drug.
@GarethMP @GreenpeaceNZ want to defile a category 1 historic place @NZGreens
03 Dec 2015 Leave a comment
in energy economics, environmental economics, politics - New Zealand Tags: Big Solar, expressive voting, historic places, solar power

Source: Wellington City Council district plan.
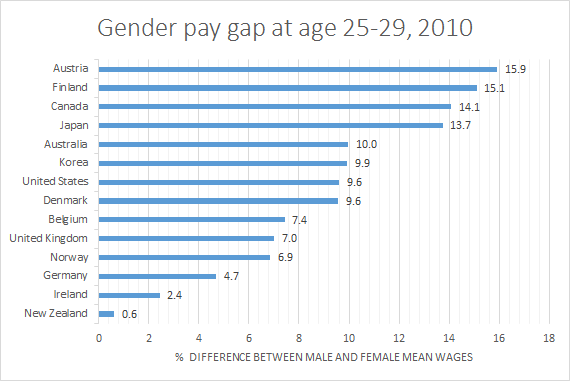
Gender pay gap at age 25-29, OECD countries @GreenCatherine
03 Dec 2015 Leave a comment
in discrimination, gender, human capital, labour economics, labour supply, politics - Australia, politics - New Zealand, politics - USA Tags: compensating differentials, gender wage gap, labour demographics
The gender pay gap in New Zealand rounds down to zero for women in their mid-20s!
@NYTimeskrugman nails urban inequality @PhilTwyford @metiria
01 Dec 2015 Leave a comment
in economics of regulation, politics - New Zealand, urban economics

Source: Inequality and the City – The New York Times via Krugman: Deregulate Housing, David Henderson | EconLog | Library of Economics and Liberty.
Australian and New Zealand detrended real GDP growth, PPP, 1956 – 2014
01 Dec 2015 Leave a comment
in economic growth, economic history, macroeconomics, politics - Australia, politics - New Zealand
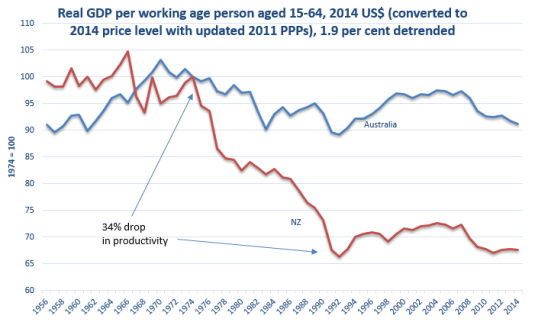
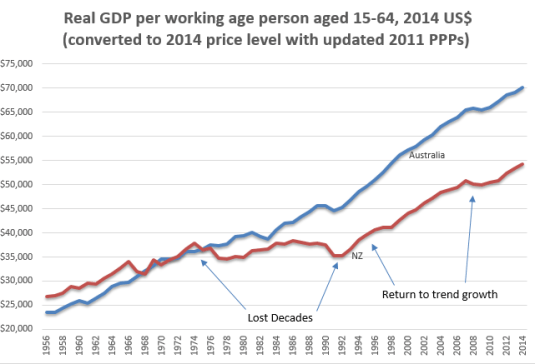
I have updated my estimates of Australian and New Zealand detrended real GDP growth for the 2014 working age population statistics from the OECD. The charts show:
- the lost decades of New Zealand growth between 1974 and 1992;
- the return of trend growth between 1992 and 2007 but no rebounding to recover lost ground;
- the effects of the global financial crisis in Australia and New Zealand; and
- a return to trend growth in New Zealand since about 2010 but not in Australia.
Source: Computed from OECD Stat Extract and The Conference Board. 2015. The Conference Board Total Economy Database™, May 2015, http://www.conference-board.org/data/economydatabase/
The real GDP data in the above chart is detrended by 1.9% per annum. 1.9% growth per year is the trend real GDP growth rate of the USA in the 20th century. The growth rate of the USA is taken as the growth rate of the global technological frontier. A flat line in the above chart is real GDP growth at 1.9% per year. A falling line is real GDP growth in that year of less than 1.9%; a rising line is growth that is greater than 1.9% in that year.
Source: Computed from OECD Stat Extract and The Conference Board. 2015. The Conference Board Total Economy Database™, May 2015, http://www.conference-board.org/data/economydatabase/
@BillEnglishMP why no SOEs portfolio report for 2 years @TaxpayersUnion @JordNZ
01 Dec 2015 1 Comment
in applied price theory, economics of bureaucracy, industrial organisation, politics - New Zealand
For some months now I’ve been trying to ascertain the latest performance of the state owned enterprises (SOE) portfolio. The last Crown Portfolio Report was issued in December 2013. That was two long years ago. I therefore asked for access to the quarterly report on the Crown commercial portfolio to the Minister of Finance by the Treasury.

My Official Information Act request to the Treasury was declined on commercial in confidence grounds. Not only was my request to the Minister of Finance similarly refused, he told me to do the analysis myself by working my way through the 49 annual reports of the state owned enterprises in New Zealand.

Source: Bill English, Minister of Finance, Response to Official Information Act request, 30 November 2015.
Look it up yourself is not a good approach to public accountability to busy taxpayers who have lives to lead. There is a very well-paid Treasury that can do that analysis and has been doing that analysis every year until two years ago.
There is been no explanation for the non-publication of the Crown Portfolio report for two years. That is unacceptable in terms of tax payer accountability.
What is weird about this blow to taxpayer accountability is I have been refused access to Treasury analysis of public information. I’m not actually asking for the analysis. I am asking for a tabulation of 49 annual reports of state owned enterprises. Somehow a tabulation of public information is commercial in confidence despite the fact I can do it myself. This makes no sense.
It appears that for two years now the Minister of Finance has not been advised on the annual rates of return of the state owned enterprise portfolio as a whole. If he had, the Treasury and the Minister of Finance would have supplied that data to me in the course of my Official Information Act requests because it was obvious that I was after that information and they have a duty to be helpful when processing Official Information Act requests.
The Minister of Finance should be more curious about tens of billions of dollars in taxpayer’s assets that currently struggle to offer a positive return.

Source: The New Zealand Treasury, Crown Portfolio Report 2013, p. 41.
No publicly listed company could fail to publish its annual report. The fact that this has not been picked up as an example of why public ownership is inferior. No one profits from highlighting these governance shortcomings.
If the state owned enterprises were listed on the stock exchange, investors would sell off a company that missed its reporting date. Missing a reporting date is a sure sign of both poor governance and poor performance. Entrepreneurs would see a poorly governed company as a takeover opportunity. There are no similar disciplines for state owned enterprises whose governance and transparency falls short.
By the way, the original objective of my research was to compare state-owned enterprise performance under the current and previous governments. The Treasury was unable to supply data further back than 2007. Everything before then is on paper. The individual company reports have to be looked up by hand.
Nothing is at the fingertips of the Treasury if the Minister of Finance was interested in knowing whether his stewardship of state owned enterprises was superior to that of his predecessors.
Minimum wage as % of median and the gender wage gap at the bottom of the New Zealand labour market
30 Nov 2015 1 Comment
in discrimination, gender, minimum wage, politics - New Zealand
The minimum wage was pretty stable as a percentage of the median wage in New Zealand until recently. Nonetheless, the gender wage gap narrowed at the bottom of the labour market rapidly in the 1980s and 1990s.

Source: OECD Employment Database and Data extracted on 30 Nov 2015 04:03 UTC (GMT) from OECD.Stat.
In common with the USA, that narrowing of the gender wage gap stopped in the early 2000s after the minimum wage started increasing as a percentage of the median wage.
Again, that is contrary to the idea that the minimum wage is a failsafe that narrows the gender wage gap at the bottom. This failsafe is said to be the leading reason why the gender wage gap is much smaller at the bottom of the labour market than higher-up such as the median and in particular at the top.
Gender wage gaps and the role of unconscious bias
28 Nov 2015 9 Comments
in discrimination, entrepreneurship, gender, labour economics, occupational choice, politics - New Zealand, survivor principle Tags: compensating differentials, employer discrimination, entrepreneurial alertness, gender wage gap, market selection, The meaning of competition
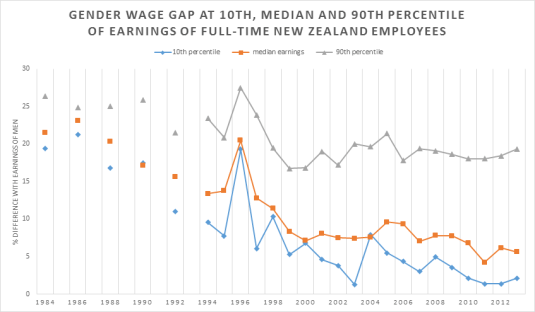
Geoff Simmons’ Friday Whiteboard podcast last night on the 12% gender wage gap was a good summary of the proximate drivers such as occupational segregation and part-time work. I have a few quibbles with his stress on unconscious bias as the driver of the gender wage gap.
The first of these quibbles is the gender wage gap is tiny at the bottom and even the middle of the labour market but is so high and so stable for so long at the top-end. Why does unconscious bias increase with the wages on offer? Better paid professional women have far more options to look around for the best paid job and turned down inferior officers.
Source: OECD Employment Database.
My second quibble is the New Zealand gender wage gap is trivial for women under the age of 45 but suddenly there is a burst of unconscious bias until they retire. This is odd because mature age workers have had plenty of time to accumulate human capital, search around for the best job offer and will have a job and therefore can turn down inferior offers. These women are not new starters on the unemployment benefit desperate for employment.
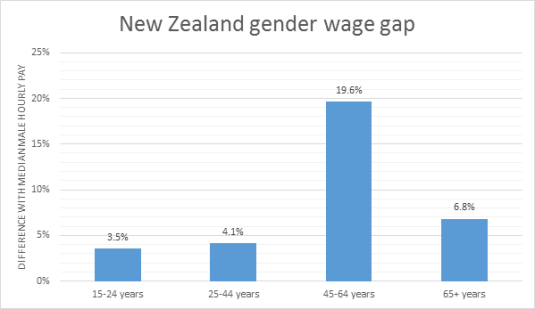
Source: New Zealand Income Survey 2014 via Human Rights Commission: Tracking Equality at Work.
My final quibble is the gender wage gap for part-time workers is reversed. No one takes this higher pay per hour as evidence that there is no unconscious bias against women who work part-time. If the gender pay gap was in the opposite direction, of course, that pay gap would be conclusive evidence of unconscious bias against women in part-time jobs. But as the gap is as it is in favour of women not against them, the usual adjustments for skills, age and experience become convenient truths.
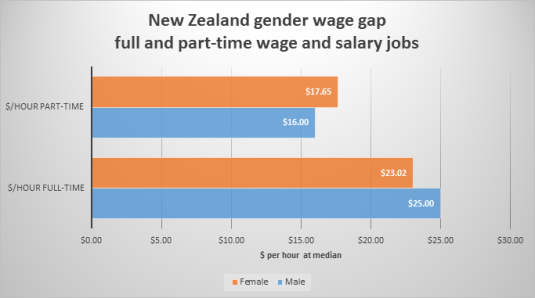
Source: Statistics New Zealand, New Zealand Income Survey, June quarter 2015.
Is what’s left of the unconscious bias hypothesis that we chauvinistic men, bastards all, have an unconscious bias against women who work full-time, who are over the age of 45 or earn a lot of money making us jealous?
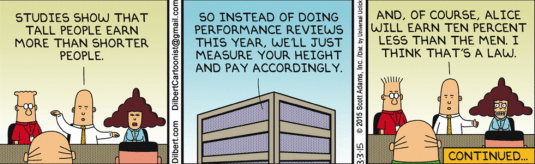
The unconscious bias hypothesis for the residual in the gender wage gap has come to the fore because earlier hypotheses of deliberate discrimination against women fell by the wayside as explanations for the gender wage gap.
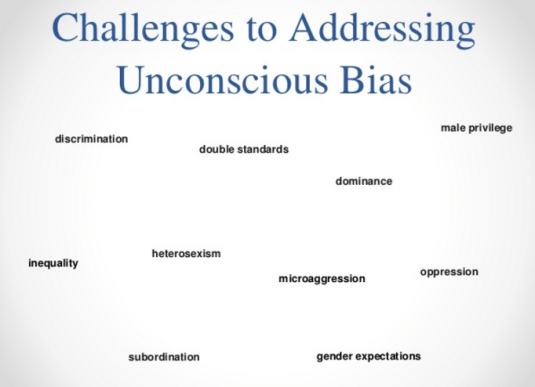
Complicating things is the unconscious bias hypothesis must explain why the unconscious bias is so much stronger at the top end of the labour market against women who have plenty of options to fight back including found in their own companies to hire women underpaid elsewhere.
As is well known, sex and race discrimination by employers as a profit opportunity for other less prejudiced employers including unconsciously prejudiced employers to hire the undervalued workers.
The process whereby the market bids up the wages of women undervalued by unconsciously biased employers can be itself be thoroughly unconscious as Armen Alchian explained in 1950. Alchian pointed out the evolutionary struggle for survival in the face of market competition ensured that only the profit maximising firms survived:
- Realised profits, not maximum profits, are the marks of success and viability in any market. It does not matter through what process of reasoning or motivation that business success is achieved.
- Realised profit is the criterion by which the market process selects survivors.
- Positive profits accrue to those who are better than their competitors, even if the participants are ignorant, intelligent, skilful, etc. These lesser rivals will exhaust their retained earnings and fail to attract further investor support.
- As in a race, the prize goes to the relatively fastest ‘even if all the competitors loaf.’
- The firms which quickly imitate more successful firms increase their chances of survival. The firms that fail to adapt, or do so slowly, risk a greater likelihood of failure.
- The relatively fastest in this evolutionary process of learning, adaptation and imitation will, in fact, be the profit maximisers and market selection will lead to the survival only of these profit maximising firms.
These surviving firms may not know why they are successful, but they have survived and will keep surviving until overtaken by a better rival. All business needs to know is a practice is successful. The reason for its success is less important.
In the case of unconscious bias against women, those employers who are less unconsciously biased than the rest will grow at the expense of less enlightened albeit unconsciously less enlightened rivals. Undervaluing workers for any reason is a business opportunity. The market processes will reduce this undervaluation. All that is required is that some employers be less unconsciously biased than others.

One method of organising production will supplant another when it can supply at a lower price (Marshall 1920, Stigler 1958). Gary Becker (1962) argued that firms cannot survive for long in the market with inferior product and production methods regardless of what their motives are. They will not cover their costs.
The more efficient sized firms are the firm sizes that are currently expanding their market shares in the face of competition; the less efficient sized firms are those that are currently losing market share (Stigler 1958; Alchian 1950; Demsetz 1973, 1976). Business vitality and capacity for growth and innovation are only weakly related to cost conditions and often depends on many factors that are subtle and difficult to observe (Stigler 1958, 1987). In the case of unconsciously biased employers, they are less likely to survive.

What is even more peculiar is this unconscious bias exists at the end of the market where there is the greatest incentive to invest in ascertaining the quality of recruits if Edward Lazear’s pioneering work on the personnel economics of hiring standards is to believed:
Screening is more profitable when the stakes are higher: The purpose of screening is to avoid the unprofitable candidates. Therefore, the greater the downside risk from hiring the wrong person, the more value there is to screening. Similarly, the longer that a new candidate can be expected to stay with the employer, the more valuable will be the screen. Firms that intend to hire employees for the long term thus tend to invest more in careful screening before committing to a new hire.
The higher the wage of recruit, the more important they are to the success of the firm. That gives the entrepreneur more reasons to sort and screen from better quality recruits. The higher paid is the recruit, the greater the returns to the applicant from signalling their quality:
Signalling is helpful when employers do not have enough information about job applicants to assess their potential accurately enough. It is useful when differences in talent among potential employees matter a lot to productivity. When differences in talent do not make much difference to productivity, signalling will not be very useful.
These ideas suggest when we should expect to see employment practices consistent with signalling. First, signalling should be more important in jobs where skills are most important. Such jobs tend to be those that are at high levels of the hierarchy, in research and development, and in knowledge work. They also correspond well to professional service firms, such as consulting, accounting, law firms, and investment banks. In such professions, even small differences in talent can lead to large differences in effectiveness on the job, so sorting for talent is very important. For this reason, such firms tend to screen very carefully at recruiting, and usually have promotion systems that correspond well to our probation story above, at least in the first few years on the job.
The presence of more unconscious bias at the top of the labour market than at the middle and the bottom doesn’t have as many legs as suggested by Geoff Simmons in his Friday podcast. The higher is the wage, the greater is investment by both sides to the recruitment equation in an unbiased consideration of the job application. This runs against the notion that the gender gap at the top end of the labour market is due to unconscious bias.

A far better explanation is compensating differentials. Women at the top are trading off wages from work-life balance and more time with their children. They can do so because they are well-paid.
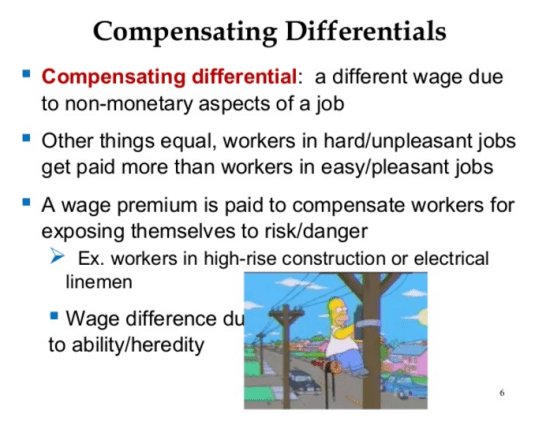
Whatever the hypothesis about compensating differentials is, that hypothesis has nothing to do with unconscious bias by employers. Alison Booth and Jan van Ours were almost annoyed to find that British women are actually quite satisfied with part-time work:
Women present a puzzle. Hours satisfaction and job satisfaction indicate that women prefer part-time jobs irrespective of whether these are small or large but their life satisfaction is virtually unaffected by hours of work.
I will close with a quote from Amy Wax on the impractical nature of doing anything about unconscious bias:
Demonstrating racial bias is no easy matter because there is often no straightforward way to detect discrimination of any kind, let alone discrimination that is hidden from those doing the deciding. As anyone who has ever tried a job-discrimination case knows, showing that an organization is systematically skewed against members of one group requires a benchmark for how each worker would be treated if race or sex never entered the equation. This in turn depends on defining the standards actually used to judge performance, a task that often requires meticulous data collection and abstruse statistical analysis.
Assuming everyone is biased makes the job easy: The problem of demonstrating actual discrimination goes away and claims of discrimination become irrefutable. Anything short of straight group representation — equal outcomes rather than equal opportunity — is “proof” that the process is unfair.
Advocates want to have it both ways. On the one hand, any steps taken against discrimination are by definition insufficient, because good intentions and traditional checks on workplace prejudice can never eliminate unconscious bias. On the other, researchers and “diversity experts” purport to know what’s needed and do not hesitate to recommend more expensive and strenuous measures to purge pervasive racism. There is no more evidence that such efforts dispel supposed unconscious racism than that such racism affects decisions in the first place.


Recent Comments