The World is Getting Richer…& Much More Equal (ht @MaxCRoser, apologies to Piketty) pic.twitter.com/FcUCZYu6Cs
— ian bremmer (@ianbremmer) January 15, 2015
The World is Getting Richer…& Much More Equal
20 Jan 2015 Leave a comment
in applied welfare economics, politics - Australia, politics - New Zealand, politics - USA Tags: Leftover Left, Oxfam, Thomas Piketty
Denying Problems When We Don’t Like the Solutions
20 Jan 2015 Leave a comment
in applied welfare economics, politics - New Zealand, politics - USA, Public Choice Tags: advocacy bias, anti-capitalist mentality, Anti-Economics Left, Anti-Science left, expressive voting

There is often a curious distinction between what the scientific community and the general population believe to be true of dire scientific issues, and this skepticism tends to vary markedly across groups.
…What causes such radical group differences? We suggest, as have previous accounts, that this phenomenon is often motivated.
However, the source of this motivation is not necessarily an aversion to the problem, per se, but an aversion to the solutions associated with the problem.
This difference in underlying process holds important implications for understanding, predicting, and influencing motivated skepticism.
In 4 studies, we tested this solution aversion explanation for why people are often so divided over evidence and why this divide often occurs so saliently across political party lines.
Studies 1, 2, and 3—using correlational and experimental methodologies—demonstrated that Republicans’ increased skepticism toward environmental sciences may be partly attributable to a conflict between specific ideological values and the most popularly discussed environmental solutions.
Study 4 found that, in a different domain (crime), those holding a more liberal ideology (support for gun control) also show skepticism motivated by solution aversion.


HT: http://today.duke.edu/2014/11/solutionaversion and http://www.washingtonpost.com/blogs/wonkblog/wp/2014/11/10/conservatives-dont-hate-climate-science-they-hate-the-lefts-climate-solutions/
Media completely missed this report in the lead-up to 2014 election: Rich-poor gap not growing in New Zealand and hasn’t for 20 years
20 Jan 2015 Leave a comment
in applied welfare economics, politics - New Zealand Tags: 2014 New Zealand election, child poverty, Gini coefficient, inequality and poverty, media bias, top 1%
Figure 1: Gini coefficient New Zealand 1980-2015

Source: Bryan Perry, Household incomes in New Zealand: Trends in indicators of inequality and hardship 1982 to 2013. Ministry of Social Development (July 2014).
Figure 2: Real household incomes (BHC), changes for top of income deciles, 1994 to 2013
![clip_image002[7]](https://utopiayouarestandinginit.com/wp-content/uploads/2014/12/clip_image0027_thumb.png?w=696&h=443)
Source: (Perry 2014).
Figure 3: Real equivalised median household income (before housing costs) by ethnicity, 1988 to 2013 ($2013).
![clip_image002[9]](https://utopiayouarestandinginit.com/wp-content/uploads/2014/12/clip_image0029_thumb2.png?w=686&h=452)
Source: (Perry 2014).

HT: http://www.listener.co.nz/current-affairs/new-deal-for-kids/

HT: http://i.stuff.co.nz/business/industries/10244667/Rich-poor-gap-not-growing-report
New Zealand – Chartbook of Economic Inequality
20 Jan 2015 Leave a comment
in applied welfare economics, politics - New Zealand, poverty and inequality Tags: Gini coefficient, poverty and inequality, top 1%
| Has the dispersion of earnings been increasing in recent decades? | Yes, the top decile has risen from 143 per cent of median in 1986 to 186 per cent in 2012. |
| Has overall inequality increased in recent years? | No, the Gini coefficient has been relatively stable around 32 percent since 1996. However, it rose by 7 percentage points between 1988 and 1996. |
| Have there been periods when overall inequality fell for a sustained period? | Yes, from mid-1950s to mid-1970s. |
| Has poverty been falling or rising in recent decades? | Poverty has substantially increased from 1996 to 2004 before decreasing mildly till 2009. |
| Has there been a U-pattern for top income shares over time? | Yes, top gross income shares fell from mid-1950s to mid-1980s, then rose from mid-1980s to mid-1990s. |
| Has the distribution of wealth followed the same pattern as income? | Insufficient evidence. |
| Additional noteworthy features | U-shape over post-war period. Top income shares estimates for the years 1998, 1999 and 2000 are affected by changes in the income tax laws. Top shares series have a break in 1951 (change in tax units). |

You are welcome to share but please refer to A. B. Atkinson and S. Morelli (2014) – ‘The Chartbook of Economic Inequality’ at http://www.ChartbookOfEconomicInequality.com
This visualisation is licensed under a Creative Commons BY-NC-SA license Data visualisation by: Max Roser
How many children live with their parents?
18 Jan 2015 Leave a comment
in labour economics, politics - Australia, politics - New Zealand, politics - USA Tags: single parenthood

Most consumers want GMO labels; but 80% also want to label food with DNA
17 Jan 2015 Leave a comment
in applied welfare economics, economics of information, economics of media and culture, liberalism, politics - New Zealand, politics - USA Tags: anti-GMO movement, Anti-Science left, GMOs, quackery
And the Oscar for “Best Tax Break” Goes to…
17 Jan 2015 Leave a comment
in economics of media and culture, movies, politics - New Zealand, politics - USA, Public Choice, rentseeking Tags: corporate welfare, film subsidies

HT: http://economics21.org/commentary/oscars-tax-break-american-sniper-2015-01-16 and http://www.washingtonexaminer.com/how-this-years-oscar-nominees-got-government-handouts/article/2558717

The marvel of the market: the remarkable foresight of young adults in choosing what to study
16 Jan 2015 1 Comment
in Alfred Marshall, Armen Alchian, economics of education, George Stigler, human capital, job search and matching, labour economics, occupational choice, politics - New Zealand, rentseeking Tags: 2nd laws of supply and demand, Alfred Marshall, Armen Alchian, george stigler, search and matching, skills shortgaes
Known but yet to be exploited opportunities for profit do not last long in competitive markets, including hitherto unnoticed opportunities for the greater utilisation and development of skills and experience (Hakes and Sauer 2006, 2007; Ryoo and Rosen 2004; and Kirzner 1992). Moneyball is the classic example of entrepreneurial alertness to hitherto unexploited job skills which were quickly adopted by competing firms (Hakes and Sauer 2006, 2007).
There is considerable evidence that the demand and supply of human capital responds to wage changes. For example, over- or under-supplied human capital moves either in or out in response to changes in wages until the returns from education and training even out with time (Ryoo and Rosen 2004; Arcidiacono, Hotz and Kang 2012; Ehrenberg 2004).
As evidence of this equalisation of returns on human capital investments across labour markets, the returns to post-school investments in human capital are similar – 9 to 10 percent – across alternative occupations, and in occupations requiring low and high levels of training, low and high aptitude and for workers with more and less education (Freeman and Hirsch 2001, 2008). There is evidence that workers with similar skills in similarly attractive jobs, occupation and locations earn similar pay (Hirsch 2008; Vermeulen and Ommeren 2009; Rupert and Wasmer 2012; Roback 1982, 1988).
Ryoo and Rosen (2004) found that the labour supply and university enrolment decisions of engineers is “remarkably sensitive” to career earnings prospects. Graduates are the main source of new engineers. Engineers who moved out into other occupations such as management did not often moved back to work again as professional engineers. Ryoo and Rosen (2004) observed when summarising their work that:
Both the wage elasticity of demand for engineers and the elasticity of supply of engineering students to economic prospects are large. The concordance of entry into engineering schools with relative lifetime earnings in the profession is astonishing.
Ryoo and Rosen (2004) found several periods of surplus in the market for engineers. These periods of shortage or surplus corresponded to unexpected demand shocks in the market for engineers such as the end of the Cold War.
Figure 1: New entry flow of engineers: a, actual vs. imputed from changes in stock of engineers; b, time-varying coefficients.
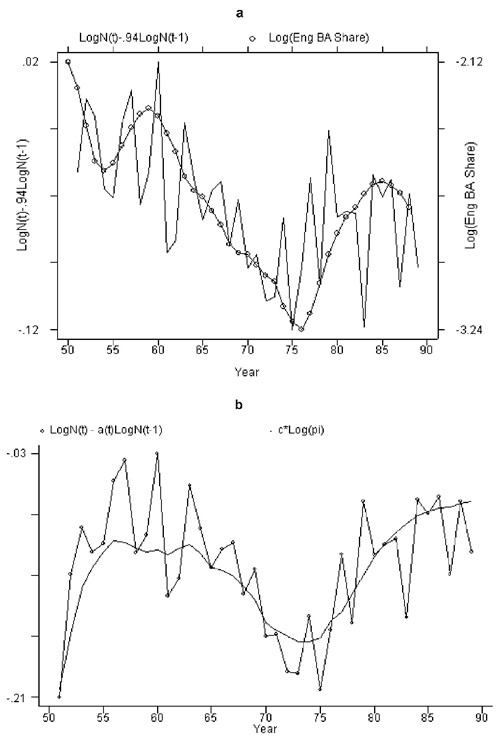
Source: Ryoo and Rosen (2004)
Ryoo and Rosen (2004) noted that importance of permanent versus transitory changes in earnings. Transitory rises and falls in earnings prospects have much less influence on occupational choices and the educational investments of students.
In light of these findings that the supply of engineers rapidly adapted to changing market conditions, Ryoo and Rosen (2004) questioned whether public policy makers have better information on future labour market conditions than labour market participants do. When politicians get worked up about skill shortages, the markets for scientists and engineers often where they make extravagant claims about the ability of the market to adapt to changing conditions because of the long training pipeline involved in university study, including at the graduate level.
There can be unexpected shifts in the supply or demand for particular skills, training or qualifications. These imbalances even themselves out once people have time to learn, update their expectations and adapt to the new market conditions (Rosen 1992; Ryoo and Rosen 2004; Bettinger 2010; Zafar 2011; Arcidiacono, Hotz and Kang 2012; Webbink and Hartog 2004).
For example, Arcidiacono, Hotz and Kang (2012) found that both expected earnings and students’ abilities in the different majors are important determinants of student’s choice of a college major, and 7.5% of students would switch majors if they made no forecast errors.
The wage premium for a tertiary degree was low and stable in New Zealand in the 1990s (Hylsop and Maré 2009) and 2000s (OECD 2013). This stability in the returns to education suggests that supply has tended to kept up with the demand for skills at least over the longer term at the national level. There were no spikes and crafts that would be the evidence of a lack of foresight among teenagers in choosing what to study.
All in all, the remarkable sensitivity of engineers to a career earnings prospects, the frequent changes of college majors by university students in response to changing economic opportunities, and the stability of the returns on human capital over time suggest that the market for human capital is well functioning.
The argument that the market was not working well was assumed rather than proven. Likewise, the case for additional subsidies for science, technology, engineering and mathematics because of perceived skill shortages has not been made out. There is a large literature showing that the market for professional education works well.
The onus is on those who advocate intervention to come up with hard evidence, rather than innate pessimism about markets that are poorly understood because of a lack of attempts to understand it. Studies dating back to the 1950s by George Stigler and by Armen Alchian found that the market for scientists and engineers works well and the evidence of shortages were more presumed than real.
How many New Zealand prime ministers and cabinet ministers have been convicted of sedition?
15 Jan 2015 Leave a comment
in defence economics, politics - New Zealand
New Zealand must be forgiving place. 15 years after World War I, it elected into office a Prime Minister and three Cabinet ministers who were convicted of sedition during the First World War. They were the leaders of the first Labour Party government in New Zealand.
Peter Fraser was sentenced to 12 months in prison for a seditious speech. Walter Nash was fined £5 for importing seditious literature. Both became prime ministers in time.


These four men, all members of the newly founded Labour Party and lifelong Christian Socialists, opposed the introduction of conscription in World War I. A major factor in the formation of the Labour Party New Zealand in 1916 was the imposition of conscription in 1915.

Ironically, these same men, Prime Minister Peter Fraser and Cabinet minister and later Prime Minister Walter Nash, along with two other Cabinet members who were convicted of sedition for opposing conscription in World War I introduced conscription into New Zealand in 1940 to fight the Second World War. Difficulties in filling the Second and Third Echelons for overseas service in 1939 and 1940, the Allied disasters of May 1940 and public demand led to its introduction.
The total eventually conscripted was more than 312,000. About 800 were labelled ‘military defaulters’ and interned for the duration of the war in specially built camps in remote areas.
The police cracked down severely on anti-conscription groups. As Russia haven’t yet been invaded by the Nazis, leading opponents of conscription included those traitors in the Communist Party.
Zombie lending and lower Japanese productivity growth
15 Jan 2015 Leave a comment
in economic growth, macroeconomics, politics - New Zealand, public economics Tags: fiscal stimulus, Japan, Lost Decade, Think Big
The low Japanese productivity growth throughout the 1990s could have been the result of subsidies to inefficient firms and declining industries both directly and through a banking system rolling over loans in arrears to insolvent firms.
This policy is known as zombie lending, and it lowered productivity because higher cost firms kept producing a greater share of Japanese output than would otherwise have been the case (Hayashi and Prescott 2003; Ahearne and Shinada 2005).
- Zombie firms are insolvent firms often propped up with new loans and loan rollovers from Japanese banks.
- Zombie banks are insolvent banks propped up with loans from the central bank and by lax regulatory inspections of their weak loan portfolios and lack of adequate capital.
Japan’s economic policies have until recently kept insolvent banks operating, further encouraging zombie lending, which impeded the flow of capital to the more efficient firms.
The competitive process where zombies shed workers and lose market share was thwarted. The Japanese authorities subsidised insolvent banks and firms and provided credit to some firms and not to others (Prescott 2002; Hayashi and Prescott 2002; Caballero et al. 2005; Hoshi and Kashyap 2004).
The pervasiveness and long-term persistence of zombie lending as a shock to Japanese productivity growth cannot be understated. As Kashyap noted:
The government allowed even the worst banks to continue to attract financing and support their insolvent borrowers
…By keeping these unprofitable borrowers alive, banks allowed the zombies to distort competition throughout the rest of the economy.
Caballero et al. (2008) estimated that 30 per cent of all publicly traded Japanese manufacturing, construction, real estate, retail, wholesale, and service sector firms were on life support from banks in the early 2000s, and that most large Japanese banks only complied with capital standards because regulators were lax in their inspections.
The percentage of zombies hovered between 5 and 15 per cent up until 1993 and rose sharply over the mid-1990s to exceed 25 per cent for every year after 1994 (Caballero et al. 2008).
Figure 1: Prevalence of Firms Receiving Subsidized Loans in Japan

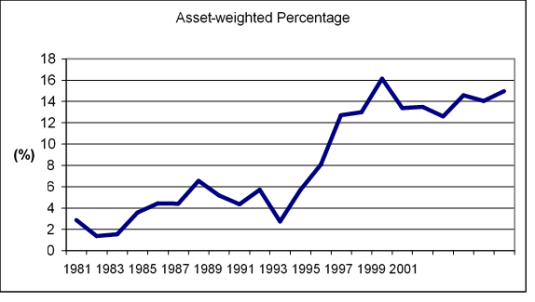
Source: Caballero et al. (2008) Zombie Lending and Depressed Restructuring in Japan. American Economic Review.
Zombie lending is a more serious problem for Japanese non-manufacturing firms than for manufacturing firms (Caballero et al. 2008). Small and medium size firms were also major beneficiaries of zombie lending.
Zombie lending also discourages new investments that increase Japanese productivity, encourages inefficient firms to avoid making the decisions necessary to raise their profitability, and impedes the solvent Japanese banks from finding good lending opportunities (Caballero et al. 2008; Sekine et al. 2003). As Kashyap noted:
Usually when an industry is hit by a bad shock, many firms exit… In Japan, firms never exited. Given that they never exited, it is not surprising that new firms weren’t created.
Under normal conditions, higher cost firms would go bankrupt and be replaced by new and better ideas and firms. Instead, firms that were more efficient than the zombie firms tended to exit industries because their demise does not require the banks to acknowledge large bad loans. This exit of the firms of intermediate efficiency rather than the exit of the least efficient firms dragged productivity down even further (Nishimura et al. 2005; Okana and Horioka 2008). New Zealand in the 1970s and in the early 1980s also had a range of policy measures that supported high-cost firms and declining industries.
When bankrupt firms can stay in business, they retain workers who otherwise would be willing to work for lower wages at a healthy firm and depress market prices for their products. Low prices and high wages reduce the profits that more productive firms can earn which discourages entry and investment.
The creation of new jobs is a measure of industry dynamism. In manufacturing, which suffered the least from the zombie problem, job creation hardly changed from the early 1990s to the late 1990s. In contrast, there was a large decline in job creation in the non-manufacturing sectors, particularly in construction (Caballero et al. 2008; Hoshi 2006; Caballero et al. 2008).
There was less restructuring of employment and market shares in favour of the more productive firms. The gap in productivity growth between the Japanese manufacturing and non-manufacturing sectors more than doubled over the 1990s (Caballero et al. 2008).
Japanese R&D spending has also slowed down significantly since the start of the 1990s (Comin forthcoming). The gap in the rate of computer adoption between Japan and USA also increased in the 1990s. The speed of diffusion of new technologies slowed to the point that South Körea has now surpassed Japan in the diffusion of computers and the Internet (Comin forthcoming).
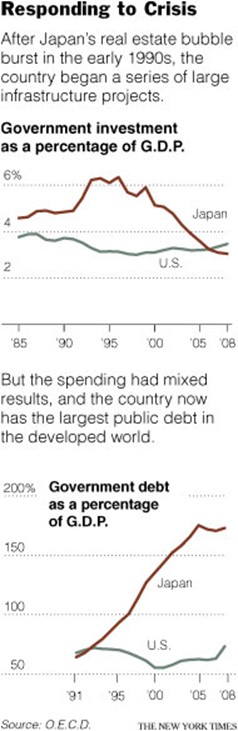
Over the 1990s, there were ten massive fiscal packages to maintain employment and investment. Much of this additional Japanese government spending was on public works and other projects whose social payoffs have been queried by independent observers. The consumption tax was increased from 3 per cent to 5 per cent in 1997. There were two rounds of temporary tax cuts – for 2 years only.

Japan pursued economic policies in response to a recession that stifled total factor productivity by providing bad incentives to the private sector.

The unproductive firms depressed Japanese productivity because they competed for labour and capital that could have been used by the more productive firms. Zombie lending allowed many firms to stay in business long after the monetary policy changes that uncovered their unprofitable petered out. The diversion of resources to these insolvent firms prevented a productivity recovery. The lack of a productivity recovery depressed wages, incomes and consumer demand.
The zombie lending and fiscal packages compounded the 1990 monetary contraction into the highly persistent shocks that were required to be able to depress Japanese productivity growth for more than a decade.

More and more resources were tied up in high cost firms and in declining industries. This was rather than be reallocated to more productive uses by the normal market processes of relative price and wage changes, free entry and profit and loss. Kashyap argues that:
The experience in Japan definitely shows that providing subsidized credit to dying firms will be costly over time. Keeping an industry from restructuring only delays the day of reckoning and raises the cost substantially
…There are many examples besides Japan where people fail to recognize that it is dangerous to keep people attached to businesses that are fundamentally unprofitable
The massive Japanese government investments have echoes of the ‘Think Big’ energy investments in New Zealand in the late 1970s.

The productivity impact of ‘Think Big’ was suspect. In addition, state-owned enterprises offering a net return of zero to the Crown in the 1980s has Japanese parallels.
The propping up of high cost state owned and private firms in the 1970s and 1980s in New Zealand helped to depress productivity growth rates. State-owned enterprises offered a net return of about zero to the taxpayer, even as recently as last year in New Zealand.
More and more resources were tied up in New Zealand in the high cost firms and declining industries than be reallocated to more productive uses by the market processes of price and wage changes, free entry and profit and loss. The lack of productivity growth depressed wages, incomes and consumer demand in New Zealand.
The productivity based explanations for the slumps in New Zealand from 1974 to 1992 and in Japan from 1990 to 2003 have a number of common threads.

Recent Comments