26 Jan 2015
by Jim Rose
in economics of media and culture, politics - New Zealand
Tags: expressive voting, Greens, Leftover Left, Uk Greens

Obviously, the UK Greens are not as fluffy as their down-under compatriots if you have a look at this somewhat confrontational sign of theirs.

The New Zealand Greens have election campaign signs from which I can neither discern their message, nor easily work out that it is a Green sign because their logo is so small in the bottom right hand corner when driving by a car.

Maybe the Greens are not after car-owner votes, only bicyclists and public transport users – the middle-class on the way to their jobs in the city.
The sign of the UK Greens borders on hate speech. The UK Greens also do not have female and male co-leaders, as is the case for the New Zealand Greens, from what I can see – where is their gender balance?
24 Jan 2015
Things are worse than in the 1980s. What nonsense.
Image
by Jim Rose
23 Jan 2015
by Jim Rose
in applied price theory, applied welfare economics, economics of regulation, geography, law and economics, politics - New Zealand, politics - USA, rentseeking, urban economics
Tags: agglomeration, green rent seeking, land supply, zoning
the implied cost of housing restrictions across the whole U.S., and Chang and Enrico find that aggregate output is lower by about 10-14% because of them.

 The Growth Economics Blog
Last post on the NBER growth session. Chang-Tai Hsieh (Chicago) and Enrico Moretti (Berkeley) presented a paper on wage dispersion across cities in the U.S. Wage dispersion (New Yorkers earn more than people in Cleveland) either represents compensation for living costs (housing in New York is more expensive than in Cleveland), a real difference in productivity (New Yorkers are more productive than Clevelanders), or some combination of the two.
What Chang and Enrico find is that the increase in wage dispersion across cities in the U.S. over the last thirty-ish years is due almost entirely to rising house prices in six cities: NY, DC, Boston, San Fran, San Jose, and Seattle. Wages have gone up rapidly in those cities, but that is basically just compensating their citizens for the higher costs of living.
Now, given the costs of living, the allocation of population across cities in the U.S. is…
View original post 274 more words
23 Jan 2015
by Jim Rose
in Austrian economics, constitutional political economy, F.A. Hayek, liberalism, politics - Australia, politics - New Zealand, politics - USA
Tags: Australian Broadcasting Commission (ABC), Monday Conference, Road to Serfdom

This summary by Hayek of the contemporary meaning of socialism in the 1930s and 1940s was relatively accurate.
You must remember that clause 4 of the British Labour Party’s manifesto committing that party to the socialisation of the means of production, distribution and exchange was only dropped relatively recently at the impetus of Tony Blair.
The Australian Labor Party still includes the socialisation of the means of production, distribution and exchange as one of its objectives.
There were stronger divisions in the inter-war labour parties in Britain, Australia and New Zealand about whether the party should be committed to full socialism, Christian socialism or social democracy. It has been forgotten that the labour parties of Britain, Australia and New Zealand had many fall on the socialists within that party.
The Labour Party of Michael Foot in the 1983 British general election ran on a hard left manifesto, with Tony Benn and the Trotskyist entryist group Militant Tendency, which had several MPs, wanting a full socialist agenda in 1980s Britain.
22 Jan 2015
by Jim Rose
in applied price theory, politics - New Zealand, urban economics
Tags: Andrew Little, Dominion Post, economic literacy, housing affordability, media bias, rational irrationality, Resource Management Act, zoning

The editorial in today’s Dominion Post about the proposed reforms in New Zealand to the Resource Management Act to increase of urban land supply and make housing more affordable actually supported some absolute nonsense economic analysis by the Leader of the Opposition, Andrew Little:
Labour leader Andrew Little says part of the problem is in fact low and in many areas stagnating wages.
That is correct, but this merely points to a huge problem that successive governments have failed to solve. Nor is this Government likely to do much by way of living wage reforms or other non-market solutions.
The alleged professional journalist who wrote this editorial is ignorant of the most basic workings of the economy which he could pick up as an ordinary consumer and home owner.
If consumers become wealthier because of higher wages, they will use this increased income to demand more housing and land.
If the supply of land is fixed or otherwise constrained from expanding much, the only thing that will happen is that the price will go up with more money chasing the same amount of land and housing.
This will benefit the existing home owners in New Zealand. Workers who don’t own homes will simply have to pay more of their now higher wages to buy houses. Once again, the Labour Party betrays the interests of the working class to win middle-class home owner votes.
22 Jan 2015
by Jim Rose
in economics of media and culture, entrepreneurship, industrial organisation, movies, politics - New Zealand, technological progress
Tags: 3-D movies, creative destruction, innovation
We saw Peter Jackson’s latest Hobbit movie the other day. The other films previewed before the Battle of the Five Armies were also 3-D films.

The first of these was a cartoon where the 3-D technology seemed to be based on using crayons to try and trick you as to what was going on.
The next trailer was the next Star Wars movie in 3-D. Again, it was vastly inferior to the 3-D technology of Sir Peter Jackson and his team.
I noticed the same with all the 3-D films of Sir Peter Jackson: they are much better than the competition.
More than a few times in the 3-D films of his competition, you doubt as to whether the film is in 3-D or not and can’t really tell the difference sometimes as to the 3-D effect over normal films in terms of cinematic experience. Example of this was the last Star Trek movie we saw. The 3-D effect failed in a number of occasions.
Clearly there are trade secrets in 3-D films. The 3-D effect works pretty well in Peter Jackson’s films, except for the occasional close-up transition, and sometimes is quite dazzling.
20 Jan 2015
by Jim Rose
in applied welfare economics, politics - Australia, politics - New Zealand
Tags: Leftover Left, poverty and inequlaity, top 1%
|
New Zealand |
Australia |
| Has the dispersion of earnings been increasing in recent decades? |
Yes, the top decile has risen from 143 per cent of median in 1986 to 186 per cent in 2012. |
Yes, top decile of earnings has increased from 175 per cent of median in 1975 to 215 per cent in 2012. |
| Has overall inequality increased in recent years? |
No, the Gini coefficient has been relatively stable around 32 percent since 1996. However, it rose by 7 percentage points between 1988 and 1996. |
Yes, Gini coefficient has increased by 5 percentage points since 1981. |
| Have there been periods when overall inequality fell for a sustained period? |
Yes, from mid-1950s to mid-1970s. |
Yes, overall inequality and top shares fell from early 1950s to end of the 1970s. |
| Has poverty been falling or rising in recent decades? |
Poverty has substantially increased from 1996 to 2004 before decreasing mildly till 2009. |
Risen since 1981. |
| Has there been a U-pattern for top income shares over time? |
Yes, top gross income shares fell from mid-1950s to mid-1980s, then rose from mid-1980s to mid-1990s. |
Yes, top gross income shares fell from 1921 to around 1980 and then began to rise, reaching pre-war levels before the 2007 crisis. |
| Has the distribution of wealth followed the same pattern as income? |
Insufficient evidence. |
Yes, the share in total wealth of the wealthiest 1% of the population dropped more than threefold from 1915 to the end of 1970s before rising again till the onset of 2007 crisis. However, the rise was not sufficient to return to pre-war levels of concentration. |
| Additional noteworthy features |
U-shape over post-war period. Top income shares estimates for the years 1998, 1999 and 2000 are affected by changes in the income tax laws. Top shares series have a break in 1951 (change in tax units). |
Rising inequality on all (observable) dimensions for past thirty years. |
Australia has become more unequal over the past 30 years as compared to New Zealand, but it is also become 30% richer than New Zealand.
Looks like John Rawls was right for the average Australian as compared to the average New Zealander. Australia is a more unequal society but a far richer society because of it, which is a fair deal if Rawls is to be believing.
Figure 1: New Zealand inequality chart book
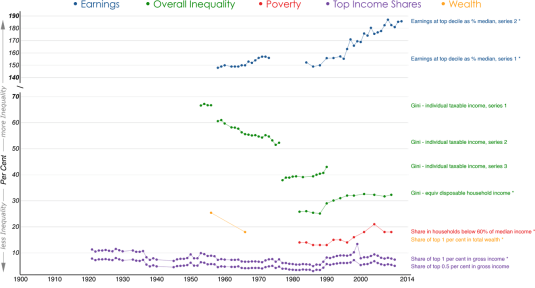
Figure 2: Australian inequality chart book
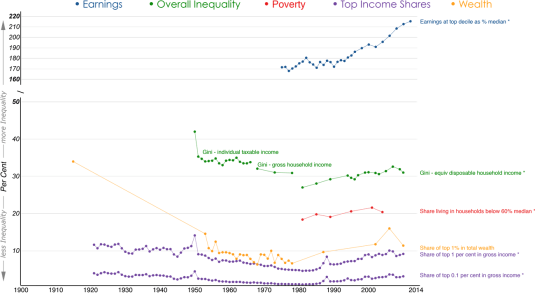
You are welcome to share but please refer to A. B. Atkinson and S. Morelli (2014) – ‘The Chartbook of Economic Inequality’ at http://www.ChartbookOfEconomicInequality.com
This visualisation is licensed under a Creative Commons BY-NC-SA license, Data visualisation by: Max Roser
Previous Older Entries Next Newer Entries


Recent Comments