By Davis Kedrosky and Nuno Palma. Published in The Journal of Economic History.In the book The Economics of Macro Issues which I used as a supplemental text, they mention that Russia has many resources but its per capita income is less than that of Luxembourg which has few resources. The book suggests that the economic…
The Cross of Gold: Brazilian Treasure and the Decline of Portugal (due to the resource curse)
The Cross of Gold: Brazilian Treasure and the Decline of Portugal (due to the resource curse)
18 Jul 2025 Leave a comment
in applied price theory, comparative institutional analysis, constitutional political economy, development economics, economic growth, economic history, growth disasters, international economics, law and economics, macroeconomics, property rights, Public Choice, rentseeking, resource economics Tags: Portugal, resources curse
General government net financial liabilities as % Portuguese, Italian, Greek, Spanish and Irish GDPs
03 Jun 2016 Leave a comment
in budget deficits, business cycles, economic growth, economic history, Euro crisis, financial economics, fiscal policy, global financial crisis (GFC), macroeconomics Tags: Greece, Ireland, Italy, Portugal, public debt management, sovereign debt crises, sovereign defaults, Spain
I had borrowed a lot of money from scratch after 2007. Greece borrowed a lot of money of its own accord from 2010. Italy always owed a lot of money. Spanish do not know all that much money considering their dire financial circumstances.

Source: OECD Economic Outlook June 2016 Data extracted on 01 Jun 2016 12:57 UTC (GMT) from OECD.Stat
The cost of starting a business in Europe and North America
18 Apr 2016 Leave a comment
in economics of regulation, industrial organisation, law and economics, politics - USA, property rights Tags: barriers to entry, Belgium, British economy, Canada, Denmark, doing business, France, Germany, Greece, Italy, Portugal, Spain
These measures including the full cost of starting a business. Not only are official fees included, the opportunity cost of the waiting times for various permits are issued are added as well.

Source: Markus Poschke, Entry regulation: Still costly | VOX, CEPR’s Policy Portal (2011).
Note: The value of time is set to a business day’s output per day of waiting time at 22 business days per month.
General government expenditure as % of Portuguese, Italian, Greek and Spanish GDP since 1960
24 Feb 2016 Leave a comment
in economic growth, economic history, Euro crisis, fiscal policy, macroeconomics, public economics Tags: Greece, growth of government, Italy, Portugal, size of government, Spain
I do not think any of these countries have governments who can really handle managing half of national income on a regular basis. The Italian, and I assume Greek GDPs at least are topped up quite considerably to take account of their underground economies. The top up for Italy is 20%.

Data extracted on 23 Feb 2016 07:45 UTC (GMT) from OECD.Stat.
Tax revenue as % of Portuguese, Italian, Greek and Spanish GDP
23 Feb 2016 Leave a comment
in economic history, public economics Tags: Greece, growth of government, Italy, Portugal, size of government, Spain

Portuguese, Italian, Greek and Spanish all-in average personal income tax rates at average wage by family type, 2014
29 Jan 2016 Leave a comment
in public economics Tags: family tax credit, Greece, in work tax credit, Italy, Portugal, Spain

Vanishing effect of #religion on the labour market participation of European women
19 Aug 2015 Leave a comment
in economics of religion, gender, human capital, labour economics, labour supply, occupational choice, poverty and inequality, welfare reform Tags: female labour force participation, female labour supply, France, gender gap, Germany, Greece, Italy, Portugal, Spain, Turkey
Vanishing effect of #religion on the labor market participation of European women newsroom.iza.org/en/2015/08/10/… http://t.co/25nx8NiEfk—
IZA (@iza_bonn) August 10, 2015
Incidence of long-term unemployment in the PIGS since 1983
17 Aug 2015 Leave a comment
in business cycles, currency unions, economic growth, economic history, Euro crisis, job search and matching, labour economics, labour supply, macroeconomics, occupational choice, unemployment, unions, welfare reform Tags: employment law, equilibrium unemployment, Greece, Italy, labour market regulation, natural unemployment rate, Portugal, Spain, unemployment duration
The boom that preceded the bust in the Greek economy did nothing for the rate of long-term unemployment among Greeks. Long-term unemployment had been pretty stable prior to the economic boom after joining the euro currency union.

Source: OECD StatExtract.
Nothing much happened to long-term unemployment in Italy or Portugal in recent decades. Spanish long-term unemployment fell in line with the economic boom in Spain over the 1980s and 1990s up until the global financial crisis.
Strictness of employment protections for individual dismissals – USA, UK, France, Germany and the PIGS
28 Jul 2015 1 Comment
in Euro crisis, job search and matching, labour economics, law and economics, macroeconomics Tags: British economy, employment law, employment law regulation, Eurosclerosis, France, Germany, Greece, Italy, Portugal, Spain
Much easier to fire someone in the USA or UK than on continental Europe. Greece and Spain aren’t that bad by continental European standards for employment law protections against dismissals of individuals.
Figure 1: Strictness of employment protection for individual dismissals, 2013

Source: OECD StatExtract.
Average effective retirement age by gender in the PIGS, 1970 – 2012
27 Jul 2015 Leave a comment
in currency unions, economic history, Euro crisis, fiscal policy, labour economics, labour supply Tags: ageing society, demographics crisis, economics of retirement, female labour force participation, Greece, Italy, male labour force participation, old age pensions, older workers, Portugal, social insurance, Social Security, Spain, taxation and labour supply
Figure 1 shows a relatively distinct pattern for men in the PIGs. Portugal aside, there has been a long decline retirement ages. This is different to the Anglo-Saxon countries where effective retirement ages have been increasing in recent years for men.
Figure 1: average effective retirement age (5-year averages), men, Portugal, Italy, Greece and Spain, 1970 – 2012

Source: OECD Pensions at a Glance.
Figure 2 shows that apart from Greece, that after a long decline in female effective retirement ages, there was something the rebound, especially in Italy and Portugal. In Greece, the rebound was in the 80s, followed by a resumption of decline from the mid 90s.
Figure 2: average effective retirement age (5-year averages), women, Portugal, Italy, Greece and Spain, 1970 – 2012

Source: OECD Pensions at a Glance.
Doing business in the PIGS (Portugal, Italy, Greece and Spain) – World Bank rankings
03 Jul 2015 Leave a comment
in applied price theory, applied welfare economics, currency unions, economic growth, economics of bureaucracy, economics of regulation, Euro crisis, health and safety, income redistribution, industrial organisation, labour economics, law and economics, minimum wage, occupational regulation, property rights, Public Choice, rentseeking, survivor principle, unions, welfare reform Tags: cost of doing business, Eurosclerosis, Greece, Italy, PIGS, Portugal, Spain
Figure 1: Doing Business rankings, PIGS, 2014

Source: World Bank Doing Business 2015.
All in all, Italy and Greece are a dog of a place to enforce a contract. The long-suffering taxpayer is better off paying taxes in Greece than in Italy! Not surprisingly, trading across borders is the greatest strength in doing business in the PIGS. The European Union does have some benefits.
Figure 2: Doing Business rankings, Greece and Italy, 2014

Source: World Bank Doing Business 2015.
All in all, Italy and Greece are equally bad places to do business and Italy is much worse when it comes to taxes. About the only saving graces of Italy is the registration of property and the protection of minority interests in companies.
Figure 3: Doing Business rankings, Spain and Portugal, 2014

Source: World Bank Doing Business 2015.
Spain and in particular Portugal are much better places to do business than Italy and Greece.
Real GDP Portugal, Italy, Greece and Spain (PIGS) – 1955 to 2013
06 May 2015 Leave a comment
in currency unions, economic growth, Euro crisis, macroeconomics Tags: Eurosclerosis, Greece, Italy, PIGS, Portugal, Spain
Figure 1: Real GDP per Portuguese, Italian, Greek and Spaniard aged 15-64, converted to 2013 price level with updated 2005 EKS purchasing power parities, 1955-2013

Source: Computed from OECD Stat Extract and The Conference Board, Total Database, January 2014, http://www.conference-board.org/economics
Figure 2: Real GDP per Portuguese, Italian, Greek an Spaniard aged 15-64, converted to 2013 price level with updated 2005 EKS purchasing power parities, 1.9 per cent detrended, 1955-2013

Source: Computed from OECD Stat Extract and The Conference Board, Total Database, January 2014, http://www.conference-board.org/economics
Note that a flat line in figure 2 is growth in real GDP for that year at 1.9%; a rising line is above trend rate of growth; and a falling line is below trend rate growth for that year.
The PIGS had three distinct phases in their post-war growth. Rapid growth up until about the mid 70s. Growth at about the trend rate of growth of 1.9% until about 2000 in the case of Italy. This was followed by slow decline then rapid decline after the global financial crisis.
Figure 3: Real GDP per Italian aged 15-64, converted to 2013 price level with updated 2005 EKS purchasing power parities, 1.9 per cent detrended, 1955-2013

Source: Computed from OECD Stat Extract and The Conference Board, Total Database, January 2014, http://www.conference-board.org/economics
Greece had a different story with the long decline between 1979 to 1995. This was followed by 10 good years of growth followed by sharp decline with the onset of the global financial crisis.
Figure 4: Real GDP per Greek aged 15-64, converted to 2013 price level with updated 2005 EKS purchasing power parities, 1.9 per cent detrended, 1955-2013

Source: Computed from OECD Stat Extract and The Conference Board, Total Database, January 2014, http://www.conference-board.org/economics
Portugal was in a boom In the 1980s and 1990s followed by what borders on a depression since about 2000.
Figure 5: Real GDP per Portuguese aged 15-64, converted to 2013 price level with updated 2005 EKS purchasing power parities, 1.9 per cent detrended, 1955-2013

Source: Computed from OECD Stat Extract and The Conference Board, Total Database, January 2014, http://www.conference-board.org/economics
Spain had a pretty good run from the mid-1980s until the eve of the global financial crisis with somewhat above trend growth after a period of decline in the 1970s.
Figure 6: Real GDP per Spaniard aged 15-64, converted to 2013 price level with updated 2005 EKS purchasing power parities, 1.9 per cent detrended, 1955-2013

Source: Computed from OECD Stat Extract and The Conference Board, Total Database, January 2014, http://www.conference-board.org/economics
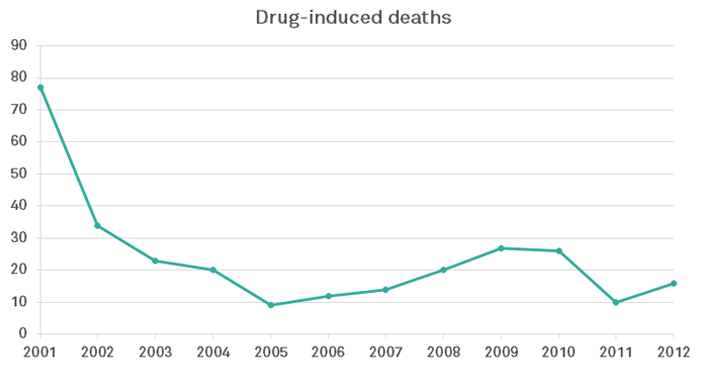
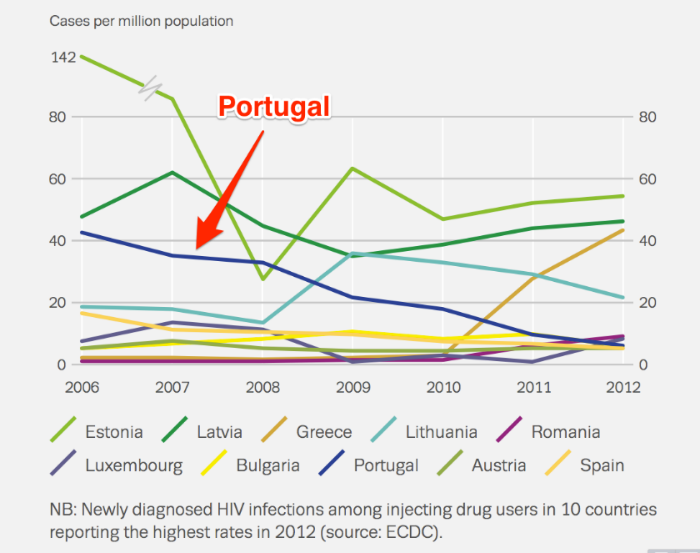
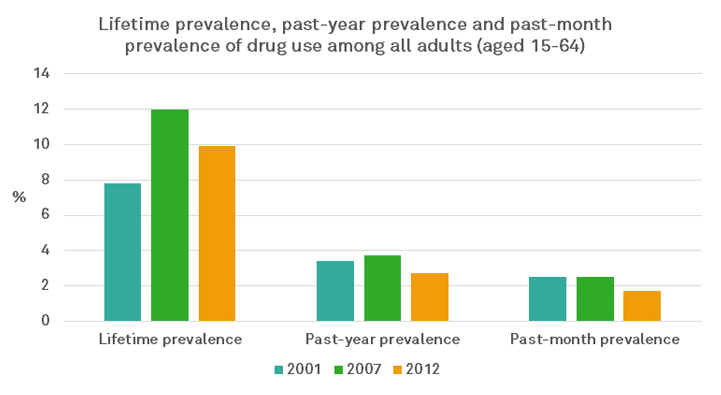
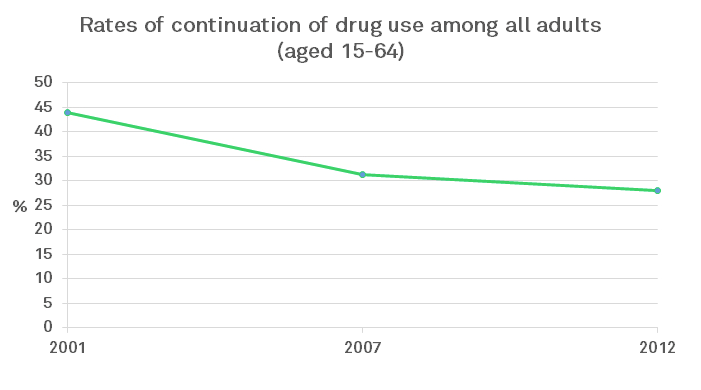
14 Years After Decriminalizing All Drugs, Here’s What Portugal Looks Like – Mic
02 Mar 2015 Leave a comment
What were they thinking? NZ government super fund loses the lot on loan to already failing bank in one of the PIGS.
20 Feb 2015 Leave a comment
in economics of bureaucracy, entrepreneurship, financial economics, politics - New Zealand Tags: active investing, corruption, euro crisis, Index of Economic Freedom, junk bonds, passive investing, Portugal, risk diversification, state owned enterprises

A Portuguese bank on the verge of collapse – what were they thinking?
That would have been the response of many newspaper readers this morning upon learning the New Zealand Superannuation Fund has lost nearly $200 million in taxpayers’ cash on a "risk-free" loan it provided to Lisbon-based Banco Espirito Santo (BES) on July 3.
The loan – part of a US$784 million credit package US investment bank Goldman Sachs put together through its Oak Finance vehicle – was made exactly one month before Portugal’s central bank broke up BES and split the country’s biggest lender into two, with one part holding the good assets and the toxic assets placed in the other.
Unfortunately, the Oak Finance loan is now stranded in the so-called "bad bank" following a retrospective law change by the Bank of Portugal.
Christopher Adams: What were they thinking? – Business – NZ Herald News.

This is what the 2015 index of Economic Freedom has to say about Portugal on the rule of law:
In 2013, the OECD expressed concern over Portugal’s reluctance to crack down on foreign bribery, particularly in regard to its former colonies Brazil, Angola, and Mozambique.
Since 2001, Portugal had officially acknowledged only 15 bribery allegations, and there had been no prosecutions. The judiciary is constitutionally independent, but staff shortages and inefficiency contribute to a considerable backlog of pending trials.

The war on drugs: Drug induced mortality rates compared
18 Dec 2014 Leave a comment
in applied welfare economics, comparative institutional analysis, economics of regulation, political change, politics - Australia, politics - New Zealand, politics - USA Tags: drug decriminalisation, marijuana decriminalisation, Portugal, war on drugs

Recent Comments