Women’s Retirement Age in different Countries
15 Mar 2016 Leave a comment
in gender, labour economics, labour supply Tags: ageing society, demographic crisis, old-age pension, older workers, retirement ages
@BernieSanders has the type of friends that make you prefer your enemies
22 Feb 2016 Leave a comment
in applied price theory, fiscal policy, labour economics, labour supply, macroeconomics, politics - USA Tags: 2016 presidential election, ageing society, cranks, demographic crisis, older workers, quackery, rational ignorance, rational irrationality
The economist costing the economic plan of a 74-year-old candidate forgot there is an ageing society in his labour force participation rate projections.

Source: Gerald Frieldman (2016).
Expected years in retirement by gender in the G7 countries, Australia and New Zealand
19 Feb 2016 Leave a comment
in labour economics, labour supply, politics - Australia, politics - New Zealand, politics - USA Tags: ageing society, demographic crisis, old age pensions, older workers

Source: OECD Pensions at a Glance 2015.
Effective labour market exit age by gender in the G7 countries, Australia and New Zealand
19 Feb 2016 Leave a comment
in labour economics, labour supply, politics - Australia, politics - New Zealand, politics - USA, population economics Tags: ageing society, gender gap, old age pensions, older workers, social insurance, welfare state

Source: OECD Pensions at a Glance 2015.
.
New Zealand male labour force participation, ages 50 to 74, 5 year age bands, 1986 – 2014
08 Feb 2016 Leave a comment
in labour economics, labour supply, politics - New Zealand, public economics Tags: old-age pension, older workers, social insurance
Older workers in the past was defined by a drop-off in labour force participation at the age of 55 such as there was in the 1990s. Not only that is no more, New Zealand workers aged 60 to 64 participate in the labour force to the same extent as workers in their 50s, more or less.

Source: OECD Stat.
Workers aged 65 to 69 and aged 70 to 74 also rapidly increased their labour force participation. Nonetheless, in New Zealand they still get an old age pension in these age brackets without an income test or an asset test.
Female labour force participation rate, workers aged 65 to 69, US, UK, Australia and New Zealand since 1960
06 Feb 2016 Leave a comment
in gender, labour economics, labour supply, politics - New Zealand, public economics Tags: ageing society, labour demographics, old age pensions, older workers, social insurance
The phased increase in the eligibility age for the New Zealand old pension from 60 to 65 from the mid-1990s obviously carried through to the labour force participation of women over 65 as well.

Data extracted on 05 Feb 2016 05:13 UTC (GMT) from OECD.Stat.
Female labour force participation rate, workers aged 60 to 64, USA, UK, Australia and New Zealand since 1960
06 Feb 2016 Leave a comment
in economic history, labour economics, labour supply, politics - New Zealand, public economics Tags: ageing society, labour demographics, old-age pension, older workers, social insurance, welfare state
The increase in the eligibility age from the age of 60 to the age of 65 for the old age pension in New Zealand clearly sparked an explosion in female labour force participation between these ages.

Data extracted on 05 Feb 2016 04:49 UTC (GMT) from OECD.Stat.
Income sources of older people in USA, Canada, France, Germany, Australia and New Zealand
18 Dec 2015 Leave a comment
in labour economics, labour supply, public economics Tags: economics of retirement, old-age pension, older workers, social insurance, welfare state

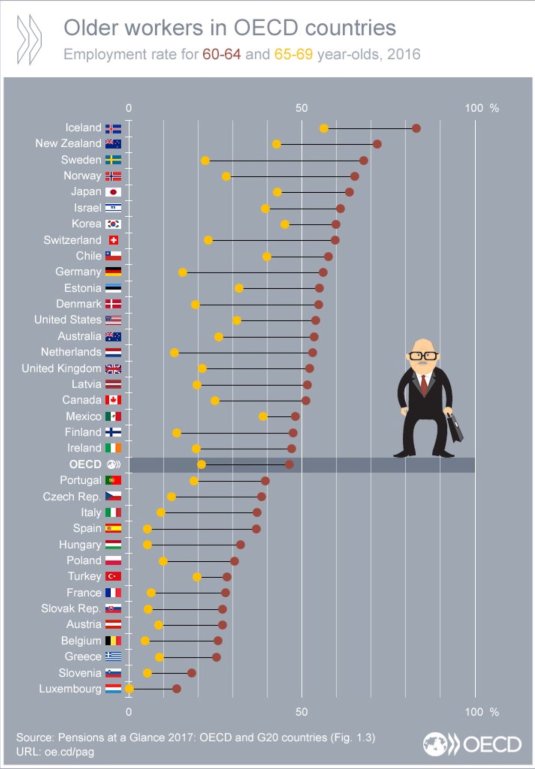
What proportion of 60-64 yr olds are working?
09 Dec 2015 Leave a comment
in labour economics, labour supply Tags: ageing society, older workers
The Chinese demographic crisis is now
26 Aug 2015 Leave a comment
in development economics, economic history, growth disasters, growth miracles, labour economics, labour supply, population economics Tags: ageing society, China, demographic crisis, older workers
China's massive economic advantage over the world is about to disappear read.bi/1MkYx1p http://t.co/Fw9zmMTuVx—
BI Markets (@themoneygame) August 11, 2015
Average effective retirement age by gender in the PIGS, 1970 – 2012
27 Jul 2015 Leave a comment
in currency unions, economic history, Euro crisis, fiscal policy, labour economics, labour supply Tags: ageing society, demographics crisis, economics of retirement, female labour force participation, Greece, Italy, male labour force participation, old age pensions, older workers, Portugal, social insurance, Social Security, Spain, taxation and labour supply
Figure 1 shows a relatively distinct pattern for men in the PIGs. Portugal aside, there has been a long decline retirement ages. This is different to the Anglo-Saxon countries where effective retirement ages have been increasing in recent years for men.
Figure 1: average effective retirement age (5-year averages), men, Portugal, Italy, Greece and Spain, 1970 – 2012

Source: OECD Pensions at a Glance.
Figure 2 shows that apart from Greece, that after a long decline in female effective retirement ages, there was something the rebound, especially in Italy and Portugal. In Greece, the rebound was in the 80s, followed by a resumption of decline from the mid 90s.
Figure 2: average effective retirement age (5-year averages), women, Portugal, Italy, Greece and Spain, 1970 – 2012

Source: OECD Pensions at a Glance.
Average effective retirement ages by gender in the USA, UK, Germany and France, 1970 – 2012
25 Jul 2015 1 Comment
in economic history, gender, labour economics, labour supply, politics - USA Tags: ageing society, British economy, demographic crisis, economics of retirement, effective retirement ages, female labour force participation, female labour supply, France, Germany, male labour force participation, male labour supply, old age pensions, older workers, retirement ages, social insurance, Social Security, welfare state
Figure 1 shows a divergence from a common starting point in 1974 effective retirement ages. The French in particular were the first to put their feet up and start retiring by the age of 60 by the early 1990. There was also a sharp increase in the average effective retirement age for men in the UK over a short decade. After that, British retirement ages for men started to climb again in the late 1990s. Figure 1 also shows that the gentle taper in the effective retirement age for American men stopped at the 1980s and started to climb again in the 2000s. The German data is too short to be of much use because of German unification. France only recently stopped seeing its effective retirement age fall and it is slightly increased recently – see figure 1
Figure 1: average effective retirement age for men, USA, UK, France and Germany, 1970 – 2012, (five-year average)

Source: OECD Pensions at a Glance.
Figure 2 shows similar results for British and American women as for men in the same country shown in figure 1 . That is, falling effective retirement ages for both British and American women in the 1970s and 1980s followed by a slow climb again towards the end of 1990s. French effective retirement ages for women followed the same pattern as for French retirement ages for men – a long fall to below the age of 60 with a slight increase recently. The German retirement data suggest that effective retirement ages for German women is increasing.
Figure 2: average effective retirement age for women, USA, UK, France and Germany 1970 – 2012, (five-year average)

Source: OECD Pensions at a Glance.
Average effective retirement ages by gender, Australia and New Zealand, 1970 – 2012
24 Jul 2015 1 Comment
in economic history, labour economics, labour supply, politics - Australia, politics - New Zealand Tags: ageing society, Australia, demographic crisis, economics of retirement, effective retirement ages, female labour force participation, female labour supply, male labour force participation, male labour supply, old age pensions, older workers, retirement ages, social insurance, Social Security, welfare state
Figures 1 and 2 shows a sharp increase in the average effective retirement age for men and women in both Australia and New Zealand between 1970 and 1990. After that, retirement ages for men in both countries stabilised for about a decade. effective retirement age than Australia.
Figure 1: average effective retirement age for men, Australia and New Zealand, 1970 – 2012, (five-year average)

Source: OECD Pensions at a Glance.
Interestingly, in the 1970s and 1980s, New Zealand had an old-age pension scheme, known as New Zealand Superannuation, whose eligibility age was lowered from 65 to 60 in one shot in 1975. This old-age pension in New Zealand had no income test or assets test, but there was for a time a small surcharge on any income of pensioners. Nonetheless, New Zealand had a higher effective retirement age than in Australia where the old-age pension eligibility age is 65 with strict income and assets tests.
Figure 2: average effective retirement age for women, Australia and New Zealand, 1970 – 2012, (five-year average)

Source: OECD Pensions at a Glance.
Figure 1 and figure 2 also shows that the sharp increase in effective retirement ages in New Zealand for both men and women after the eligibility age for New Zealand’s old-age pension was increased from 60 to 65 over 10 years.
Figures 1 and 2 also show the gradual increase in effective retirement ages for Australian men and women from the end of the 1990s.

Recent Comments