The best the Minister for Economic Development, Steven Joyce, could do in response to my recent report on corporate welfare was nit-picking. Joyce said my definition of corporate welfare was flawed and that spending on R&D will grow the economy. He said
“To brand things like tourism promotion and building cycle-ways as corporate welfare is, I think, creative but not accurate at all.”
just somebody picking out a whole bunch of government programmes that in many cases don’t involve payments to firms at all…
Those that do involve payments to firms are specifically designed to encourage the development for example of the business R&D industry. Politicians don’t choose them.
Payments in kind are business subsidies. R&D is so important to the economy that the last thing you want is its direction to be biased by funding from government. Bureaucrats have a conservative bias and do not fund oddballs and long shots. The oddballs and hippies in the picture below could only afford the photo because they won a radio competition in Arizona.
The R&D expenditure that was criticised in my report was commercialisation, not basic research, which was specifically praised. Which research to commercialise is for entrepreneurs.
There is no reason whatsoever to think bureaucrats administering R&D subsidy budgets set by politicians are any better than private entrepreneurs at picking the next big thing.
If bureaucrats were any good at picking winners, were any good at beating the market, they would go work for a hedge fund on an astronomically better salary package. The salary package of one top hedge fund manager exceeds the entire payroll budget of most New Zealand government departments including those administering R&D subsidies and other hand-outs.
Government expenditure in vital areas such as innovation should be justified on the basis of cost-benefit ratios and a rationale for why bureaucrats have superior access to information about the entrepreneurial prospects of unproven technologies and product prototypes.
Subsidies should not be defended because of their popularity and sexiness as Mr Joyce did for the film industry, tourism promotion and ultra-fast broadband
If they told New Zealanders that in their view tourism promotion should be cancelled, the film industry should close down, that their shouldn’t be any ultra-fast broadband…I don’t think people would be that enamoured with it.
On irrigation funding, Mr. Joyce cited a report by NZIER that found irrigation contributes $2.2 billion to the economy. Irrigation is a private good which can funded by pricing it properly including the recovery of capital costs. There is no case for a subsidy.
Public goods have spillovers, private goods such as water and irrigation do not. Users can fund the irrigation themselves buying as little or as much water as they are willing to pay out for out their own pockets. The NZIER report noted that it was not about the case for public funding:
… we are not able to quantify the environmental or social impacts if irrigation had never occurred. We also do not attempt to investigate the relative merits of public versus private sector funding of the schemes.
If only Paul Ehrlich had been right! Population explosion would have meant an explosion in people who could invent new technologies and populate in much larger markets to provide an incentive to invent new products.
Among Paul Ehrlich’s many analytical errors, he did not take into account that more people meant more inventors and more untapped markets.
Jones argued that in the very long run the only way to have further innovation is to have more people. If there are more people undertaking R&D and more people to populate the markets for those inventions, there will be further growth because the decreasing returns to knowledge creation will be overcome by having more R&D workers.
Jones attributes much of the growth in the 20th century to one-off effects that cannot be repeated such as putting more people into higher education:
… growth in educational attainment, developed-economy R&D intensity, and population are all likely to be slower in the future than in the past. These factors point to slower growth in US living standards.
Second, a counterbalancing factor is the rise of China, India, and other emerging economies, which likely implies rapid growth in world researchers for at least the next several decades.
Third, and more speculatively, the shape of the idea production function introduces a fundamental uncertainty into the future of growth. For example, the possibility that artificial intelligence will allow machines to replace workers to some extent could lead to higher growth in the future.
A larger population increases the rate of technological progress by increasing the number of geniuses and other creative people.The doomsday prophecies about the population bomb never took that into account. That is why they are wrong.
Michael Reddell was right to run his sceptical eye over the enthusiasm of the New Zealand government for promoting local R&D. Politicians are obsessed with boffins in lab coats who invent thing rather than the entrepreneurs who risk import technologies and adapt them to local markets.
New Zealand is a technology follow-up. 99% of global R&D is undertaken abroad. The key innovation policy question for New Zealand is how to adopt those technologies rather than how to invent them.
Appropriate institutions and distance for the global technological frontier
As technology followers such as New Zealand approach the global technological frontier, the institutions appropriate for continued productivity growth change.
As a country moves closer to the global technological frontier, the impact of each successive technology import will decline. The latest imported technology is usually a smaller and smaller upgrade on before. A more skilled workforce and greater entrepreneurship is needed to squeeze out all of the available productivity and product quality gains from the latest imported technologies.
The institutions appropriate to further growth are context-dependent
The political, tax and regulatory institutions that favour the more ready-made implementation of more standardised imported technologies do not necessarily favour the growing demand for the domestic innovations in New Zealand as the global technological frontier nears. There is a growing demand for more highly skilled workers to master and adapt the leading-edge technologies to the distinctive circumstances of each New Zealand workplace to stay ahead in rapidly changing competitive environments and meet the changing needs of customers.
Productivity growth is not manna from heaven. Every increase in productivity and in product quality and variety are the sum of many inventions that must be first discovered by prospective innovators building on past ideas and developed, tested, adopted and adapted by profit-minded entrepreneurs and workers. Investments in R&D, in human capital and in on-the job learning and in the entrepreneurial judgments about risking investments in the new technologies that all underpin further growth in productivity are all influenced by public policies.
Moving from implementation-based to innovation-based policy regimes
As a country approaches the global technology frontier, continued technological imitation is no longer enough to keep productivity growing at the trend rate of two per cent per year. There must be an institutional switch from a technology implementation-based policy regime to an innovation-based policy regime.
The end by 1990 of the EU’s productivity convergence on the USA has been partly attributed to not making the policy shift from technology implementation enhancing institutions to innovation enhancing institutions. EU members invested far less than the USA in R&D and tertiary education had more rigid labour and product markets, had less entry and exit of firms, and much higher taxes.
Institutions must adapt to distance from the technological frontier
As a country approaches the global technology frontier, there must be younger firms, fewer incumbents, better educated workers, more R&D, more entry and exit, more flexible product and labour markets and lower taxes. These dynamic entrepreneurial features were not common-place in pre-1984 New Zealand.
New Zealand too had to switch to institutions that enhanced innovation and entrepreneurial entry just to return to growing at the global trend rate of 2 per cent per year. The political, tax and regulatory institutions appropriate prior to 1973 when New Zealand was a colonial farm for the UK are different to the institutions that are growth-enhancing in a less sheltered economic environment. There is no reason to suppose that the rising burden of knowledge and product proliferation has in any way ebbed to lighten the pressure for continued reform.
The institutional foundations of prosperity and stagnation
Questions about greater prosperity of New Zealand must be correctly posed and should focus on the fundamental causes of productivity growth rather than the proximate causes. The proximate causes of productivity and prosperity are the accumulation of more human and physical capital and technological progress.
Institutions are the fundamental cause of prosperity and cross-country differences in per capita incomes. Institutions determine the incentives and constraints on working, learning and investing, and influence, in a profound way, investments in physical and human capital and R&D and the importing of new technologies. It is premature to conclude that the national institutions and policies of OECD member countries are fairly similar and that the institutional differences that they do have are minor in their impact on respective national productivity and income levels.
There have been periods of prosperity, divergence, depression, recovery, catch-up and no catch-up at difference times in OECD member countries and usually for country-specific reasons. These large changes in fortune are not by chance. The differences in policy that gave rise to these divergences in income levels and extended periods of prosperity and stagnation should be open to analysis so that policy improvements can be discovered for possible application in New Zealand.
The Productivity Hub is a partnership of agencies which aims to improve how policy can contribute to the productivity performance of the New Zealand economy and the wellbeing of New Zealanders. The Hub Board is made up of representatives from the Productivity Commission, the Ministry of Business, Innovation and Employment, Statistics New Zealand and the Treasury
The Productivity Hub yesterday hosted a symposium in Wellington with the title “Growing more innovative and productive Kiwi firms”. “Growing” things is usually something gardeners do – people doing stuff to things. So the title perhaps carried somewhat unfortunate connotations of successful firms being the products of government action. That probably wasn’t their intention, at least not wholly, but then again it wasn’t entirely out of line with the list of attendees – 161 names, of whom at least 150 would have been bureaucrats, academics, and the like. There appeared to be only a very…
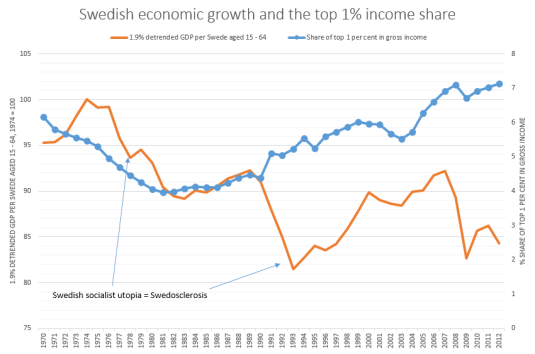
A fall in the share of the top 1% of total Swedish total incomes was in tune with the emergence of a new word in the English language which was Swedosclerosis. That was the long stagnation in the Swedish economy in the 1970s and the 1980s with Swedish economic growth well below that in the trend rate of growth in the USA. Only after an increase in the top 1% share in Sweden did economic growth start recovering to trend.
In the chart above, a flat-line in real GDP per working age Swede is growth at the trend rate of the US economy for the 20th century which was 1.9% per year. A falling line is Swedish growth below trend, a rising line is growth above that trend rate of 1.9% in Sweden. A trend rate of 1.9% is the trend rate of growth currently used by Edward Prescott for the USA in the 20th century.
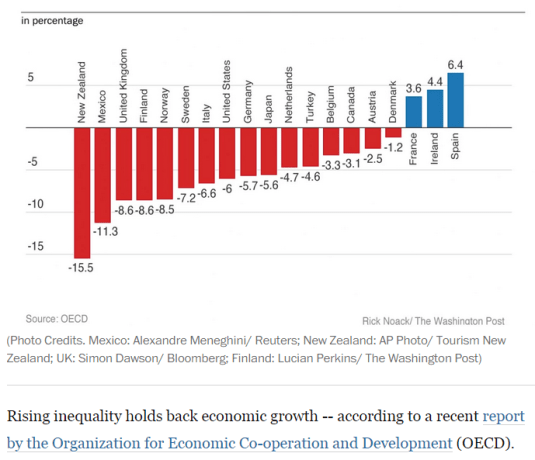
According to the OECD, it is all about the ability to lower middle class and working class families to finance the human capital investments of their children. The OECD theory of inequality and lower growth is there is a financing constraint because of inequality that reduces economic growth because of less human capital accumulation by lower income families.
There are a few common patterns in economic growth. All high-income countries have near-universal K-12 public education to build up human capital, along with encouragement of higher education. All high-income countries have economies where most jobs are interrelated with private and public capital investment, thus leading to higher productivity and wages. All high-income economies are relatively open to foreign trade.
In addition, high-growth economies are societies that are willing to allow and even encourage a reasonable amount of disruption to existing patterns of jobs, consumption, and ownership. After all, economic growth means change.
One of the findings of the Coleman report in the 1960s, which is been pretty much backed up since then such as by top labour economists such as James Heckman, is family background is the key to skills development in children, not the quality of their schools or their access to finance for higher education.
Schools work with what families present to them in terms of innate ability, and personality traits such as to pay attention and work. There is not much difference between an average bad public school and an average good public school when it comes to getting on in life. Going to really bad public school is different from just going to an average bad public school in terms of the chaos imposes on a child’s education and upbringing. What matters is the home environment rather than the ability to access good schools and families of ordinary means to finance higher education for their teenagers.
Most of the skill gaps that are present at the age of 18 – skill gaps which substantially explain gaps in adult earnings and employment in all groups – are also present at the age of five (Cunha and Heckman 2007). There is much evidence to show that disadvantaged children have lower levels of soft skills (non-cognitive skills): motivation, persistence, self-discipline, the ability to work with others, the ability to defer gratification and plan ahead, etc. (Heckman 2008). Most of the skills that are acquired at school build on these soft skills that are moulded and reinforced within the family.
In 2002, with Pedro Carneiro, James Heckman showed that lack of access to credit is not a major constraint on the ability of young Americans to attend college. Short-term factors such as the ability to borrow to fund higher education has been found to be seriously wanting as an explanation for who and who does not go on to higher education.
Only a small percentage of young people are in any way constrained from going on to higher education because of the lack of money. This is not surprising in any society with student loans freely available at low or zero rates without any need to post collateral. Heavily subsidised tuition fees and cheap student loans have been around for several generations.
The biggest problem with the OECD hypothesis linking a lack of skill development within lower income and working class families is it is such an easy problem to solve for the ambitious politician of either the left or the right by throwing money at the problem. Schooling until the age of 16 has been free for a century and universities have been virtually free for at least two generations. Lack of access to a good education does not cut it as the explanation for large disparities in growth rates.
The OECD and more recently the IMF have placed a lot of weight in access to human capital as a driver of inequality because human capital accumulation is hypothesised to be a major driver of economic growth.
The evidence that human capital is a key contributor to higher economic growth is weakening rather than strengthening. If human capital accumulation is not a major driver of productivity growth and productivity disparities, the inequality and growth hypothesis of the OECD and the IMF based on access to finance for human capital accumulation does not get out of the gate. Moreover, as Aghion said:
Economists and others have proposed many channels through which education may affect growth–not merely the private returns to individuals’ greater human capital but also a variety of externalities.
For highly developed countries, the most frequently discussed externality is education investments’ fostering technological innovation, thereby making capital and labour more productive, generating income growth. Despite the enormous interest in the relationship between education and growth, the evidence is fragile at best.
The trend rate of productivity growth did not accelerate over the 20th century despite a massive rise in investments in human capital and R&D because of the rising cost of discovering and adapting new technological knowledge. The number of both R&D workers and highly educated workers increased many-fold over the 20th century in New Zealand and other OECD member countries including the global industrial leaders such as the USA, Japan and major EU member states.
Cross-country differences in total factor productivity are due to differences in the technologies that are actually used by a country and the degree in the efficiency with which these technologies are used. Differences in total factor productivity, rather than differences in the amount of human capital or physical capital per worker explain the majority of cross-country differences in per capita real incomes (Lucas 1990; Caselli 2005; Prescott 1998; Hall and Jones 1999; Jones and Romer 2010).
Differences in the skills of the individual worker or in the total stock of human capital of all workers in a country cannot explain cross national differences in value added per worker at the industry level.
The USA competes with Japan for productivity leadership in many manufacturing industries.
The Japanese services sector productivity can be as little as a one-third of that of the USA.
Japanese labour productivity is almost twice Germany’s in producing automobiles and is better that Germany by a large margin for many other manufactured goods.
The USA is uniformly more productive in services sector labour productivity. For example, British, French and German telecom workers were 38 to 56 per cent as productive as their American counter-parts.
The USA, Japan, France, the UK and Germany all have relatively well-educated, experienced and tested labour forces. For example, the 1993 McKinsey’s study inquired into the education and skills levels of Japanese and German steel workers. Comparably skilled German steel workers were half as productive as their Japanese counterparts (Prescott and Parente 2000, 2005).
The ability to finance human capital accumulation and go to good schools is a weak theory of inequality. Human capital accumulation itself is a weak theory of growth unless linked to sophisticated theories of the institutions fostering innovation and technology absorption which it now is.
…cutting prices by 40 to 50 percent in the United States will lead to between 30 and 60 percent fewer R and D projects being undertaken in the early stage of developing a new drug. Relatively modest price changes, such as 5 or 10 percent, are estimated to have relatively little impact on the incentives for product development – perhaps a negative 5 percent.
Why Evolution is True is a blog written by Jerry Coyne, centered on evolution and biology but also dealing with diverse topics like politics, culture, and cats.
“We do not believe any group of men adequate enough or wise enough to operate without scrutiny or without criticism. We know that the only way to avoid error is to detect it, that the only way to detect it is to be free to inquire. We know that in secrecy error undetected will flourish and subvert”. - J Robert Oppenheimer.


Recent Comments