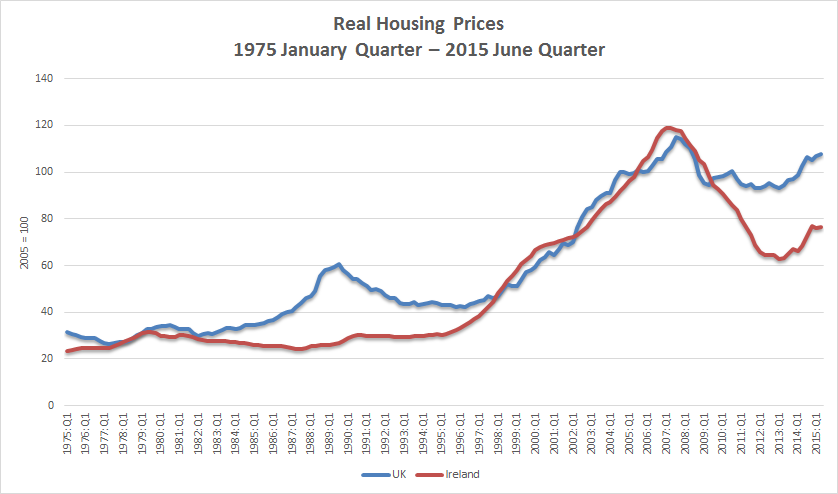
Source and notes: International House Price Database – Dallas Fed June 2015; nominal housing prices for each country is deflated by the personal consumption deflator for that country.
Celebrating humanity's flourishing through the spread of capitalism and the rule of law
18 Oct 2015 Leave a comment
in applied price theory, applied welfare economics, economic history, economics of regulation, urban economics Tags: British politics, housing prices, Ireland, land supply, land use planning, zoning
Source and notes: International House Price Database – Dallas Fed June 2015; nominal housing prices for each country is deflated by the personal consumption deflator for that country.
19 Jul 2015 Leave a comment
in business cycles, economic growth, economic history, fiscal policy, job search and matching, labour economics, macroeconomics, unemployment Tags: Celtic Tiger, equilibrium unemployment rate, Eurosclerosis, Germany, Ireland, Italy, natural unemployment rate, Rance, Spain
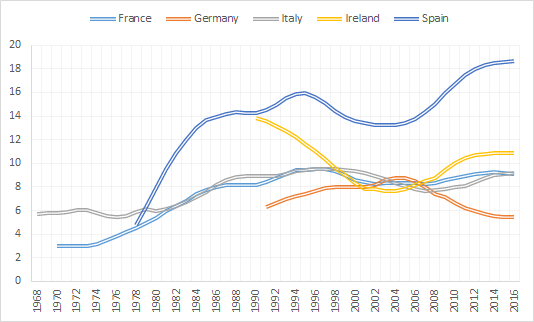
Figure 1 shows large contrasts in time path of equilibrium unemployment rates. For example, French and Italian equilibrium unemployment rates haven’t changed much since about 1986.
Figure 1: equilibrium unemployment rates, France, Germany, Italy, Ireland and Spain, 1968 – 2016
Source: OECD Economic Outlook June 2015 via OECD StatExtract..
Figure 1 also shows some fortuitous ups and downs in the German equilibrium unemployment rate. This estimate was available only from after German unification.
The equilibrium German unemployment rate rose from 6% to above 8% on the eve of the global financial crisis. Fortunately for Germany, major labour market reforms brought the equilibrium unemployment rate down as Germany moved into the global financial crisis.
The Spanish equilibrium unemployment rate had been terrible since about 1980, started to fall in the 1990s, then skyrocketed even before the onset of the global financial crisis – see figure 1.
There have been ups and downs in the Irish equilibrium unemployment rate – see figure 1. It was as high as 14% at the end of the Irish great depression of the 1970s and 1980s. The equilibrium Irish unemployment rate was 8% at the heyday of the Celtic tiger then slowly rose in the lead up to the global financial crisis.
07 Jul 2015 Leave a comment
in currency unions, economic history, macroeconomics, monetary economics Tags: British economy, British politics, currency boards, free banking, Ireland, Scotland, Scottish independence
Since 1844, the Bank of Scotland, Clydesdale Bank and The Royal Bank of Scotland have been allowed to issue banknotes in denominations of £5, £10, £20, £50 and £100. Only the Royal Bank of Scotland continues to issue a small volume of £1 notes. Two Northern Irish banks have similar prerogatives.

These Scottish banknotes are not legal tender in England. No banknotes have legal tender status in Scotland, whether issued by Scottish banks or the Bank of England. The Bank of England says:
Scottish and Northern Ireland banknotes are fully backed at all times by ring-fenced backing assets partly held in Bank of England notes and UK coin, and partly as balances on accounts maintained by the issuing banks at the Bank of England.
Consequently, holders of genuine Scottish and Northern Ireland banknotes have the same level of protection as that available to holders of genuine Bank of England notes.
The acceptability of any means of payment, including banknotes, is essentially a matter for agreement between the parties involved in a transaction in Scotland.

Bank of England keeps control Scottish bank notes in issue by stipulating that the issuing bank hold in their reserves the same amount of UK money (either in cash or on deposit at the Bank of England) as the Scottish notes they issue. These reserves could easily be converted to a currency board.
The Hong Kong currency board has operated successfully through 30 years of financial turbulence and radical constitutional change. There is no reason why a Scottish currency board could not do likewise, guaranteeing the convertibility of a Scots pound, initially at parity with the English pound sterling.

After independence, Ireland acted effectively as a currency board until the 1970s. Currency boards were commonplace throughout the British Empire and were highly successful.
Under the Currency Act 1927, the Saorstát Pound (Free State Pound) was created at parity with the British Pound Sterling. A Currency Commission kept British government securities, sterling cash, and gold to keep a 1:1 relationship between the two currencies.
Although a Central Bank of Ireland was created in 1943, the Irish punt remained linked to sterling with the central bank operated as a de facto currency board policy until joining the European Exchange Rate Mechanism in 1979.
A currency board has no capacity to act as a lender of last resort to a Scottish banking system.
22 Jun 2015 Leave a comment
in labour economics, politics - Australia, politics - New Zealand, politics - USA, population economics, poverty and inequality, welfare reform Tags: Australia, British economy, Canada, child poverty, economics of the family, family poverty, Ireland, single mothers, single parents
Figure 1: Child poverty rates by family type, Anglo-Saxon countries, 2010
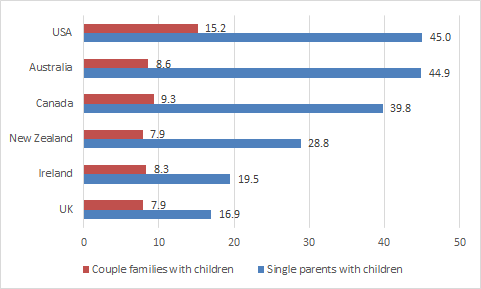
Source: OECD Family Database; Poverty thresholds are set at 50% of the median income of the entire population.
21 Jun 2015 Leave a comment
in economics of love and marriage, labour economics, labour supply, law and economics, politics - Australia, politics - New Zealand, politics - USA, population economics, poverty and inequality, welfare reform Tags: Australia, British economy, Canada, child poverty, economics of families, family poverty, Ireland, labour force participation, single parents
Figure 1: child poverty rates in couple families by employment status, Anglo-Saxon countries, 2010
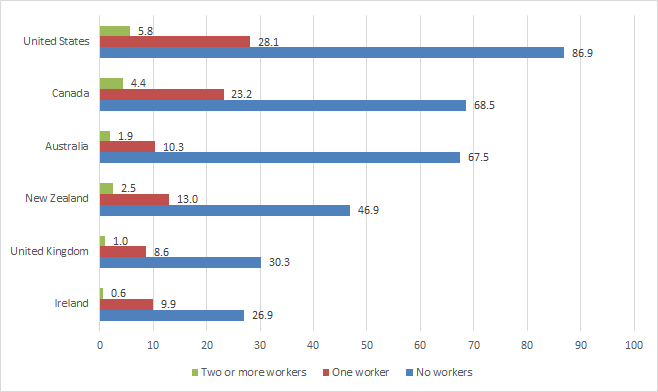
Source: OECD Family Database; Poverty thresholds are set at 50% of the median income of the entire population.
20 Jun 2015 Leave a comment
in labour economics, politics - Australia, politics - New Zealand, politics - USA, poverty and inequality, welfare reform Tags: Australia, British economy, Canada, child poverty, economics of the family, family poverty, female labour force participation rates, Ireland, maternal labour supply, single mothers, single parents
Figure 1: Child poverty rate by employment status of single parent, Anglo-Saxon countries, 2010
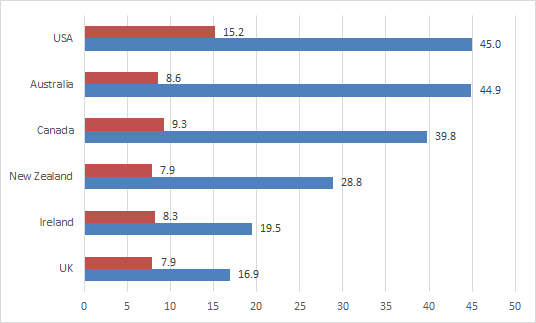
Source: OECD Family Database; Poverty thresholds are set at 50% of the median income of the entire population.
14 Jun 2015 Leave a comment
in discrimination, economics of education, gender, human capital, labour economics, labour supply, occupational choice, politics - Australia, politics - New Zealand, politics - USA Tags: Australia, British economy, Canada, College premium, education premium, gender wage gap, Ireland
Figure 1: % population who have attained at least tertiary education, age 25 – 34 by gender (2012)
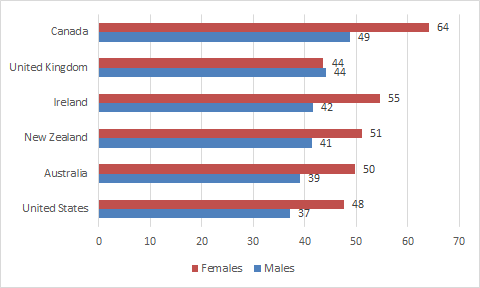
Source: OECD family database.
Figure 2 shows that the stark reversing of the gender gap in educational attainment shown in figure 1 was somewhat more recent in the US, UK and to a lesser extent in Ireland and Australia. In the UK and USA, educational attainment by gender was pretty equal for the earlier generation of graduates as compared to today’s 25 to 34-year-olds. The reversing of the gender gap in educational attainment dates back several decades in Canada and New Zealand.
Figure 2: % population who have attained at least tertiary education, age 45 – 54 by gender (2012)
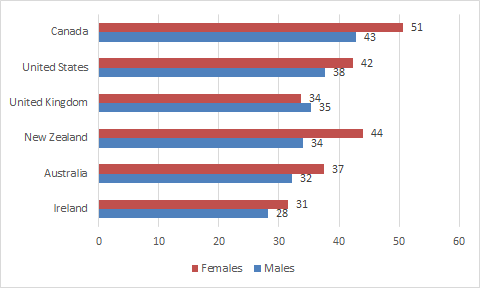
Source: OECD family database.
13 Jun 2015 Leave a comment
in discrimination, gender, human capital, labour economics, labour supply, occupational choice, politics - Australia, politics - New Zealand, politics - USA, poverty and inequality Tags: asymmetric marriage premium, Australia, British economy, Canada, gender wage gap, Ireland, labour demographics, maternal labour supply
In another blow for the inherent inequality of bargaining power between workers and employers, and for the patriarchy, the wage gap is larger for tertiary educated female full-time workers aged 35-44 than it is for female full-time workers who just finished high school.
Figure 1: gender wage gap for mean full-time, full-year earnings for tertiary educated workers aged 35 – 44, 2012
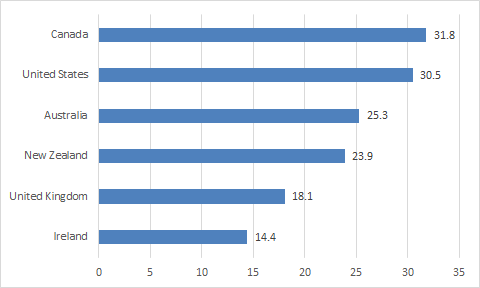
Source: OECD family database.
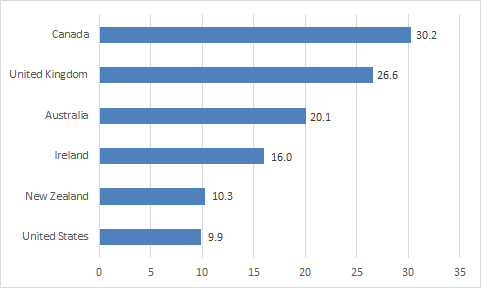
To add insult to injury, the gender wage gap further tertiary educated female workers is quite large in the USA but quite small for high school graduates.
Figure 2: gender wage gap for mean full-time, full-year earnings for below upper secondary educated workers aged 35 – 44, 2012
Source: OECD family database.
Canada seems to be a bit of a patriarchal hellhole while New Zealand does pretty well in gender wage gaps.
The gender gap in figure 1 and in figure 2 are unadjusted and calculated as the difference between mean average annual full-time, full-year earnings of men and of women as a percentage of men’s earnings.
12 Jun 2015 Leave a comment
in discrimination, gender, human capital, labour economics, labour supply, occupational choice, politics - Australia, politics - New Zealand, politics - USA Tags: Australia, British economy, Canada, gender wage gap, Ireland
If there is an inherent inequality of bargaining power between workers and employers, as we are so frequently lectured by those in the self appointed know, why is the gender wage gap so small at the bottom of the earnings distribution?
Figure 1: % Gender gap in full-time earnings at the bottom decile of earnings distribution, 2012

Source: OECD family database
Figure 2: % Gender gap in full-time earnings at the median decile of earnings distribution, 2012

Source: OECD family database
Figure 3: % Gender gap in full-time earnings at the top decile of earnings distribution, 2012

Source: OECD family database
The gender gaps are unadjusted, and are calculated as the difference between the earnings of men and women for their respective earnings percentile.
11 Jun 2015 Leave a comment
in discrimination, gender, human capital, labour economics, labour supply, occupational choice, politics - Australia, politics - New Zealand, politics - USA Tags: Australia, British economy, Canada, gender wage gap, Ireland
Figure 1: % gender gap in median earnings of full-time employees, 2012

Source: OECD family database
05 Jun 2015 Leave a comment
in labour economics, minimum wage, public economics Tags: Australia, British economy, Canada, Ireland, progressive taxation, taxation and the labour supply, welfare state
Figure 1: Minimum wage after income tax and social security contributions, US$ PPP, Anglo-Saxon countries, 2013

09 May 2015 Leave a comment
in economic growth, economic history, great depression, job search and matching, labour economics, labour supply, macroeconomics, unemployment Tags: British economy, Celtic Tiger, Ireland, prosperity and depression, sick man of Europe, unemployment rates
Source: OECD StatExtract
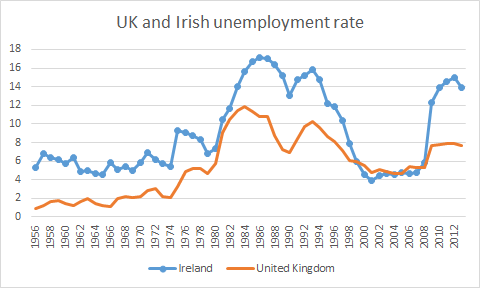
Ireland and Britain justly earned the name the sick man of Europe in the 1980s. Irish unemployment was in the mid teens much of the 1980s because the Irish economy was in a great depression from 1973 to 1992.
Unemployed people are defined as those who report that they are without work, that they are available for work and that they have taken active steps to find work in the last four weeks. The ILO Guidelines specify what actions count as active steps to find work; these include answering vacancy notices, visiting factories, construction sites and other places of work, and placing advertisements in the press as well as registering with labour offices.
07 May 2015 1 Comment
in business cycles, economic growth, economic history, entrepreneurship, global financial crisis (GFC), great depression, macroeconomics Tags: British disease, British economy, Celtic Tiger, Ireland, prosperity and depression, sick man of Europe
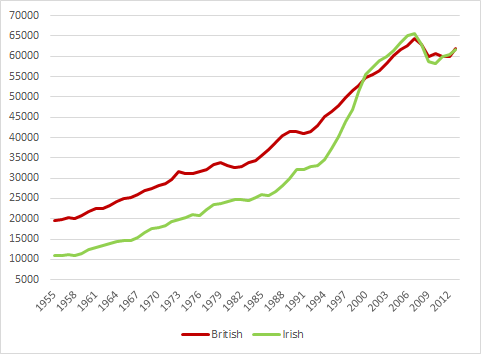
Figure 1: Real GDP per British and Irish aged 15-64, converted to 2013 price level with updated 2005 EKS purchasing power parities, 1955-2013
Source: Computed from OECD Stat Extract and The Conference Board, Total Database, January 2014, http://www.conference-board.org/economics
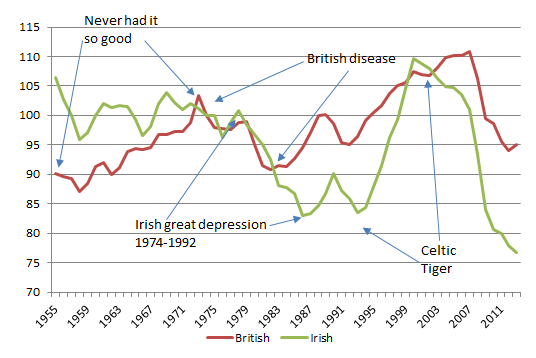
Figure 2 detrends British real GDP growth since 1955 by 1.9% and Irish real GDP growth by 3.6%. The US real GDP growth in the 20th century is used as the measure of the global technological frontier growing at trend rate of 1.9% in the 20th century. The Irish economy is more complicated story because its growth rate in figure 2 was detrended at a rate of 3.6% because it was catching up from a very low base. Trend GDP growth per working age Irish for 1960-73 was 3.6 per cent (Ahearne et al. 2006).
Figure 2: Real GDP per British and Irish aged 15-64, converted to 2013 price level with updated 2005 EKS purchasing power parities, 1.9 per cent detrended UK, 3.6% detrended Ireland, 1955-2013
Source: Computed from OECD Stat Extract and The Conference Board, Total Database, January 2014, http://www.conference-board.org/economics
A flat line in figure 2 indicates growth at 1.9% for that year. A rising line in figure 2 means above-trend growth; a falling line means below trend growth for that year.
In the 1950s, Britain was growing quickly that the Prime Minister of the time campaigned on the slogan you never had it so good.
By the 1970s, and two spells of labour governments, Britain was the sick man of Europe culminating with the Winter of Discontent of 1978–1979. What happened? The British disease resulted in a 10% drop in output relative to trend in the 1970s, which counts as a depression – see figure 2 .
Prescott’s definition of a depression is when the economy is significantly below trend, the economy is in a depression. A great depression is a depression that is deep, rapid and enduring:
The British disease in the 1970s bordered on a depression. There was then a strong recovery through the early-1980s with above trend growth from the early 1980s until 2006 with one recession in between in 1990. So much for the curse of Thatchernomics?
Figure 1 suggests a steady economic course in Ireland until the 1990s with a growth explosion growth with the Irish converged on British living standards up until the global financial crisis.
Figure 2 shows the power of detrending GDP growth and why Ireland was known as the sick man of Europe in the 1970s and 1980s with unemployment as high as 18% and mass migration again. The Irish population did not grow for about 60 years from 1926 because of mass migration.
Figure 2 shows that real GDP growth per working age Irish dropped below its 3.6 per cent trend for nearly 20 years from 1974 , but more than bounced back after 1992. The deepest trough was 18 per cent below trend and the final trough was in 1992 – see Figure 2.
The deviation from trend economic growth made the Irish depression from 1973 to 1992 comparable in depth and length to the 1930s depressions (Ahearne et al. 2006).
The Irish depression of 1973 to 1992 can be attributed to large increases in taxes and government expenditure and reduced productivity (Ahearne et al. 2006). There were two oil price shocks in the 1970s and many suspect Irish policy choices from 1973 to 1987.
There were three fiscal approaches: an aggressive fiscal expansion from 1977; tax-and-spend from 1981; and aggressive fiscal cuts from 1987 onwards. In the early 1980s, Irish CPI inflation at 21 per cent, public sector borrowing reached 20 per cent of GNP.
To rein in budget deficits, taxes as a share of GNP rose by 10 percentage points in seven years. The unemployment rate reached 17 per cent despite a surge in emigration. The rising tax burden raised wage demands, worsening unemployment. Government debt grew on some measures to 130 per cent of GNP in 1986 (Honohan and Walsh 2002).
From 1992, Ireland rebounded to resume catching-up with the USA. The Celtic Tiger was a recovery from a depression that was preceded by large cuts in taxes and government spending from the late 1980s (Ahearne et al. 2006). Others reach similar conclusions but avoid the depression word. Fortin (2002, p. 13) labelled Irish public finances in the 1970s and to the mid-1980s as a ‘black hole’.
Fortin (2002) and Honohan and Walsh (2002) disentangle the Irish recovery into a long-term productivity boom that had dated from the 1950s and 1960s, and a sudden short-term output and employment boom since 1993 following the late 1980s fiscal and monetary reforms.
Honohan and Walsh (2002) wrote of belated income and productivity convergence. The delay in income and productivity convergence came from poor Irish economic and fiscal policies in the 1970s and 1980s.
This was after economic reforms in the late 1950s and the 1960s that started a process of rapid productivity convergence after decades of stagnation and mass emigration; Ireland’s population was the same in 1926 and 1971. During the 1950s, up to 10 per cent of the Irish population migrated in 10 years.
In the 1990s, many foreign investors started invested in Ireland as an export platform into the EU to take advantage of a 12.5 per cent company tax rate on trading profits. Between 1985 and 2001, the top Irish income tax rate fell from 65 to 42 per cent, the standard company tax from 50 to 16 per cent and the capital gains tax rate from 60 to 20 per cent (Honohan and Walsh 2002).
What happened after the onset of the global financial crisis in Ireland and the UK are for a future blog posts.
31 Oct 2014 5 Comments
in fiscal policy, global financial crisis (GFC), macroeconomics, monetary economics Tags: GFC, Ireland
I am planning to blog on why the Irish economic crisis of recent years was caused exclusively by government, and in particular, government responses that made an ordinary recession into a depression

This is a graph courtesy of the Institute of Public Affairs in Melbourne, an impressive Australian thinktank.
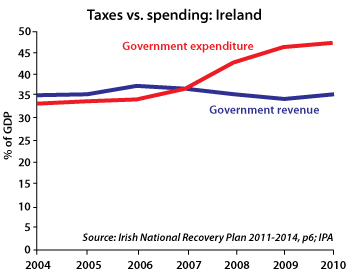
It comes from the Irish government’s own 140 page ‘National Recovery Plan‘ published last week.
It is amazing reading.
Naysayers try to tell you that the Celtic Tiger was a myth and that free-market policies brought the Irish economy down.
The truth is exactly the opposite. Liberalisation caused the Irish economy to surge until a return to big government crushed it. Membership of the eurozone, poor banking regulation and the government guarantee of…
View original post 34 more words
Celebrating humanity's flourishing through the spread of capitalism and the rule of law
Celebrating humanity's flourishing through the spread of capitalism and the rule of law
Celebrating humanity's flourishing through the spread of capitalism and the rule of law
Celebrating humanity's flourishing through the spread of capitalism and the rule of law
Celebrating humanity's flourishing through the spread of capitalism and the rule of law
Celebrating humanity's flourishing through the spread of capitalism and the rule of law
Celebrating humanity's flourishing through the spread of capitalism and the rule of law
Celebrating humanity's flourishing through the spread of capitalism and the rule of law
A History of the Alt-Right
Econ Prof at George Mason University, Economic Historian, Québécois
Celebrating humanity's flourishing through the spread of capitalism and the rule of law
Scholarly commentary on law, economics, and more
Beatrice Cherrier's blog
Celebrating humanity's flourishing through the spread of capitalism and the rule of law
Celebrating humanity's flourishing through the spread of capitalism and the rule of law
Celebrating humanity's flourishing through the spread of capitalism and the rule of law
Why Evolution is True is a blog written by Jerry Coyne, centered on evolution and biology but also dealing with diverse topics like politics, culture, and cats.
Celebrating humanity's flourishing through the spread of capitalism and the rule of law
A rural perspective with a blue tint by Ele Ludemann
DPF's Kiwiblog - Fomenting Happy Mischief since 2003
Celebrating humanity's flourishing through the spread of capitalism and the rule of law
The world's most viewed site on global warming and climate change
Tim Harding's writings on rationality, informal logic and skepticism
A window into Doc Freiberger's library
Let's examine hard decisions!
Commentary on monetary policy in the spirit of R. G. Hawtrey
Thoughts on public policy and the media
Celebrating humanity's flourishing through the spread of capitalism and the rule of law
Politics and the economy
A blog (primarily) on Canadian and Commonwealth political history and institutions
Reading between the lines, and underneath the hype.
Economics, and such stuff as dreams are made on
"The British constitution has always been puzzling, and always will be." --Queen Elizabeth II
Celebrating humanity's flourishing through the spread of capitalism and the rule of law
Celebrating humanity's flourishing through the spread of capitalism and the rule of law
WORLD WAR II, MUSIC, HISTORY, HOLOCAUST
Undisciplined scholar, recovering academic
Celebrating humanity's flourishing through the spread of capitalism and the rule of law
Res ipsa loquitur - The thing itself speaks
In Hume’s spirit, I will attempt to serve as an ambassador from my world of economics, and help in “finding topics of conversation fit for the entertainment of rational creatures.”
Researching the House of Commons, 1832-1868
Articles and research from the History of Parliament Trust
Reflections on books and art
Posts on the History of Law, Crime, and Justice
Celebrating humanity's flourishing through the spread of capitalism and the rule of law
Exploring the Monarchs of Europe


Recent Comments