I said on #Marr that poorest have done best & richest worst under Cameron so far. For those asking, here's the proof: pic.twitter.com/tJk3av6jp7
— Fraser Nelson (@FraserNelson) October 11, 2015
@HackneyAbbott @JeremyCorbyn4PM Another bad day for British ruling class
11 Oct 2015 Leave a comment
in economic history, income redistribution, labour economics, Marxist economics, Public Choice, public economics, rentseeking Tags: British economy, top 1%, Twitter left
dodgy @OECD paper on inequality & growth doing the Twitter Left rounds again
05 Oct 2015 1 Comment
in economic growth, economic history, economics of education, human capital, politics - New Zealand, politics - USA, population economics, poverty and inequality Tags: economics of personality traits, economics of schools, education premium, endogenous growth theory, IMF, James Heckman, Leftover Left, OECD, student loans, top 1%, Twitter left
Rick Noack did a great job in the Washington Post today to concisely summarise the hypothesis behind the OECD’s claim that inequality holds back growth. In the case of New Zealand 15 ½ percentage points of economic growth was lost due to rising equality since the late 1980s.
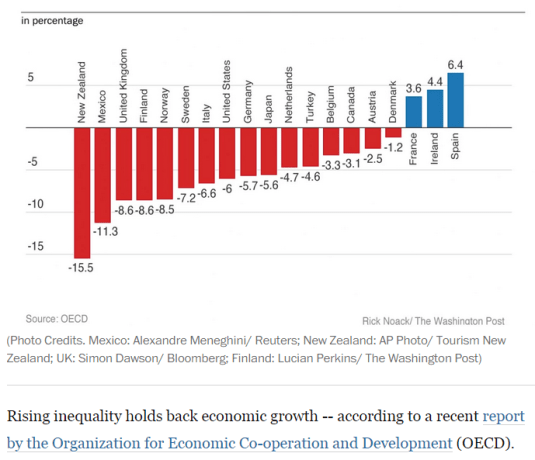
Source: How inequality made these Western countries poorer – The Washington Post.
According to the OECD, it is all about the ability to lower middle class and working class families to finance the human capital investments of their children. The OECD theory of inequality and lower growth is there is a financing constraint because of inequality that reduces economic growth because of less human capital accumulation by lower income families.
Source: How inequality made these Western countries poorer – The Washington Post.
In an age of interest-free student loans or cheap student loans everywhere for several decades now at least, the OECD is nonetheless hanging its head on the notion that not enough has been done to ensure there is enough graduates from the lower middle class and working class families making it to university. Taylor also has the same problem as me with the OECD’s human capital and inequality nexus:
There are a few common patterns in economic growth. All high-income countries have near-universal K-12 public education to build up human capital, along with encouragement of higher education. All high-income countries have economies where most jobs are interrelated with private and public capital investment, thus leading to higher productivity and wages. All high-income economies are relatively open to foreign trade.
In addition, high-growth economies are societies that are willing to allow and even encourage a reasonable amount of disruption to existing patterns of jobs, consumption, and ownership. After all, economic growth means change.
One of the findings of the Coleman report in the 1960s, which is been pretty much backed up since then such as by top labour economists such as James Heckman, is family background is the key to skills development in children, not the quality of their schools or their access to finance for higher education.

Schools work with what families present to them in terms of innate ability, and personality traits such as to pay attention and work. There is not much difference between an average bad public school and an average good public school when it comes to getting on in life. Going to really bad public school is different from just going to an average bad public school in terms of the chaos imposes on a child’s education and upbringing. What matters is the home environment rather than the ability to access good schools and families of ordinary means to finance higher education for their teenagers.
Most of the skill gaps that are present at the age of 18 – skill gaps which substantially explain gaps in adult earnings and employment in all groups – are also present at the age of five (Cunha and Heckman 2007). There is much evidence to show that disadvantaged children have lower levels of soft skills (non-cognitive skills): motivation, persistence, self-discipline, the ability to work with others, the ability to defer gratification and plan ahead, etc. (Heckman 2008). Most of the skills that are acquired at school build on these soft skills that are moulded and reinforced within the family.
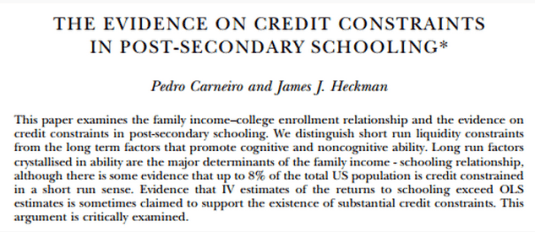
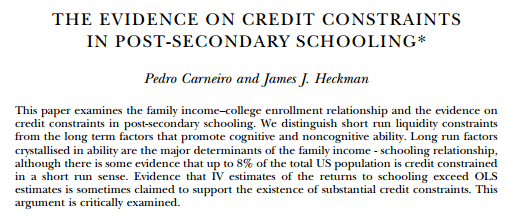
In 2002, with Pedro Carneiro, James Heckman showed that lack of access to credit is not a major constraint on the ability of young Americans to attend college. Short-term factors such as the ability to borrow to fund higher education has been found to be seriously wanting as an explanation for who and who does not go on to higher education.
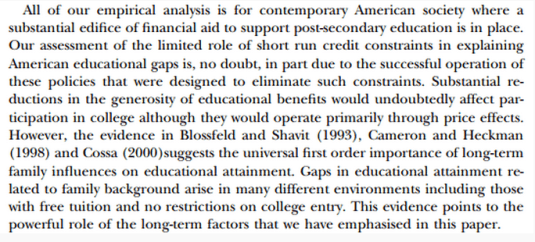
Only a small percentage of young people are in any way constrained from going on to higher education because of the lack of money. This is not surprising in any society with student loans freely available at low or zero rates without any need to post collateral. Heavily subsidised tuition fees and cheap student loans have been around for several generations.

Source: James Heckman.
The biggest problem with the OECD hypothesis linking a lack of skill development within lower income and working class families is it is such an easy problem to solve for the ambitious politician of either the left or the right by throwing money at the problem. Schooling until the age of 16 has been free for a century and universities have been virtually free for at least two generations. Lack of access to a good education does not cut it as the explanation for large disparities in growth rates.

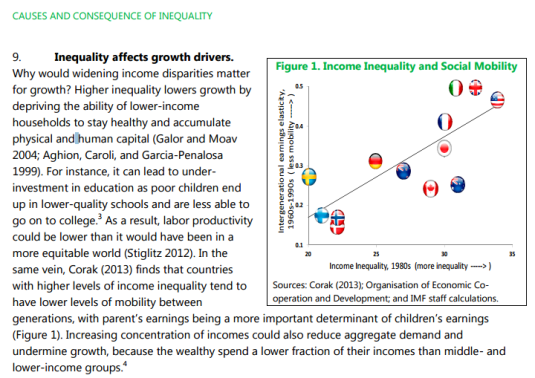
The OECD and more recently the IMF have placed a lot of weight in access to human capital as a driver of inequality because human capital accumulation is hypothesised to be a major driver of economic growth.
The evidence that human capital is a key contributor to higher economic growth is weakening rather than strengthening. If human capital accumulation is not a major driver of productivity growth and productivity disparities, the inequality and growth hypothesis of the OECD and the IMF based on access to finance for human capital accumulation does not get out of the gate. Moreover, as Aghion said:
Economists and others have proposed many channels through which education may affect growth–not merely the private returns to individuals’ greater human capital but also a variety of externalities.
For highly developed countries, the most frequently discussed externality is education investments’ fostering technological innovation, thereby making capital and labour more productive, generating income growth. Despite the enormous interest in the relationship between education and growth, the evidence is fragile at best.
The trend rate of productivity growth did not accelerate over the 20th century despite a massive rise in investments in human capital and R&D because of the rising cost of discovering and adapting new technological knowledge. The number of both R&D workers and highly educated workers increased many-fold over the 20th century in New Zealand and other OECD member countries including the global industrial leaders such as the USA, Japan and major EU member states.
Cross-country differences in total factor productivity are due to differences in the technologies that are actually used by a country and the degree in the efficiency with which these technologies are used. Differences in total factor productivity, rather than differences in the amount of human capital or physical capital per worker explain the majority of cross-country differences in per capita real incomes (Lucas 1990; Caselli 2005; Prescott 1998; Hall and Jones 1999; Jones and Romer 2010).
Differences in the skills of the individual worker or in the total stock of human capital of all workers in a country cannot explain cross national differences in value added per worker at the industry level.
- The USA competes with Japan for productivity leadership in many manufacturing industries.
- The Japanese services sector productivity can be as little as a one-third of that of the USA.
- Japanese labour productivity is almost twice Germany’s in producing automobiles and is better that Germany by a large margin for many other manufactured goods.
- The USA is uniformly more productive in services sector labour productivity. For example, British, French and German telecom workers were 38 to 56 per cent as productive as their American counter-parts.
The USA, Japan, France, the UK and Germany all have relatively well-educated, experienced and tested labour forces. For example, the 1993 McKinsey’s study inquired into the education and skills levels of Japanese and German steel workers. Comparably skilled German steel workers were half as productive as their Japanese counterparts (Prescott and Parente 2000, 2005).
The ability to finance human capital accumulation and go to good schools is a weak theory of inequality. Human capital accumulation itself is a weak theory of growth unless linked to sophisticated theories of the institutions fostering innovation and technology absorption which it now is.
To be fair, I will not point out that this period of rising inequality since 1980s so damned by the OECD and the Twitter Left in the Washington Post today coincided with the return of real wages growth in New Zealand after 20 years of wage stagnation. That would be kicking the Twitter Left when they are down. I was a sneak in a graph instead.
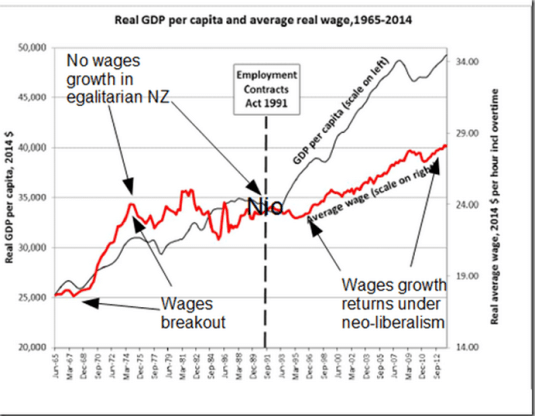
Data source: New Zealand Council of Trade Unions.
I will leave it for your own imagination to think of what happened to female labour force participation, the gender wage gap and female participation in higher education since the late 1980s and the onset of this horrific inequality which was mainly for men.
The failure of the Twitter Left to undertake a gender analysis of any labour force or income statistic they use is a major analytical shortcoming. Hardly any labour force statistics make any sense unless broken down by male and female outcomes.
The IMF’s Causes and Consequences of Income Inequality: A Global Perspective
02 Oct 2015 2 Comments
in entrepreneurship, human capital, industrial organisation, labour supply, occupational choice, politics - USA, poverty and inequality Tags: entrepreneurial alertness, superstar wages, superstars, top 0.01%, top 0.1%, top 1%, working rich
The IMF has joined the OECD in arguing there is an important connection between inequality and who gains from economic growth.
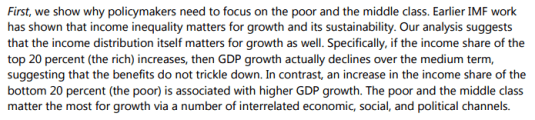
To reach the conclusion that the income distribution matters, the IMF had to tie its master the exact same weak moorings that the OECD did. Specifically the ability of the lower middle class to finance investments in school and higher education.
The IMF has articulated a specific hypothesis that can be confronted with facts and logic.
Many critics of inequality are extremely vague about what exactly is the process that grinds the proletariat down. The withering away of the proletariat in the 20th century has been discussed elsewhere on this blog.
The impact of low income on the ability to accumulate physical and human capital sounds like an interesting question. Not surprisingly, the top labour economists have looked into it.
Short-term factors such as the ability to borrow to fund higher education has been found to be seriously wanting. Only a small percentage of people are in any way constrained from going on to higher education because of the lack of money. This is not surprising in any society with student loans freely available at low or zero rates without any need to post collateral.
Wow. I mean, WOW. College completion figures over time by income quartile. bit.ly/16Bb1jh http://t.co/y0MVyiDCEZ—
Richard V. Reeves (@RichardvReeves) February 04, 2015
The notion that the rich are just replicating the good fortunes of their parents has also fallen on hard times despite the persistence of the OECD and the IMF in championing this old Marxist fantasy.
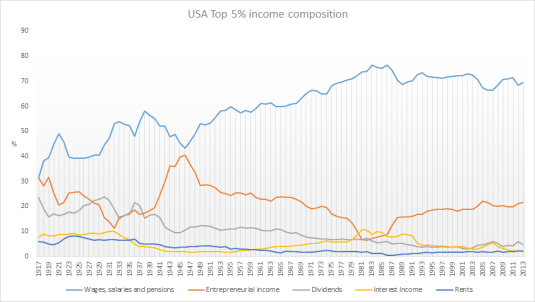
Source: The World Top Incomes Database.
If you look at the income composition of the top 5% of the USA, for example, it is a disappointing story for the IMF and the OECD. Today’s rich are working rich with the majority of their income from wages and salaries and much of the rest from entrepreneurial income. There is no passive rich earning incomes from their inherited investments and grinding the proletariat down.
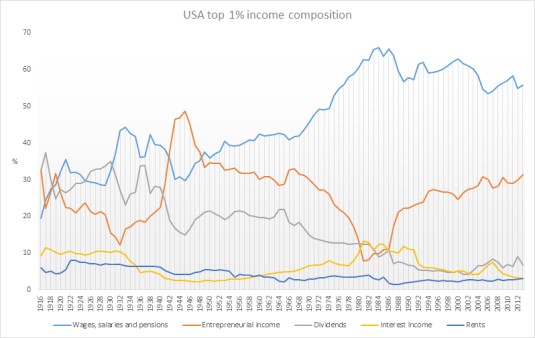
Source: The World Top Incomes Database.
It is the same story with the top 1%. They are working rich with the majority of their incomes paid in wages and salaries and running a business. They are top executives, managers and leading professionals that go to work every day.
Who are today’s supermanagers and why are they so wealthy? equitablegrowth.org/research/today… http://t.co/Ts2OkOUk5g—
Equitable Growth (@equitablegrowth) December 03, 2014
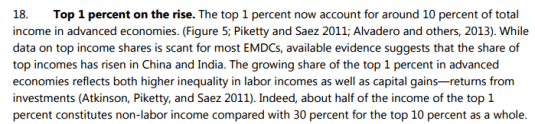
The IMF was simply wrong to claim that at least half the income of the top 1% in the USA was not labour income.
Before 1940, most of the income of the top 0.1% of income earners in the USA was income from investments. By the end of the 20th century, the top 0.1% were earning their incomes as wages and salaries, business incomes and capital gains. Very little of that income of the top 0.1% was in the form of passive income from capital. The top 0.1% of the USA are now working rich – entrepreneurs.
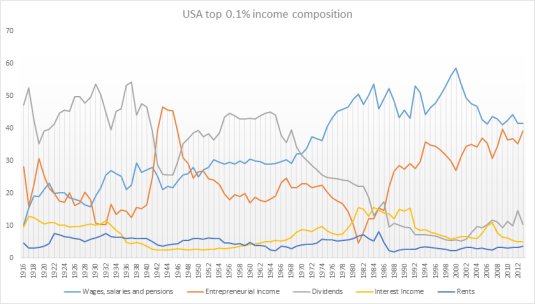
Source: The World Top Incomes Database.
In the good old days of high taxes, the top 0.01% did earn the great majority of their income from passive investment.
Only under the scourge of neoliberalism starting in the 1970s and then massive tax cuts in the Reagan Revolution did the top 0.01% join the working rich. Even the super super-rich have to work for their money these days.
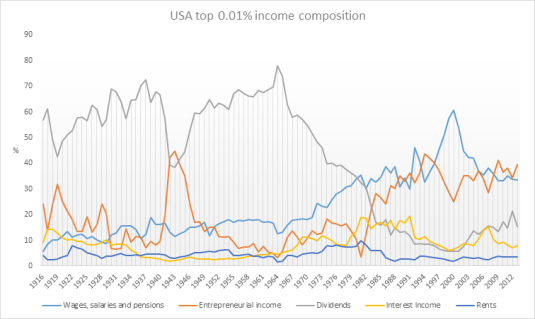
Source: The World Top Incomes Database.
The IMF and before it the OECD were batting from a weak position when they argued that human capital investments of ordinary families is held up by inequality. Student loans to pay for subsidised tuition fees and living expenses solve that problem long ago.
How many of the richest Americans inherited their fortune? Find out. buff.ly/1DNM3g2 http://t.co/QlarE5yAdT—
HumanProgress.org (@humanprogress) August 14, 2015
It was simply wrong of the IMF to claim that the top 5%, 1% and 0.1% of for example the USA are living off the rest of society. In the USA, is usually put forward as the worst-case, the rich and super-rich are working rich making their fortunes by building and running businesses. In The Evolution of Top Incomes: A Historical and International Perspective (NBER Working Paper No. 11955), Thomas Piketty and Emmanuel Saez concluded that:
While top income shares have remained fairly stable in Continental European countries or Japan over the past three decades, they have increased enormously in the United States and other English speaking countries. This rise in top income shares is not due to the revival of top capital incomes, but rather to the very large increases in top wages (especially top executive compensation). As a consequence, top executives (the “working rich”) have replaced top capital owners at the top of the income hierarchy over the course of the twentieth century…
Steven Kaplan and Joshua Rauh make a number of basic points backed up by detailed evidence about top CEO pay:
- While top CEO pay has increased, so has the pay of private company executives and hedge fund and private equity investors;
- ICT advances increase the pay of many – of professional athletes (technology increases their marginal product by allowing them to reach more consumers), Wall Street investors (technology allows them to acquire information and trade large amounts more easily), CEOs and technology entrepreneurs in the Forbes 400; and
- Technology allows top executives and financiers to manage larger organizations and asset pools – a loosening of social norms and a lack of independent control of CEO pacesetting does not explain similar increases in pay for private companies– technology explains it.
The report SuperEntrepreneurs shows that:
- SuperEntrepreneurs founded half the largest new firms created since the end of the Second World War
- There is a strong correlation between high rates of SuperEntrepreneurship in a country and low tax rates
- a low regulatory burden and high rates of philanthropy both correlate strongly with high rates of SuperEntrepreneurship
- Active government and supranational programmes to encourage entrepreneurship – such as the EU’s Lisbon Strategy – have largely failed.
- Yet governments can encourage entrepreneurialism by lowering taxes (particularly capital gains taxes which have a particularly high impact on entrepreneurialism while raising relatively insignificant revenues); by reducing regulations; and by vigorously enforcing property rights.
- High rates of self-employment and innovative entrepreneurship are both important for the economy.
- Yet policy makers should recognise that they are not synonymous and should not assume policies which encourage self-employment necessarily promote entrepreneurship.
John Rawls is often put forward by political progressives as the starting point for political philosophy. Rawls pointed out that behind the veil of ignorance, people will agree to inequality as long as it is to everyone’s advantage. Rawls was attuned to the importance of incentives in a just and prosperous society. If unequal incomes are allowed, this might turn out to be to the advantage of everyone.
Steven Kaplan and Joshua Rauh’s “It’s the Market: The Broad-Based Rise in the Return to Top Talent”, Journal of Economic Perspectives (2013) found that:
- Rising inequality is due to technical changes that allow highly talented individuals or “superstars” to manage or perform on a much larger scale.
- These superstars can now apply their talents to greater pools of resources and reach larger numbers of people and markets at home and abroad. They thus became more productive, and higher paid.
- Those in the Forbes 400 richest are less likely to have inherited their wealth or have grown up wealthy.
- Today’s rich are working rich who accessed education in their youth and then applied their natural talents and acquired skills to the most scalable industries such as ICT, finance, entertainment, sport and mass retailing.
- The U.S. evidence on income and wealth shares for the top 1% is most consistent with a “superstar” explanation. This evidence is less consistent with the gains in earnings of the top 1% coming from greater managerial power over the determination of their own pay in the corporate world, or changes in social norms about what managers could earn.
Today’s super-rich are highly productive because they produce new and better products and services that people want and are willing to pay for. These rewards for entrepreneurship and hard work guide people of different talents and skills into the occupations and industries where their talents are valued the most. The efficient allocation of talent and income maximising occupational choices were important to Rawls’ framework.
The IMF and World Bank should look for policies that remove barriers to riches. Instead, the IMF and OECD are giving support to those who want to tax and regulate the super-rich that drive much of the innovation, entrepreneurship and creative destruction in modern economies.
Are the rich getting richer in the USA?
24 Sep 2015 Leave a comment
in economic history, politics - USA, poverty and inequality Tags: Occupy Wall Street, top 1%
https://twitter.com/Mark_J_Perry/status/646427815693434880/photo/1
We hear a lot about rising income inequality but Census data show it's been stable for 20 yrs
aei.org/publication/th… http://t.co/Cb2u0j97fv—
Mark J. Perry (@Mark_J_Perry) September 22, 2015
How is the top 10% doing?
01 Sep 2015 Leave a comment
in applied welfare economics, human capital, labour economics, poverty and inequality Tags: envy, top 1%
US income distribution
29 Aug 2015 Leave a comment
in applied welfare economics, income redistribution, labour economics, politics - USA, poverty and inequality Tags: top 1%
The incomes of the bottom 99%
28 Aug 2015 Leave a comment
in applied welfare economics, politics - USA, poverty and inequality, Public Choice Tags: top 1%
Average Income for the top 0.01%
24 Aug 2015 Leave a comment
in economic history, entrepreneurship, financial economics Tags: creative destruction, entrepreneurial alertness, top 0.01%, top 0.1%, top 1%
Average Income for the top 0.01% since 1913 bit.ly/1wZhZHE #inequality http://t.co/a6w7xo2Kqq—
Catherine Mulbrandon (@VisualEcon) November 03, 2014
Why some billionaires are bad for growth, and others aren’t
22 Aug 2015 Leave a comment
in applied price theory, applied welfare economics, economics of bureaucracy, economics of regulation, financial economics, income redistribution, industrial organisation, politics - Australia, politics - New Zealand, politics - USA, Public Choice, rentseeking, survivor principle Tags: Australia, billionaires, Russia, top 0.1%, top 1%

…Bagchi and Svejnar carefully went through the lists of all the Forbes billionaires, and divided them into those who had acquired their wealth due to political connections, and those who had not. This is kind of a slippery slope — almost all billionaires have probably benefited from government connections at one time or another.
But the researchers used a very conservative standard for classifying people as politically connected, only assigning billionaires to this group when it was clear that their wealth was a product of government connections. Just benefiting from a government that was pro-business, like those in Singapore and Hong Kong, wasn’t enough.
Rather, the researchers were looking for a situation like Indonesia under Suharto, where political connections were usually needed to secure import licenses, or Russia in the mid-1990s, when some state employees made fortunes overnight as the state privatized assets.
…The negative effects of wealth inequality are largely being driven by politically connected wealth inequality. That seems to be the primary channel that drives this relationship…
a 3.72 percent increase in the level of wealth inequality would cost a country about half a percent of real GDP per capita growth. That’s a big impact, given that average GDP growth is in the neighbourhood of two percent per year
More evidence of mass kidnappings of #occupywallstreet activists
20 Aug 2015 Leave a comment
in applied price theory, human capital, income redistribution, labour economics, labour supply, politics - USA, poverty and inequality, Public Choice, rentseeking, sports economics Tags: expressive voting, Left-wing hypocrisy, Leftover Left, mass kidnappings, Occupy Wall Street, rational ignorance, rational irrationality, superstar wages, superstars, top 0.1%, top 1%
Ratio of Median Salary of Top 25 Highest Paid MLB Player to Avg. Worker Pay Increased from 100:1 to 700:1 Since 1988 http://t.co/5zLktBXS3D—
Mark J. Perry (@Mark_J_Perry) August 18, 2015
More on the rise and the rise of the working super rich
15 Aug 2015 Leave a comment
in applied price theory, applied welfare economics, economic history, entrepreneurship, industrial organisation, survivor principle Tags: antimarket bias, entrepreneurial alertness, superstar wages, superstars, top 0.1%, top 1%, top wage earners
How many of the richest Americans inherited their fortune? Find out. buff.ly/1DNM3g2 http://t.co/QlarE5yAdT—
HumanProgress.org (@humanprogress) August 14, 2015
@WJRosenbergCTU A brief history of rising equality in New Zealand
13 Aug 2015 Leave a comment
in applied price theory, applied welfare economics, economic history, economics of media and culture, income redistribution, labour economics, politics - New Zealand, poverty and inequality, Public Choice Tags: capitalism and freedom, Leftover Left, The Great Enrichment, The Great Fact, top 1%, Twitter left
Bill Rosenberg at the Council of Trade Unions was good enough to tweet a Treasury chart that shows next to no increases in inequality in New Zealand for at least 20 years.
A brief history of inequality-from Treasury paper Fig4. Note Employment Contracts Act,GST,income tax,benefit cuts,WFF http://t.co/y4w3cUsgjD—
Bill Rosenberg (@WJRosenbergCTU) June 27, 2015
Inequality in both market and disposable incomes has been stable for a good 20 years, as the above tweet shows, while inequality in consumption has been falling. To back this interpretation of mine up, coincidentally today Bryan Perry published his annual report on income and inequality under the banner of the Ministry of Social Development.

His report showed that there be no significant increase in New Zealand in at least 20 years.
The taxes paid by the rich, middle-class and the poorer in the USA
09 Aug 2015 Leave a comment
in politics - USA, public economics Tags: creative destruction, entrepreneurial alertness, envy, taxation and entrepreneurship, taxation and investment, taxation and the labour supply, top 1%
Average Income Before & After Federal Taxes from "An Illustrated Guide to Income" bit.ly/1j9ymXF #inequality http://t.co/eabwDATSlU—
Catherine Mulbrandon (@VisualEcon) April 28, 2014
The tax rates of the top 1%
04 Aug 2015 Leave a comment
in applied welfare economics, entrepreneurship, fisheries economics, income redistribution, politics - USA, rentseeking Tags: entrepreneurial alertness, envy, taxation and entrepreneurship, taxation and investment, taxation and the labour supply, top 1%
Historical Tax Rates of Top 0.01% (15,000 returns reporting more than $8 million in 2010) visualizingeconomics.com/blog/2013/8/14… http://t.co/XygW0t0npu—
Catherine Mulbrandon (@VisualEcon) August 15, 2013

Recent Comments