Low Pay Britain? More employees in UK are low paid than in most countries in OECD and Europe resolutionfoundation.org/?post_type=cpt… http://t.co/t2wQQfbRav—
ResolutionFoundation (@resfoundation) October 05, 2015
New Zealand low pay incidence one of lowest in OECD @greencatherine @MaxRashbrooke @nzlabour @dpfdpf
22 Oct 2015 Leave a comment
in applied welfare economics, income redistribution, politics - New Zealand
@BernieSanders @HillaryClinton drug price controls will shorten lives
21 Oct 2015 Leave a comment
in applied price theory, applied welfare economics, economics of regulation, entrepreneurship, health economics, politics - USA Tags: 2016 presidential election, creative destruction, drug lags, entrepreneurial alertness, innovations, intellectual property, patents and copyright, price controls
Drug price controls have populist appeal, but patients are the ones they would hurt the most bit.ly/1X3e742 http://t.co/ulXuGHLSld—
Manhattan Institute (@ManhattanInst) October 17, 2015
German, French and Italian real housing prices since 1975
19 Oct 2015 Leave a comment
in applied price theory, applied welfare economics, economic history, economics of regulation, rentseeking, urban economics Tags: France, Germany, housing affordability, housing prices, Italy, land supply, land use planning, zoning

Source and notes: International House Price Database – Dallas Fed June 2015; nominal housing prices for each country is deflated by the personal consumption deflator for that country.
British and Irish real housing prices since 1975
18 Oct 2015 Leave a comment
in applied price theory, applied welfare economics, economic history, economics of regulation, urban economics Tags: British politics, housing prices, Ireland, land supply, land use planning, zoning

Source and notes: International House Price Database – Dallas Fed June 2015; nominal housing prices for each country is deflated by the personal consumption deflator for that country.
Taxation as a % of GDP in Australia and NZ and New Zealand’s Lost Decades
18 Oct 2015 1 Comment
in applied price theory, applied welfare economics, economic growth, economic history, politics - New Zealand, public economics
Revenue is a percentage of GDP has always been higher in New Zealand as compared to Australia for as far back as data is available. Tax revenue grew by a third as a percentage of GDP between 1965 and 1989 in New Zealand with a sharp spike from 1984 onwards. The growth in tax revenues as percentage of Australian GDP was smoother rather than spikes such as in the mid-1980s in New Zealand.
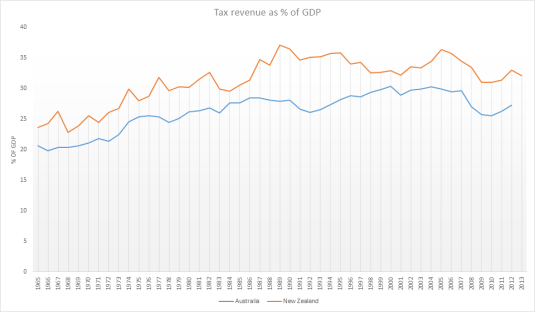
Data extracted on 18 Oct 2015 02:10 UTC (GMT) from OECD.Stat.
Interestingly, this faster growth in the New Zealand tax revenues as a percentage of GDP coincided with the two lost decades of New Zealand growth between 1974 and 1992. Furthermore, the chart below shows that an emerging recovery in labour productivity in the early 1980s stalled when tax revenues started growing again as a percentage of New Zealand GDP.
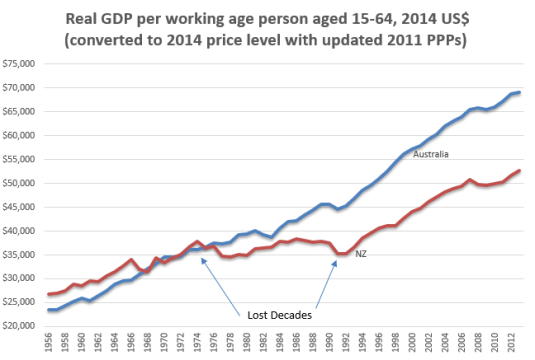
Source: Computed from OECD StatExtract and The Conference Board. 2015. The Conference Board Total Economy Database™, May 2015, http://www.conference-board.org/data/economydatabase/
Between 1974 and 1992, New Zealand lost 34% and productivity against trend of 1.9%. In the chart below, a flat line is growth at a rate equal to the trend rate of growth for the USA in the 20th century which is 1.9%. A falling line indicates growth at less than 1.9% for the year. A rising line means growth in excess of 1.9% for the year. The chart below confirms what the chart above says. Productivity stopped falling in the early 1980s then started falling rapidly at the same time that tax revenues spiked as percentage of GDP in the early 1980s.
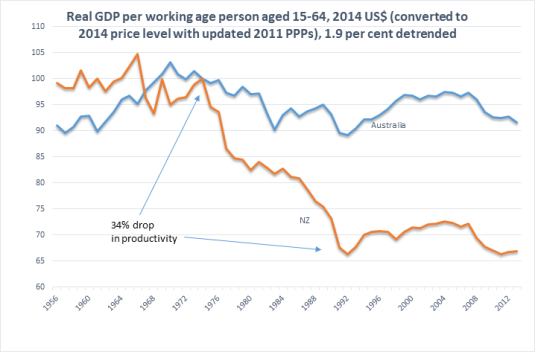
Source: Computed from OECD StatExtract and The Conference Board. 2015. The Conference Board Total Economy Database™, May 2015, http://www.conference-board.org/data/economydatabase/
in the above chart, Australia had pretty steady growth since about 1970. There is a productivity slowdown in the 1970s and above-average growth as the economy recovered from the Keating recession in the early 1990s. The so-called mining boom is hardly noticeable in Australia’s trend growth rate.
Will high marginal tax rates and redistribution fix inequality?
18 Oct 2015 Leave a comment
in applied price theory, applied welfare economics, entrepreneurship, human capital, labour economics, occupational choice, politics - USA, poverty and inequality Tags: Gini coefficient, rational irrationality, taxation and entrepreneurship, taxation and human capital, taxation and labour supply, taxation investment
Does @BernieSanders understand poverty in America?
17 Oct 2015 Leave a comment
in applied welfare economics, politics - USA
Billionaires: You cannot continue to get huge tax breaks while children all over this country go hungry. #BernieInMA http://t.co/wHOeYrRqgc—
Bernie Sanders (@BernieSanders) October 03, 2015
It certainly is expensive in Norway
16 Oct 2015 Leave a comment
in applied welfare economics, economic history

Friends holidayed in Norway recently and paid $10 for a cappuccino. For a welfare state greatly admired by our friends on the Left, the fact that food is very expensive is a big strike against Norway as a workers’ paradise.
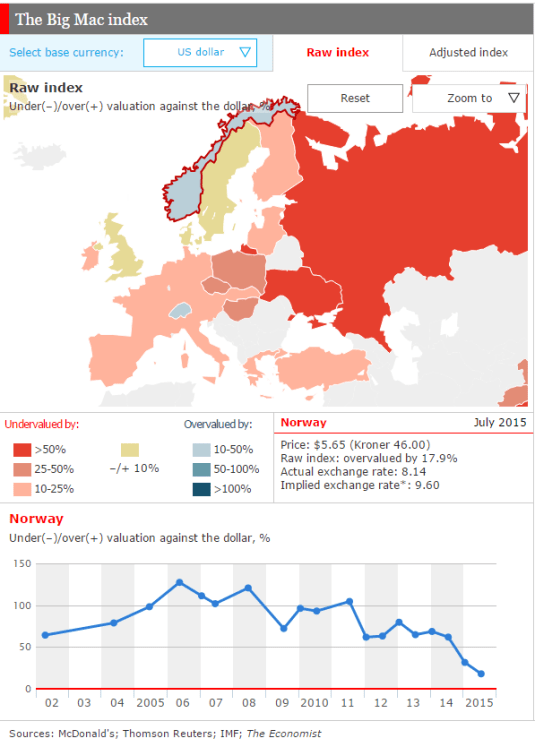
Source: Interactive currency-comparison tool: The Big Mac index | The Economist.
@BernieSanders are the rich getting richer & poor getting poorer or are just men getting their comeuppance?
16 Oct 2015 Leave a comment
in applied welfare economics, economic history, politics - USA Tags: 2016 presidential election, expressive voting, gender wage gap, Leftover Left, middle class stagnation, reversing gender gap, top 1%, Twitter left, wage stagnation
The Typical Male U.S. Worker Earned Less in 2014 Than in 1973: blogs.wsj.com/washwire/2015/… http://t.co/PmTmmfsfbE—
Demos Action (@DemosAction) September 21, 2015
For the first time ever, women are more likely to have bachelor's degrees than men. vox.com/2015/10/13/951… http://t.co/ffK7iiU2Kq—
Demos (@Demos_Org) October 14, 2015
How targeted are the European welfare states?
15 Oct 2015 Leave a comment
in applied welfare economics, poverty and inequality
Not all European welfare states are created equal. Denmark and Norway target a good two thirds or more of its public social benefits to the bottom to income quintiles. Sweden is not far behind as is Finland as targeted welfare states.
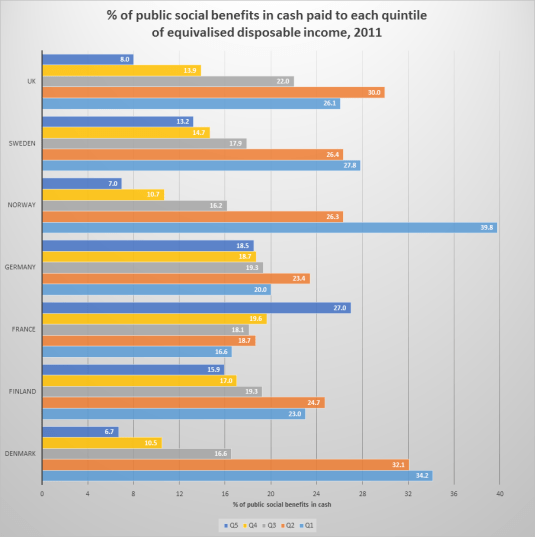
Source: OECD Income Distribution database, via http://oe.cd/idd
Germany by contrast spreads its largess from its welfare state almost identically across the entire income spectrum. France does not seem the see the poor as a priority for the welfare state with larges increasing with the richer you get. The British are a bit messy where they target a quarter of their welfare state to the poor but another 30% of public cash social benefits go to the working poor or whatever they may be called.
% of public cash benefits paid to the bottom income quintile, USA, UK, Australia and New Zealand – corrected
15 Oct 2015 Leave a comment
in applied welfare economics, politics - Australia, politics - New Zealand, politics - USA, poverty and inequality
Australia does far better than any other country in targeting its welfare state to the bottom of the income distribution. Having an old age pension that is asset tested and income tested has a lot to do with that. New Zealand has an old age pension that is not income tested or asset tested. The USA has a contributory social insurance system that also ensures a considerable amount of its public social benefits are paid to the well off because they paid in Social Security taxes.
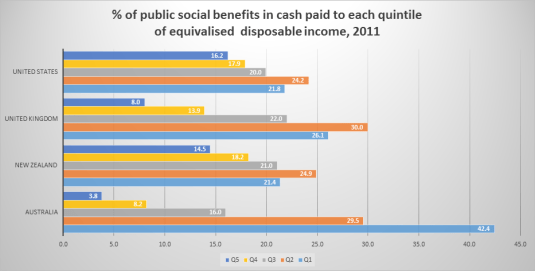
Source: OECD Income Distribution database, via http://oe.cd/idd

50 years of creative destruction in desktops
13 Oct 2015 Leave a comment
in applied welfare economics, economic history, economics of media and culture, entrepreneurship, technological progress Tags: creative destruction, desktops, entrepreneurial alertness, innovation
Computers in 1964 vs. 2014: buff.ly/1NoBa3N http://t.co/4MFBCyk1D3—
HumanProgress.org (@humanprogress) June 28, 2015
How @MaxRashbrooke showed housing costs is the main driver of poverty when trying to argue rising inequality was not driven by housing costs
13 Oct 2015 Leave a comment
in applied welfare economics, economics of regulation, politics - New Zealand, poverty and inequality, Rawls and Nozick, rentseeking, urban economics
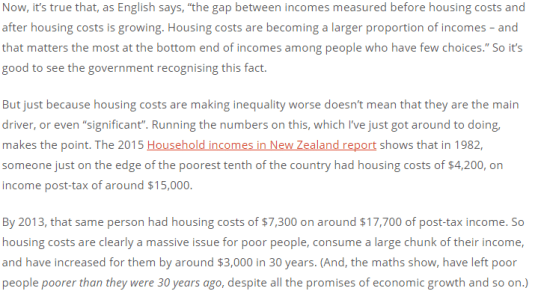
Rashbrooke then goes on to discuss how housing costs were not a main driver of the growing gap between the top 10% and the bottom 10% of the income distribution in New Zealand. My point is he is more concerned with the politics of envy than with building political support for action against poverty.
What children say about poverty #childpovertynz #itsnotchoice http://t.co/vYfxTn7aG7—
Child Poverty NZ (@povertymonitor) September 07, 2015
Rashbrooke showed that the main driver of poverty in New Zealand is rising housing costs. That is easy to redress but for the opposition of the left-wing parties to reforms to the Resource Management Act that will increase the supply of land and thereby drive down housing costs and rents.
Children's views on poverty #childpovertynz occ.org.nz/assets/Uploads… http://t.co/wZHJ19QcpN—
Child Poverty NZ (@povertymonitor) September 08, 2015
Housing costs gobbled up much of the rising incomes of the poor for many years now in New Zealand as Rashbrooke showed today. The New Zealand Labor Party and New Zealand Greens are doing nothing about it. The regulatory constraints on the supply of land could be gone by lunchtime if the self-proclaimed champions of the poor and social justice supported the reform of the RMA.
The proposals of the New Zealand Labour Party and Greens for the government to build more houses is pointless unless there is more land is supplied. If there is no increase in land supply, all the building of more houses by government does is build the same houses of private developers would have built on the same fixed supply of land. There must be an increase in the supply of land to drive housing costs down for the poor.

Creative destruction in car prices
09 Oct 2015 Leave a comment
in applied welfare economics, economic history, industrial organisation Tags: car prices, creative destruction, good old days
A century of progress: cars in 1913 vs. 2013. buff.ly/1OVS1iB #tech #wealth http://t.co/nzmW84la9R—
HumanProgress.org (@humanprogress) October 06, 2015

Recent Comments