Let's take a look at the effects of protectionism through the lens of basic supply and demand http://t.co/LjitADw7nX pic.twitter.com/X7Of0mX4jk
— Marginal Revolution University (@MRevUniversity) August 6, 2015
The scourge of lower prices illustrated
12 Jun 2015 Leave a comment
in applied price theory, applied welfare economics, industrial organisation, international economics, survivor principle Tags: antimarket bias, competition in monopoly, globalisation, import competition, import parity pricing, international trade, The meaning of competition
Have the mass kidnappings extended to Oxfam and other principled ODA activists?
11 Jun 2015 Leave a comment
in applied welfare economics, development economics, economic history, growth disasters, growth miracles, politics - Australia, politics - New Zealand, politics - USA Tags: extreme poverty, global poverty, Left-wing hypocrisy, The Great Enrichment, The Great Escape, The Great Fact
Oxfam and other ODA activists should be dancing in the streets to celebrate the doubling of global median income in the last 10 years.
This is awesome news!!
Global median income has doubled(!) over the last 10 yearsNew paper: bit.ly/1JRwv90 http://t.co/4cq6x5pXpu—
Max Roser (@MaxCRoser) May 17, 2015
The only reason for them not doing this as they must have been kidnapped en mass.
Staggering #inequality: Top 1% will own 50% of world's wealth by 2016. Help us to #EvenItUp! http://t.co/NcNOqVcTgS—
Oxfam International (@Oxfam) March 20, 2015
We can only hope for their safe release.
Securing a just world means challenging the power of the 1% say civil society groups #WSF2015 oxf.am/ZfkL http://t.co/r2S0lkBoC2—
Oxfam New Zealand (@oxfamnz) March 23, 2015
Lower prices for oil/other commodities have intensified the slowdown in dev'ing countries wrld.bg/O9hq8 #GEP http://t.co/2IsmedNmgW—
World Bank Pubs (@WBPubs) June 11, 2015
Composition of the bottom 40% of the population in #LAC countries: wrld.bg/NkKZP #sharedprosperity http://t.co/MdublHSp59—
World Bank Pubs (@WBPubs) June 09, 2015
The extreme poor live in conflict & rural areas: wrld.bg/Nynge #endpoverty http://t.co/43HDDI11JR—
World Bank (@WorldBank) May 31, 2015
Trends in what drives single motherhood
11 Jun 2015 Leave a comment
Divorce used to be biggest engine of single parenthood in America. No more. It's nonmarital childbearing cc@davidfrum http://t.co/J5yZtUukNW—
W Bradford Wilcox (@WilcoxNMP) June 10, 2015
GMO labelling will increase the price of food for the poor
09 Jun 2015 Leave a comment
in applied price theory, applied welfare economics, economics of information, health economics Tags: GMOs, Left-wing hypocrisy
Corporate welfare in New Zealand – 2015 budget update
09 Jun 2015 2 Comments
in applied price theory, applied welfare economics, comparative institutional analysis, economics of bureaucracy, industrial organisation, politics - New Zealand, rentseeking, survivor principle Tags: corporate welfare
I have updated my 2014 report on corporate welfare for the 2015 budget. My report was published today by the Taxpayers’ Union.
My key finding was that corporate welfare increased in the 7th budget of the National Party-led Government from $1.178 billion in its 2014 budget to $1.344 billion in the 2015 budget – see figure 1 and table 1.
Figure 1: Corporate welfare, Budgets 2008/09 to 2015/16

Source: New Zealand budget papers, various years.
Table 1: Corporate welfare in Budgets 2008/09 to 2015/16, $million
| 08/09 | 09/10 | 10/11 | 11/12 | 12/13 | 13/14 | 14/15 | 15/16 | |
| Arts, Culture & Heritage |
3 |
11 |
19 |
10 |
29 |
4 |
4 |
42 |
| Commerce and Consumer Affairs |
6 |
6 |
6 |
6 |
7 |
7 |
6 |
7 |
| Communications |
0 |
25 |
39 |
150 |
178 |
205 |
215 |
190 |
| Economic Development |
372 |
419 |
446 |
379 |
332 |
284 |
280 |
297 |
| Finance |
16 |
44 |
3 |
108 |
15 |
210 |
0 |
0 |
| Primary Industries |
700 |
0.3 |
14 |
0.0 |
43 |
65 |
77 |
180 |
| Science and Innovation |
0 |
4 |
0 |
0 |
0 |
112 |
219 |
269 |
| Tourism |
76 |
94 |
119 |
113 |
98 |
124 |
124 |
121 |
| Transport |
578 |
530 |
376 |
510 |
680 |
119 |
255 |
239 |
| Total $million |
1,751 |
1,134 |
1,022 |
1,277 |
1,382 |
1,130 |
1,178 |
1,344 |
Source: New Zealand budget papers, various years.
Corporate welfare has ranged between about $1 billion and $1.4 billion per year in each of the seven budgets presented by the current National-led Government – see Table 1 and Figures 1 and 2.
Figure 2: Corporate welfare, Budgets 08/09 to 15/16 by Vote
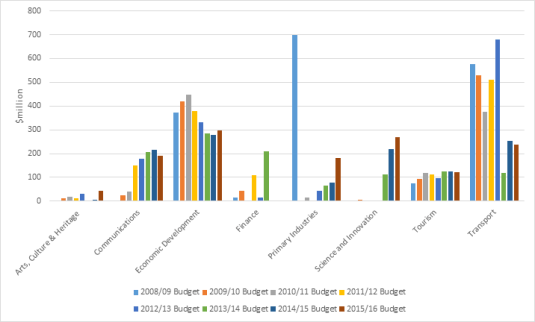
Source: New Zealand budget papers, various years; note: Vote Commerce and Consumer Affairs omitted in all years from Figure 2.
The predominant recipient of corporate welfare in this year’s budget, and all of those since 2008 is KiwiRail. Vote Transport accounts for a third of all corporate welfare – see Figures 3 and 4. Vote Economic Development is the next largest source of corporate welfare and accounts for 28% of the total since 2008 – see Figures 3 and 4.
Figure 3: Distribution of total corporate welfare across votes, 2008/09 to 2015/16

Source: New Zealand budget papers, various years.
Figure 4: State-owned enterprise welfare, Vote Transport and Vote Finance (KiwiRail), Budgets 08/09 to 15/16

Source: New Zealand budget papers, various years.
$280 – $450 million in corporate welfare has been under the patronage of the Minister for Economic Development over the last eight budgets – see Figure 5. In this year’s budget, corporate welfare under the Minister’s hand has increased slightly from $280 million to $297 million.
Figure 5: Corporate welfare, Vote Economic Development, Budgets 2008/09 to 2015/16
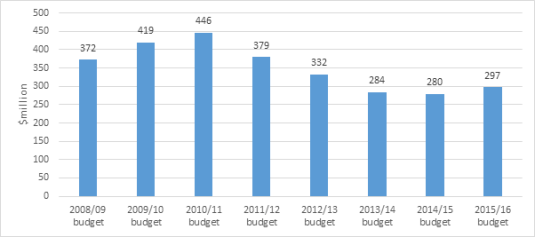
Source: New Zealand budget papers, various years.
Up until the 2013/14 budget, science and innovation spending was targeted at research that would not find private sponsors because it could not capture the returns from their discoveries – see Figure 6. Figure 6 shows that there is being rapid growth within Vote Science and Innovation of various forms of start-up and commercialisation grants in recent budgets.
Figure 6: Corporate welfare, Vote Science and Innovation, Budgets 08/09 to 15/16

Source: New Zealand budget papers, various years.
Figure 7 shows that the Government is getting back into the business of subsidising agriculture. The Primary Growth Partnership (PGP) is an R&D grants programme for the primary industry sector. There are 18 PGP programmes underway with a funding commitment from government and from industry combining to $708 million by 2017.
Figure 7: Farm welfare, Vote Primary Industries, Budgets 08/09 to 15/16
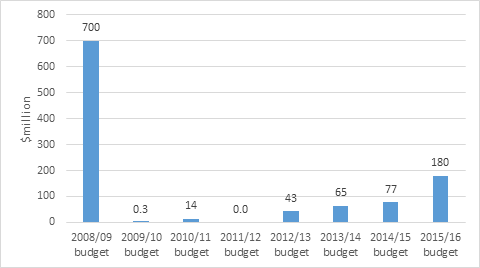
Source: New Zealand budget papers, various years.
Figure 8 shows that the National Party-led government is a major investor in ultrafast broadband – going where private entrepreneurs fear to tread.
Figure 8: Corporate welfare, Vote Communications, Budgets 08/09 to 15/16

Source: New Zealand budget papers, various years.
The corporate welfare in the Budget 2015 adds about six percentage points to the company tax rate. Should these corporate indulgences should continue or should the company tax rate drop six percentage points?
If that six percentage points on top of the company tax rate was renamed a business subsidies levy, how many businesses would want to pay it rather than developing their own business under much lower company tax rate?
The different advisory roles of science and the humanities
08 Jun 2015 Leave a comment
in applied welfare economics Tags: evidence-based policy, methodology of economics, philosophy of science
Science vs. Humanities @DrBrianJohnson1 http://t.co/P4pmvDlDUP—
C. S. Prakash (@AgBioWorld) May 22, 2015
Does Inequality Reduce Economic Growth: A Sceptical View
30 May 2015 Leave a comment
in applied price theory, applied welfare economics, comparative institutional analysis, development economics, economic history, entrepreneurship, growth disasters, growth miracles, income redistribution, politics - Australia, politics - New Zealand, politics - USA, Public Choice, public economics, rentseeking Tags: entrepreneurial alertness, Leftover Left, taxes and the labour supply, The inequality and growth, Thomas Piketty, top 1%, Twitter left
Tim Taylor, the editor of the Journal of Economic Perspectives, has written a superb blog post on why we should be sceptical about a strong relationship between inequality and economic growth. Taylor was writing in response to the OECD’s recent report "In It Together: Why Less Inequality Benefits All,".
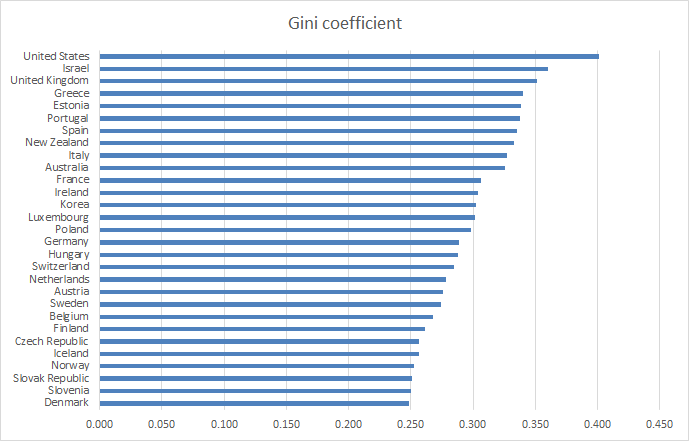
Taylor’s basic point is economists have enough trouble working out what causes economic growth so trawling within that subset of causes to quantify the effects of rising or falling inequality inequality seems to be torturing the data to confess. The empirical literature is simply inconclusive as Taylor says:
A variety of studies have undertaken to prove a connection from inequality to slower growth, but a full reading of the available evidence is that the evidence on this connection is inconclusive.
Most discussions of the link between inequality and growth are notoriously poor of theories connecting two. There are three credible theories in all listed in the OECD’s report:
The report first points out (pp. 60-61 that as a matter of theory, one can think up arguments why greater inequality might be associated with less growth, or might be associated with more growth. For example, inequality could result less growth if:
1) People become upset about rising inequality and react by demanding regulations and redistributions that slow down the ability of an economy to produce growth;
2) A high degree of persistent inequality will limit the ability and incentives of those in the lower part of the income distribution to obtain more education and job experience; or
3) It may be that development and widespread adoption of new technologies requires demand from a broad middle class, and greater inequality could limit the extent of the middle class.
About the best theoretical link between inequality and economic growth is what Taylor calls the "frustrated people killing the goose that lays the golden eggs." Excessive inequality within a society results in predatory government reactions at the behest of left-wing or right-wing populists.
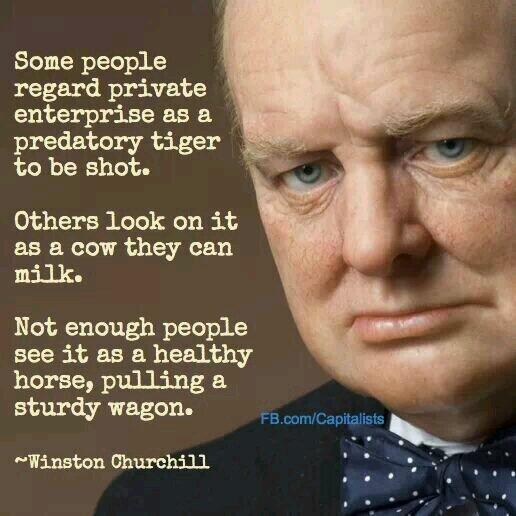
Taylor refers to killing the goose that laid the golden egg as dysfunctional societal and government responses to inequality. He is right but that is not how responses to inequality based on higher taxes and more regulation are sold. Thomas Piketty is quite open about he wants a top tax rate of 83% and a global wealth tax to put an end to high incomes:
When a government taxes a certain level of income or inheritance at a rate of 70 or 80 percent, the primary goal is obviously not to raise additional revenue (because these very high brackets never yield much).
It is rather to put an end to such incomes and large estates, which lawmakers have for one reason or another come to regard as socially unacceptable and economically unproductive…
The left-wing parties don’t say let’s put up taxes and redistribute so that is not something worse and more destructive down the road. Their argument is redistribution will increase growth or at least not harm it. That assumes the Left is addressing this issue of not killing the goose that lays the golden egg at all.

Once you discuss the relationship between inequality and growth in any sensible way you must remember your John Rawls. Incentives encourage people to work, save and invest and channels them into the occupations where they make the most of their talents. Taylor explains:
In the other side, inequality could in theory be associated with faster economic growth if: 1) Higher inequality provides greater incentives for people to get educated, work harder, and take risks, which could lead to innovations that boost growth; 2) Those with high incomes tend to save more, and so an unequal distribution of income will tend to have more high savers, which in turn spurs capital accumulation in the economy.
Taylor also points out that the OECD’s report is seriously incomplete by any standards because it fails to mention that inequality initially increases in any poor country undergoing economic development:
The report doesn’t mention a third hypothesis that seems relevant in a number of developing economies, which is that fast growth may first emerge in certain regions or industries, leading to greater inequality for a time, before the gains from that growth diffuse more widely across the economy.
At a point in its report, the OECD owns up to the inconclusive connection between economic growth and rising inequality as Taylor notes:
The large empirical literature attempting to summarize the direction in which inequality affects growth is summarised in the literature review in Cingano (2014, Annex II).
That survey highlights that there is no consensus on the sign and strength of the relationship; furthermore, few works seek to identify which of the possible theoretical effects is at work. This is partly tradeable to the multiple empirical challenges facing this literature.
The OECD’s report responds to this inclusiveness by setting out an inventory of tools with which you can torture the data to confess to what you want as Taylor notes:
There’s an old saying that "absence of evidence is not evidence of absence," in other words, the fact that the existing evidence doesn’t firmly show a connection from greater inequality to slower growth is not proof that such a connection doesn’t exist.
But anyone who has looked at economic studies on the determinants of economic growth knows that the problem of finding out what influences growth is very difficult, and the solutions aren’t always obvious.
The chosen theory of the OECD about the connection between inequality and economic growth is inequality leads to less investment in human capital at the bottom part of the income distribution.
[Inequality] tends to drag down GDP growth, due to the rising distance of the lower 40% from the rest of society. Lower income people have been prevented from realising their human capital potential, which is bad for the economy as a whole
I found this choice of explanation curious. So did Taylor as the problem already seems to have been solved:
There are a few common patterns in economic growth. All high-income countries have near-universal K-12 public education to build up human capital, along with encouragement of higher education. All high-income countries have economies where most jobs are interrelated with private and public capital investment, thus leading to higher productivity and wages.
All high-income economies are relatively open to foreign trade. In addition, high-growth economies are societies that are willing to allow and even encourage a reasonable amount of disruption to existing patterns of jobs, consumption, and ownership. After all, economic growth means change.
In New Zealand, interest free student loans are available to invest in higher education as well as living allowances for those with parents on a low income. There are countries in Europe with low levels of investment in higher education but that’s because of high income taxes not because of inequality.
The OECD’s report is fundamentally flawed which is disappointing because most research from the OECD is to a good standard.
via CONVERSABLE ECONOMIST: Does Inequality Reduce Economic Growth: A Skeptical View.
Voters think raising the minimum wage is more pro-growth than business tax cuts
24 May 2015 Leave a comment

Everyone is much better off than 40 years ago
19 May 2015 Leave a comment
in applied welfare economics, economic history, labour economics, poverty and inequality Tags: middle class stagnation, The Great Enrichment, top 1%, wage stagnation
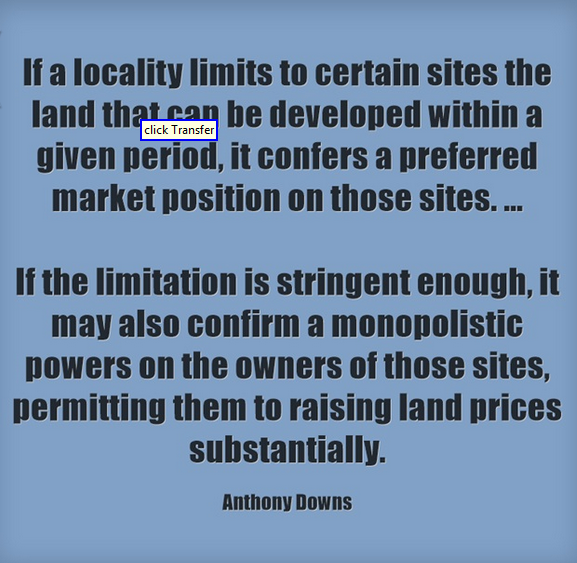
The principle of competitive land supply – Anthony Downs
16 May 2015 Leave a comment
in applied price theory, applied welfare economics, economics of regulation, urban economics Tags: Anthony Downs, green rent seeking, housing affordability, land supply, land use regulation, NIMBYs, offsetting behaviour, RMA, unintended consequences
The main drivers of child poverty
15 May 2015 Leave a comment
in applied welfare economics, economics of love and marriage, gender, labour economics, labour supply, occupational choice, politics - Australia, politics - New Zealand, politics - USA, population economics, welfare reform Tags: child poverty, economics of the family, family poverty, marriage and divorce, single mothers, single parents
CHART: Black Illegitimacy Rate Went from < 20% in 1950 to 75.2% in 2010. Has Obama ever mentioned that? http://t.co/1UBUQ5aLRi—
Mark J. Perry (@Mark_J_Perry) May 12, 2015
Quotation of the Day from Charles Murray http://t.co/Y8W6xGjRPO—
Mark J. Perry (@Mark_J_Perry) May 12, 2015


Recent Comments