The Berlin Wall fell today 1989
10 Nov 2015 Leave a comment
in economic history, liberalism, Marxist economics, politics Tags: Berlin wall, fall of communism, fall of the Berlin wall
Unions – not the cause of our 40 hour workweek
10 Nov 2015 Leave a comment
in applied price theory, applied welfare economics, economic history, entrepreneurship, health and safety, human capital, industrial organisation, labour economics, labour supply, Marxist economics, minimum wage, politics - Australia, politics - New Zealand, politics - USA, poverty and inequality, unions Tags: The Great Enrichment, union power, union wage premium
More than half of start-ups fail within the first five years
10 Nov 2015 Leave a comment
in economic history, entrepreneurship, industrial organisation, managerial economics, organisational economics Tags: creative destruction, entrepreneurial alertness
The Great Fact in 2 charts
10 Nov 2015 Leave a comment
in applied welfare economics, development economics, economic history, growth disasters, growth miracles Tags: China, India, The Great Escape, The Great Fact
When did buying your own home become a good investment in Australia?
09 Nov 2015 Leave a comment
in economic history, politics - Australia, urban economics
When I left university, all my mates were in a fever pitch about buying a house because it was such a good investment. They didn’t mention that housing had been a dog of investment for the previous 10 years. Housing was a good investment for a couple years around the time of this feverish home buying by my friends as the chart below shows. I didn’t buy a house because I could rent houses that were far nicer and more convenient to work and that any I could buy in Canberra. That pretty much applies to today.
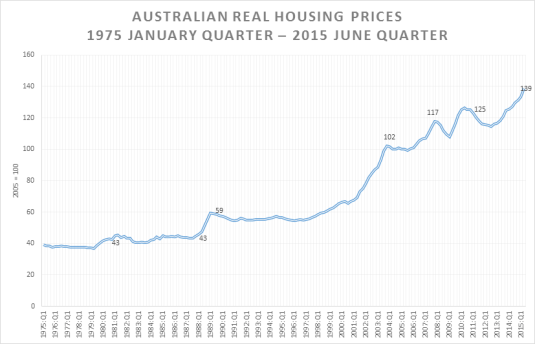
Source and notes: Dallas Fed International Housing Database July 2015 – The author acknowledge use of the dataset described in Mack and Martínez-García (2011); real housing prices are nominal housing prices deflated by a personal consumption deflator.
Through all the 1990s as the chart above shows in retrospect, I was too polite to inquire of friends about their house prices in case they had no equity in their own house after the bank took its slice. For all of the 1990s, investing in a house was a dog of an investment in Australia if the above chart is a reasonable national summary of what is a medium-sized country. Things then hit a fever pitch at the end of the 1990s with house prices doubling and then some across Australia.
The Holy Roman Empire in 1789
08 Nov 2015 Leave a comment
in constitutional political economy, economic history, Public Choice Tags: European history
The Holy Roman Empire in 1789. http://t.co/CC6zV8IcI5—
History Facts 247 (@historyfacts247) July 05, 2015
Smoking and lung cancer in the USA
07 Nov 2015 Leave a comment
in economic history, health economics Tags: economics of smoking, meddlesome preferences, nanny state
@MaxCRoser Actually did an update to 2010, but still same message http://t.co/R3Euppxhtq—
Bjorn Lomborg (@BjornLomborg) April 16, 2015
Increase in real New Zealand household incomes since 1982 – before and after housing costs
07 Nov 2015 Leave a comment
in economic history, politics - New Zealand Tags: housing affordability, living standards, RMA, The Great Enrichment
It is those below median household income that are suffering more from rising housing costs in New Zealand since 1982. Those on low incomes in particular have suffered the most.
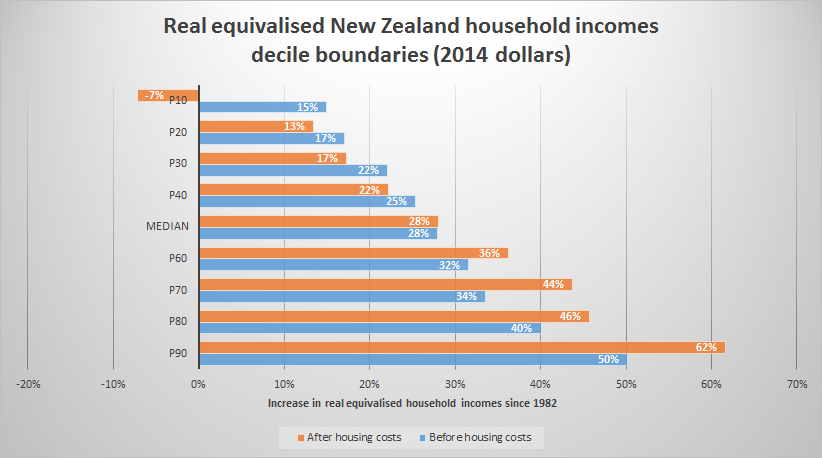
Source: Bryan Perry, Household Incomes in New Zealand: trends in indicators of inequality and hardship 1982 to 2014 – Ministry of Social Development, Wellington (August 2015), Tables D3 and D4.
The data for the lowest decile is somewhat unreliable because there are so many implausibly low and zero incomes in that decile.
Crude oil prices 1861 – 2015
07 Nov 2015 Leave a comment
in economic history, energy economics Tags: Oil prices
This was before helicopter parents
06 Nov 2015 Leave a comment
in economic history, economics of regulation, health and safety
What’s the difference between embedded neoliberalism and Director’s Law of public expenditure?
06 Nov 2015 Leave a comment
in economic growth, economic history, fiscal policy, George Stigler, Marxist economics, Public Choice, public economics Tags: conspiracy theories, growth of government, Leftover Left, median voter theorem, neoliberalism, rational ignorance, Sam Peltzman, size of government
I learnt a new word today off the back of Jane Kelsey winning a $600,000 Marsden grant to study embedded neoliberalism and her latest transnational conspiracy theory about trade agreements.
I’ve never heard of embedded liberalism before today despite a keen interest in popular and academic news. I don’t think I’m poorer for that ignorance but let’s push on. According to that source of all knowledge and truth Wikipedia, embedded neoliberalism’s been around for about 35 years:
Embedded liberalism is a term for the global economic system and the associated international political orientation as it existed from the end of World War II to the 1970s. The system was set up to support a combination of free trade with the freedom for states to enhance their provision of welfare and to regulate their economies to reduce unemployment. The term was first used by the American political scientist John Ruggie in 1982.[1]
Mainstream scholars generally describe embedded liberalism as involving a compromise between two desirable but partially conflicting objectives. The first objective was to revive free trade. BeforeWorld War I, international trade formed a large portion of global GDP, but the classical liberal order which supported it had been damaged by war and by the Great Depression of the 1930s. The second objective was to allow national governments the freedom to provide generous welfare programmes and to intervene in their economies to maintain full employment.[2] This second objective was considered to be incompatible with a full return to the free market system as it had existed in the late 19th century—mainly because with a free market in international capital, investors could easily withdraw money from nations that tried to implement interventionist and redistributive policies.[3]
The resulting compromise was embodied in the Bretton Woods system, which was launched at the end of World War II. The system was liberal[4] in that it aimed to set up an open system of international trade in goods and services, facilitated by semi fixed exchange rates. Yet it also aimed to “embed” market forces into a framework where they could be regulated by national governments, with states able to control international capital flows by means of capital controls. New global multilateral institutions were created to support the new framework, such as the World Bank and theInternational Monetary Fund.
Source: Embedded liberalism – Wikipedia, the free encyclopedia.
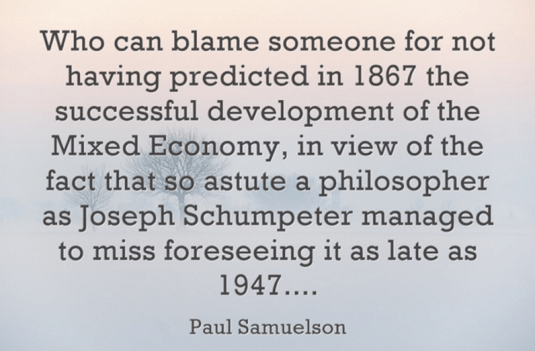
Decoding Marxist rhetoric is never easy, but I think what these academic Marxists are trying to do is describe the rise of the mixed economy and the welfare state over the course of the early and middle parts of 20th century.

The welfare state was never an easy thing for your card-carrying Marxist looking forward to the immiserisation of the proletariat as the trigger for the proletarian revolution.
Embedded neoliberalism mostly all about what Aaron Director in the 1950s explained as the reasons for the growth of government in the 20th century. He put forward what George Stigler label for him Director’s Law of Public Expenditure. George Stigler published an article on this law because Aaron Director published next to nothing for reasons no one understands. Director founded law and economics through teaching law classes at the University of Chicago law school.
Long live the Slopegraph. Long live Edward Tufte. tinyurl.com/naeh7rc http://t.co/C8Lgnupxz9—
Amity Shlaes (@AmityShlaes) May 16, 2015
Sam Peltzman pointed out that most of modern public spending is supported by the median voter – the ‘swinging’ voter. He observed that governments at the start of the 20th century were a post office and a military; at the end of the 20th century, governments are a post office, a larger military and a very large welfare state.
Studies starting from Peltzman in 1980 showed that governments grew in line with the growth in the size and homogeneity of the middle class that was organised and politically articulate enough to implement a version of Director’s Law.
Director’s Law of public expenditure is that public expenditure is used primary for the benefit of the middle class, and is financed with taxes which are borne in considerable part by the poor and the rich. Based on the size of its population and its aggregate wealth, the middle class will always be the dominant voting bloc in a modern democracy. Growth in the size of governments across the developed world took off in the mid-20th century as the middle class blossomed. Peltzman maintained that:
“The levelling of income differences across a large part of the population … has in fact been a major source of the growth of government in the developed world over the last fifty years” because the levelling created “a broadening of the political base that stood to gain from redistribution generally and thus provided a fertile source of political support for expansion of specific programs. At the same time, these groups became more able to perceive and articulate that interest … [and] this simultaneous growth of ‘ability’ served to catalyse politically the spreading economic interest in redistribution.”
After the 1970s economic stagnation, the taxed, regulated and subsidised groups had an increasing incentive to converge on new, lower cost modes of income redistribution.
- economic reforms ensued, led by parties on the left and right, with some members of existing political and special interest groupings benefiting from joining new coalitions.
- More efficient taxes, more efficient spending, more efficient regulation and a more efficient state sector reduced the burden on the taxed groups.
- Most of the subsidised groups benefited as well because their needs were met in ways that provoked less political opposition from the taxpaying groups.
Sweden, Norway and Denmark could be examples of Gary Becker’s idea that political systems converge on the more efficient modes of both regulation and income redistribution as their deadweight losses grew in the 1970s and 1980s and after. Unlike some of their brethren abroad, more of the Nordic Left and, more importantly, the Nordic median voter were cognizant of the power of incentives and to not killing the goose that laid the golden egg. Taxes on income from capital are low in Scandinavia.
The rising deadweight losses of taxes, transfers and regulation all limit the political value of inefficient redistributive policies. Tax and regulatory policies that are found to significantly cut the total wealth available for redistribution by governments are avoided relative to the germane counter-factual, which are other even costlier modes of redistribution.
An improvement in the efficiency of either taxes or spending reduces political pressure from taxed and regulated groups for suppressing the growth of government and thereby increases total tax revenue and spending because there is less political opposition. Efficient taxes lead to higher taxes.
Improvements in the efficiency of taxes, regulation and in spending reduce political pressure from the taxed and regulated groups in society. This suppressed the growth of government and thus increased or prevented cuts to both total tax revenue and spending since 1980. Economic regulation lessened after 1980 and there were privatisations, but social and environmental regulation grew unabated. Certainly in New Zealand the post-1984 economic reforms followed a good 10 years of economic stagnation and regular economic crises:
In the early 1980s, New Zealand’s economy was in trouble. The country had lost its guaranteed export market when Britain joined the European Economic Union in 1973. The oil crisis that year had also taken a toll.
The post-1980 reforms of Thatcher, Reagan, Clinton, Hawke and Keating, Lange and Douglas and others saved the modern welfare state for the middle class. Most income transfer programmes in modern welfare states disproportionately benefit older people. With an aging society, that trend can only continue. That is why these reforming policies survived political competition, election after election. The political parties on the left and right that delivered efficient increments and streamlined the size of government were elected, and in turn, got thrown out from time to time because they became tired and flabby.

The rest of embedded neoliberalism is trying to explain widespread economic deregulation and liberalisation of international trade along with the continual growth of social regulation. This is something that Gary Becker, George Stigler and Sam Peltzman have written on previously.
The continued growth of social regulation is best explained by the median voter theorem. Both Bryan Caplan and Sam Peltzman pointed out that it’s hard to think of any major government program or regulation that does not enjoy widespread popular support.
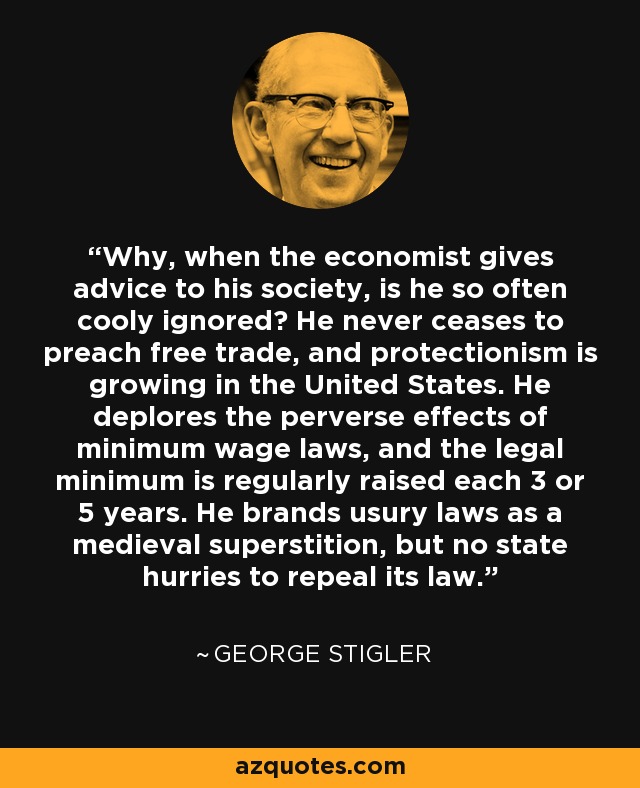
As for the public been duped by neoliberal economists, George Stigler argued that ideas about economic reform need to wait for a market. As Stigler noted, when their day comes, economists seem to be the leaders of public opinion but when the views of economists are not so congenial to the current requirements of special interest groups and voting public, these economists are left to be the writers of letters to the editor in provincial newspapers. These days they would run an angry blog.
@CloserTogether @FairnessNZ nail case for neoliberalism @chrishipkins @Maori_Party
06 Nov 2015 Leave a comment
in econometerics, economic history, labour economics, labour supply, minimum wage, politics - USA, unions Tags: conspiracy theories, conspiracy theorists, Leftover Left, living standards, Maori economic development, neoliberalism, top 1%, Twitter left, union power, union wage premium
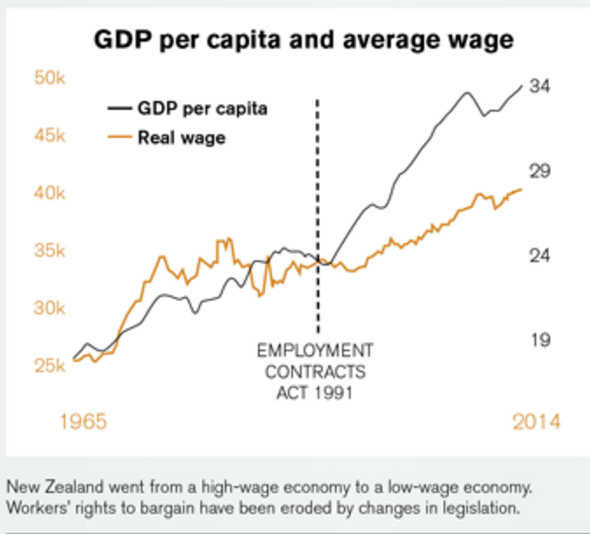
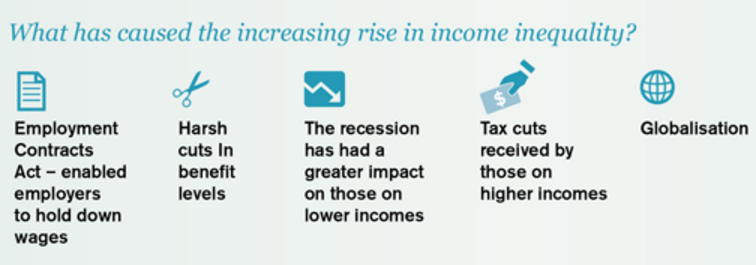
The Council of Trade Unions and Closer Together Whakatata Mai charted similar statistics to show that everything has gone to hell in a hand basket since neoliberalism seized power in New Zealand in 1984 and in particular after the passing of the Employment Contracts Act in 1991.
Source: Income Gap | New Zealand Council of Trade Unions – Te Kauae Kaimahi.
The passage of the Employment Contracts Act greatly reduced union power and union membership and with it wages growth in New Zealand, according to what is left of the New Zealand union movement.
Source: Income Gap | New Zealand Council of Trade Unions – Te Kauae Kaimahi.
Unfortunately, both charts of the same statistics show the exact opposite to what was intended by The Council of Trade Unions and Closer Together Whakatata Mai.
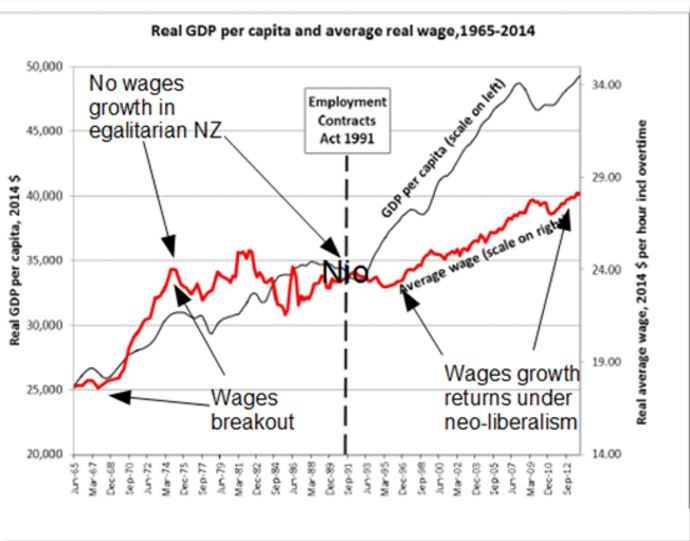
Even the most casual inspection of the data charted above and reproduced below with some annotations shows that real wages growth returned to New Zealand in the early 1990s after 20 years of real wage stagnation.
Source: Income Gap | New Zealand Council of Trade Unions – Te Kauae Kaimahi.
The reforms of the 1980s stopped what was a long-term decline in average real wages. The reforms of the early 1990s including the passing of the Employment Contracts Act was followed by the resumption of sustained growth in average real wages with little interruption since.
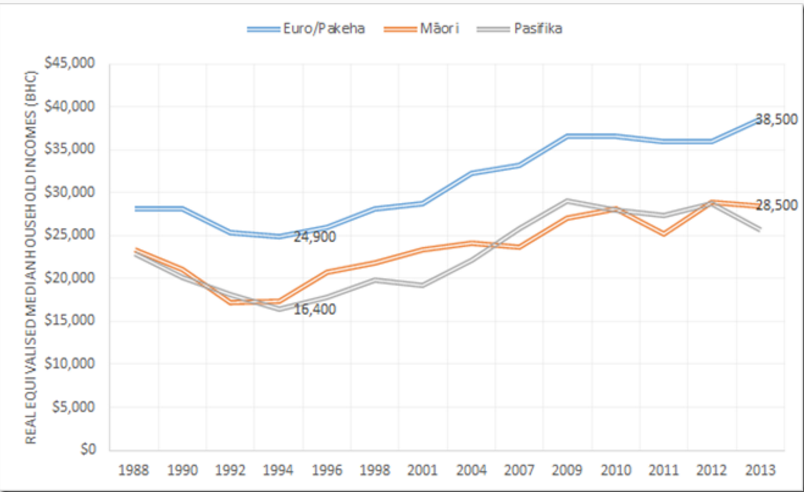
Closer Together Whakatata Mai has even stumbled onto the great improvements in household incomes across all ethnicities since the early 1990s.
The increase in percentage terms of Maori and Pasifika real household income is much larger than for Pakeha. As Bryan Perry (2015, p. 67) explains when commenting on the very table D6 sourced by Closer Together Whakatata Mai:
From a longer-term perspective, all groups showed a strong rise from the low point in the mid 1990s through to 2010. In real terms, overall median household income rose 47% from 1994 to 2010: for Maori, the rise was even stronger at 68%, and for Pacific, 77%. These findings for longer- term trends are robust, even though some year on year changes may be less certain. For 2004 to 2010, the respective growth figures were 21%, 31% and 14%.
Source: Bryan Perry, Household Incomes in New Zealand: trends in indicators of inequality and hardship 1982 to 2014 – Ministry of Social Development, Wellington (August 2015), Table D6.
As Closer Together Whakatata Mai documented, incomes increased in real terms by 14% for the bottom and 19% for the middle.
Perry noted that in the lowest decile had too many implausible incomes including many on zero income so he was wary of relying on it. I have therefore charted the second, median and top decile before and after housing costs below. All three deciles charted showed substantial improvements in incomes both before and after housing costs.
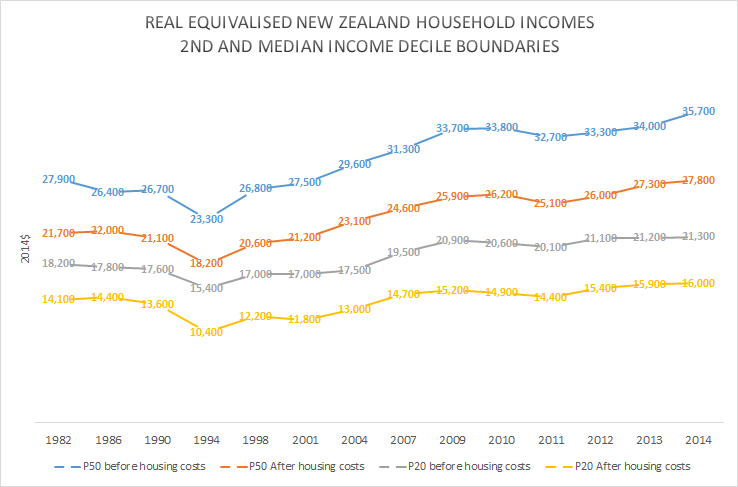
Source: Bryan Perry, Household Incomes in New Zealand: trends in indicators of inequality and hardship 1982 to 2014 – Ministry of Social Development, Wellington (August 2015).
Naturally, measuring changes in living standards over long periods of time is fraught with under-estimation. There are new goods to be accounted for and product upgrades too.
The apps in your smartphone cost $900,000 thirty years ago —@datarade https://t.co/pjw7q4QGDp—
Vala Afshar (@ValaAfshar) October 29, 2015
The diffusion rates of household appliances in the 20th century
06 Nov 2015 Leave a comment
in economic history, gender, industrial organisation, labour economics, survivor principle Tags: creative destruction, engines of liberation, household production, international technology diffusion, marital division of labour, technology diffusion
Why household appliances are the 20th century’s most disruptive technologies bit.ly/1LsZEJC
at @wef https://t.co/qwI3FpXhwz—
Max Roser (@MaxCRoser) October 24, 2015
Hauser’s Law
06 Nov 2015 Leave a comment
in economic history, politics - USA, public economics Tags: growth of government


Recent Comments