@GarethMP Solar power is rising very fast!
17 Nov 2015 Leave a comment
in economic history, energy economics
British post-war productivity growth
17 Nov 2015 Leave a comment
in economic growth, economic history, global financial crisis (GFC), labour economics, macroeconomics Tags: British economy, British history
Jihadists and the Nisei soldiers
16 Nov 2015 1 Comment
in economic history, economics of religion, occupational choice, politics - Australia, politics - New Zealand, politics - USA, war and peace Tags: British politics, counter-signalling, economics of oppositional identities, game theory, ISIS, New Zealand Greens, war against terror, World War II
Japanese Americans interned during World War II jumped at the chance to volunteer to fight. They saw it as their last chance to prove their undivided loyalty to their country.
One Japanese father, when saying goodbye to his son, stressed that showing his loyalty to his country, if necessary through the last full measure of devotion was far more important that his returning safely to his family.
The 442nd Combat Regiment Team was the most decorated unit in World War II. Its motto was “Go for Broke”. The 4,000 Nisei soldiers in April 1943 had to be replaced nearly 2.5 times. In total, about 14,000 men served, earning 9,486 Purple Hearts.
Migrants are a cut above regarding initiative and judgement. They pass many of these traits on to their children. These Japanese Americans, both migrants and native born knew that counter-signalling was required. They had to go out of their way to show their loyalty no matter how unfair any suspicions of disloyalty among Japanese Americans might have been at the time.
I am reminded of that counter-signalling by Japanese Americans during the darkest days of World War II when I read the remarks of Julie Anne Genter and Jeremy Corbyn. Both focused their pleas on the need to be inclusive and understanding why people join violent, radical groups. They and the rest of the Twitter Left had nothing to contribute regarding strategies to deter the next attack and disrupt those that are in the planning stage, but that is not new.
The notion that bad behaviour towards minority communities leads to more recruitment to the terrorists is overrated. There will be a few wind-bags who say harsh things after each terrorist attack, but if they cross the line, they will be dealt with by the police and courts in a democracy governed by the rule of law.
Acrimony towards your community following the latest terrorist attacks has little to do with the level of recruitment to these terrorist groups either now or in the past. As Alan Krueger explains:
One of the conclusions from the work of Laurence Iannaccone—whose paper, “The Market for Martyrs,” is supported by my own research—is that it is very difficult to effect change on the supply side. People who are willing to sacrifice themselves for a cause have diverse motivations. Some are motivated by nationalism, some by religious fanaticism, some by historical grievances, and so on. If we address one motivation and thus reduce one source on the supply side, there remain other motivations that will incite other people to terror.
Malcontents join the jihadists today for the same reasons they joined the Red Brigade, the Japanese Red Army Faction and Baader-Meinhof gang in the 1970s and 1980s.
Plenty of young people were attracted to communism in previous generations as a way of sticking it to the man. Now as then economic conditions were good as were political freedoms. Italy, Japan and Germany were all at the peak of recoveries from war. Japanese incomes are doubled in the previous decade. Germany and Italy were rich countries. As Alan Krueger explains:
Despite these pronouncements, however, the available evidence is nearly unanimous in rejecting either material deprivation or inadequate education as important causes of support for terrorism or participation in terrorist activities. Such explanations have been embraced almost entirely on faith, not scientific evidence.
Each generation has its defining oppositional identity. Radical Islam is the oppositional identity of choice for today’s angry young men and women. Mind you, they have to buy Islam for dummies to understand what they’re signing up for.
In previous generations, it was communism, weird Christian sects, eco-terrorism, animal liberationist terrorism and a variety of domestic terrorists of the left and right with conspiratorial motivations. Look at the level of diversity of the angry young men and women on the domestic terrorists list of the FBI. One jihadists when interviewed said that 30 years ago he would probably have become a Communist as his vehicle for venting his frustrations.
There is always an ample supply of troubled and angry people so trying to redress their grievances is overrated as Alan Krueger explains:
…it makes sense to focus on the demand side, such as by degrading terrorist organizations’ financial and technical capabilities, and by vigorously protecting and promoting peaceful means of protest, so there is less demand for pursuing grievances through violent means. Policies intended to dampen the flow of people willing to join terrorist organizations, by contrast, strike me as less likely to succeed.
The current appeal of radical Islam rests on what psychologists call personal significance. The quest for personal significance by these angry young men and women is the desire to matter, to be respected, to be somebody in one’s own eyes and in the eyes of others.
A person’s sense of significance may be lost for many reasons, including economic conditions. The anger can grow out of a sense of disparagement and discrimination; it can come from a sense that one’s brethren in faith are being humiliated and disgraced around the world.
Extremist ideologies, be they communism, fascism or extreme religions are effective in such circumstances because it offers a quick-fix to a perceived loss of significance and an assured way to regain it. It accomplishes this by exploiting primordial instincts for aggression, sex and revenge. MI5’s behavioural science unit found that
“far from being religious zealots, a large number of those involved in terrorism do not practise their faith regularly. Many lack religious literacy and could… be regarded as religious novices.” The analysts concluded that “a well-established religious identity actually protects against violent radicalisation”
Most evidence point to moral outrage, disaffection, peer pressure, the search for a new identity, for a sense of belonging and purpose as drivers of radicalisation. Anthropologist Scott Atran pointed out in testimony to the US Senate in March 2010:
“. . . what inspires the most lethal terrorists in the world today is not so much the Quran or religious teachings as a thrilling cause and call to action that promises glory and esteem in the eyes of friends, and through friends, eternal respect and remembrance in the wider world”. He described wannabe jihadists as “bored, underemployed, overqualified and underwhelmed” young men for whom “jihad is an egalitarian, equal-opportunity employer . . . thrilling, glorious and cool”.
Chris Morris, the writer and director of the 2010 black comedy Four Lions – which satirised the ignorance, incompetence and sheer banality of British Muslim jihadists – said “Terrorism is about ideology, but it’s also about berks”.
Banking crises are more common than you think
16 Nov 2015 Leave a comment
in currency unions, economic history, economics of regulation, Euro crisis, macroeconomics, monetary economics Tags: bank run, banking crises, banking panics, economics of banking, financial crises

@JohnQuiggin on “How New Zealand fell further behind” @FairnessNZ
15 Nov 2015 1 Comment
in applied welfare economics, economic growth, economic history, economics of regulation, fiscal policy, labour economics, politics - New Zealand Tags: Australia, John Quiggin, lost decades
Leading Australian academic economist John Quiggin has just published an article arguing that New Zealand should not be a policy role model for anything. To quote Quiggin:
For most of the twentieth century, the New Zealand and Australian economies performed almost identically. New Zealand took a somewhat larger hit when Britain entered the European Common Market in the 1970s, but that impact has long since washed out. The real divergence came in the 1980s. Since then, New Zealand’s income per person has fallen 35 per cent behind Australia’s
He used Reserve Bank of New Zealand data going back to 1990, which is common starting point for most Reserve Bank data.
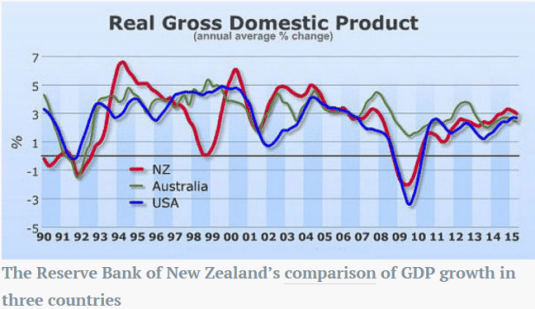
Source: John Quiggin “How New Zealand fell further behind”. Inside Story, 11 November 2015.
If he had taken that chart back to the 1970s and earlier using the Conference Board Total Database, Quiggin would have found that New Zealand economy diverged from Australia in the 1970s, not in the 1980s. His data from the Reserve Bank of New Zealand started at the low point in 1990 – at the end of that divergence that started in 1974. The New Zealand economy was depressed between 1974 and 1992. I label this Great Depression in New Zealand as New Zealand’s Lost Decades.
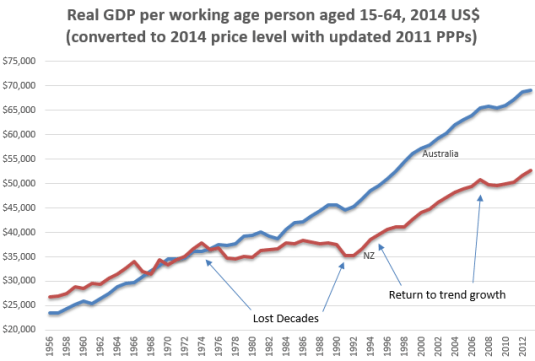
Source: Computed from OECD Stat Extract and The Conference Board. 2015. The Conference Board Total Economy Database™, May 2015, http://www.conference-board.org/data/economydatabase/
Real GDP PPP per working age New Zealander fell rapidly after 1974 (a 34% drop against trend) when that economy was a heavily regulated, highly taxed economy. This heavily regulated, highly taxed, economically stagnant New Zealand is the good old days in the eyes of the Twitter Left.
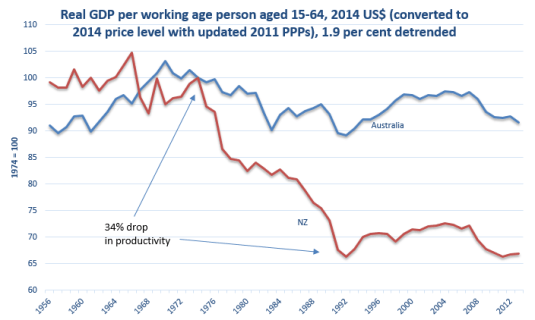
Source: Computed from OECD Stat Extract and The Conference Board. 2015. The Conference Board Total Economy Database™, May 2015, http://www.conference-board.org/data/economydatabase/
In the chart above, the base is 1974 which equals 100. A flat-line means annual growth equal to the trend rate of growth in the 20th century for the USA. A falling line means below trend growth; a rising line means above trend rate economic growth per working age Australian or New Zealander.
With the election of a National Party government in 1990 and a massive fiscal consolidation, New Zealand growth rate returned to the previous trend rate of 1.9% in 1992. Ruth Richardson’s horror budget of 1991 was so bad that the what became the Twitter Left called it the “Mother of All Budgets“.
What followed this massive fiscal consolidation where welfare benefits for cut severely was an economic boom that lasted until the GFC.
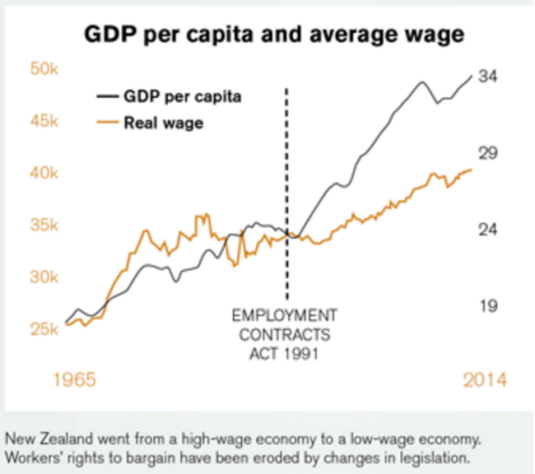
Source: Income Gap | New Zealand Council of Trade Unions – Te Kauae Kaimahi.
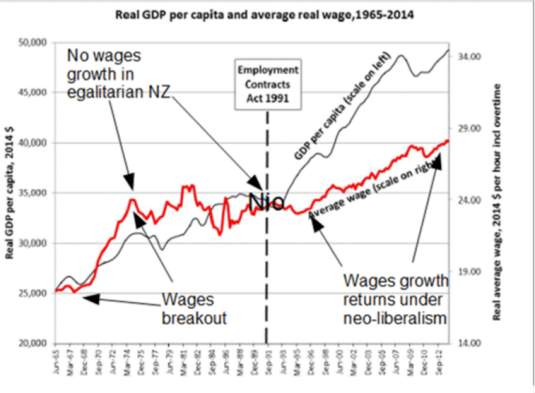
As shown in the chart conveniently compiled by the New Zealand Council of Trade Union, there was 20 years of real wage stagnation until the passage of the Employment Contracts Act in 1991.
Source: Income Gap | New Zealand Council of Trade Unions – Te Kauae Kaimahi with annotations.
What followed the passage of that Act was sustained real wages growth for the first time in two decades and the end of growing inequality under the previously highly taxed, heavy regulated economy that was good old days New Zealand if the Twitter Left is to be believed.
To do this, to paint pre-1984 New Zealand, pre-neoliberal New Zealand as a fairly egalitarian paradise, Max Rashbrooke is an example of that is had to ignore two thirds of the population and the inequalities they suffered:
“New Zealand up until the 1980s was fairly egalitarian, apart from Maori and women, our increasing income gap started in the late 1980s and early 1990s,” says Rashbrooke. “These young club members are the first generation to grow up in a New Zealand really starkly divided by income.”
Racism and patriarchy can sit comfortably with a fairly egalitarian society if you are to believe the vision of the Twitter Left as to their good old days. John Quiggin refers to the period in Australia known as the Menzies Era as part of his golden age of the mixed economy. The Menzies Era was most of the 23 years of uninterrupted conservative party rule between 1949 and 1972. The actual Menzies Era was the period up to 1966 when Liberal Party Prime Minister Sir Robert Menzies retired
The reforms of the 1980s known as Rogernomics stopped the long-term stagnation in real wages that started in about 1974. The reforms of the early 1990s under a National Party government including a massive fiscal consolidation and the passing of the Employment Contracts Act was followed by the resumption of sustained growth in real wages with little interruption since.
New work by Chris Ball and John Creedy shows substantial *declines* in NZ inequality.
initiativeblog.com/2015/06/24/ine… http://t.co/f94fw4Bhae—
Eric Crampton (@EricCrampton) June 24, 2015
This boom after two decades of minimal real economic growth per working age New Zealander benefited everyone. The unemployment rate fell to a record low of 3.5% about 2005. Maori unemployment was at a 20-year low of 8% in 2008. Maori labour force participation rates increased from 45% in the late 1980s to about 62% by the eve of the Global Financial Crisis.
The increase in percentage terms of Maori and Pasifika real household income is much larger than for Pakeha since the economic reforms of the 1980s and 1990s. As Bryan Perry (2015, p. 67) explains when commenting on table D6 sourced by Closer Together Whakatata Mai:
From a longer-term perspective, all groups showed a strong rise from the low point in the mid 1990s through to 2010. In real terms, overall median household income rose 47% from 1994 to 2010: for Maori, the rise was even stronger at 68%, and for Pacific, 77%. These findings for longer- term trends are robust, even though some year on year changes may be less certain. For 2004 to 2010, the respective growth figures were 21%, 31% and 14%.
Creative destruction in British manufacturing employment
13 Nov 2015 Leave a comment
in applied price theory, applied welfare economics, economic history, industrial organisation, labour economics, labour supply, survivor principle Tags: British economy, British history, creative destruction, endogenous growth theory, labour reallocation, technological unemployment
@dsmitheconomics @thesundaytimes In mid-60s, about a third of workers were employed in manufacturing. Now 8%! http://t.co/ipmr7XvIme—
Andrew Sentance (@asentance) July 12, 2015
US, UK, Danish and Swedish tax revenues as % of GDP since 1966
13 Nov 2015 Leave a comment
in economic history, public economics, Sam Peltzman
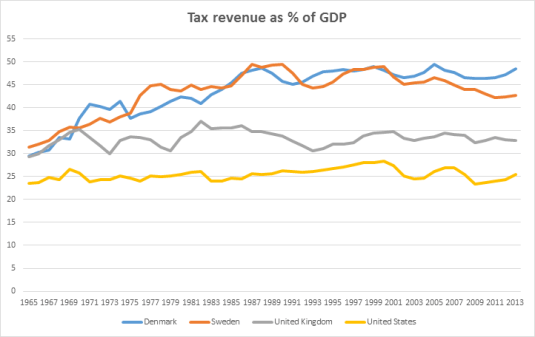
You can’t find Reaganomics in the tax statistics below. Maggie Thatcher stopped a rapid growth in British tax revenues which caused the UK to become the sick man of Europe. She then unwound that growth in tax revenues as a percentage of British GDP. The election of the Blair government in 1997 stopped the rapid growth in tax revenues as a share of British GDP under that double secret socialist John Major. As Sam Peltzman previously noticed, the growth the government stopped in Denmark and Sweden in the mid-1980s.
Data extracted on 12 Nov 2015 23:56 UTC (GMT) from OECD.Stat
Eurosclerosis illustrated in the labour market
13 Nov 2015 Leave a comment
in economic history, Euro crisis, labour economics, labour supply, macroeconomics, politics - USA, public economics Tags: employment law, Eurosclerosis, France, Germany, growth of government, labour market regulation, size of government, taxation and labour supply

Source: Linda Regber.
Equilibrium unemployment rates in Denmark, Sweden, Norway and Finland, 1969 – 2017
13 Nov 2015 Leave a comment
in economic history, unemployment Tags: Denmark, Finland, Norway, Sweden
Equilibrium unemployment rates are creeping up on all Scandinavian countries bar Norway.

Data extracted on 10 Nov 2015 07:07 UTC (GMT) from OECD.Stat.
Do the European welfare states free ride off American entrepreneurship and innovation?
12 Nov 2015 1 Comment
in applied price theory, applied welfare economics, comparative institutional analysis, constitutional political economy, economic history, economics of regulation, entrepreneurship, industrial organisation, politics - USA, public economics, survivor principle, taxation, technological progress Tags: creative destruction, Daron Acemoglu, Denmark, entrepreneurial alertness, Eurosclerosis, international technology diffusion, taxation and entrepreneurship, taxation and innovation, taxation and investment, taxation and labour supply, technology followers, welfare state
Source: Daron Acemoglu A Scandinavian U.S. Would Be a Problem for the Global Economy – NYTimes.com.
Too many hippies study biology
12 Nov 2015 Leave a comment
in applied price theory, economic history, economics of media and culture, liberalism, movies Tags: agricultural economics, back to nature, expressive boating, hippies, Left-wing hypocrisy, Leftover Left Twitter left, The Great Enrichment, The Great Escape, The Great Fact
French, German, Italian and British equilibrium unemployment rates, 1968 – 2017
10 Nov 2015 Leave a comment
in business cycles, economic history, economics of regulation, Euro crisis, job search and matching, labour economics, labour supply, macroeconomics Tags: British economy, employment law, equilibrium unemployment rate, Eurosclerosis, France, Germany, Italy, labour market reforms, Margaret Thatcher, Thatchernomics, The British Disease
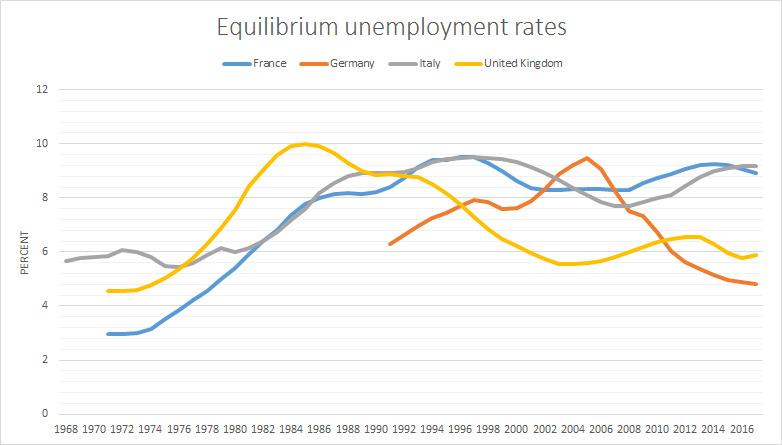
Unlike the USA, the German, Italian, British and French equilibrium unemployment rates all show fluctuations that reflect changes in their underlying economic circumstances and labour market reforms. The case of the British, the rise of the British disease and Thatchernomics. The case of German, its equilibrium unemployment rate rose after German unification and then fell after the labour market reforms of 2002 to 2005.
Source: OECD Economic Outlook November 2015 Data extracted on 10 Nov 2015 07:07 UTC (GMT) from OECD.Stat.
We should never forget Peter Fechter & the 253 others who died at the Berlin Wall
10 Nov 2015 Leave a comment
in economic history, liberalism, Marxist economics Tags: Berlin wall, fall of communism, Germany
Why is the US equilibrium unemployment rate so stable as compared to Canada and the UK?
10 Nov 2015 2 Comments
in business cycles, economic history, macroeconomics, politics - USA, unemployment
The equilibrium unemployment rate in the USA has been dead flat at a little under 6% as far back as the OECD Economic Outlook November 2015 can estimate. The Canadian and British equilibrium unemployment rates have gone up and down to the point of near doubling at times. Institutions cannot be so stable in the USA and so unstable Canada and Britain in terms of the incentives to post vacancies, for search for work in the same in different industries and occupations and revise asking wages. We’re talking about a 35 year stretch macroeconomic and labour market policy in the USA.
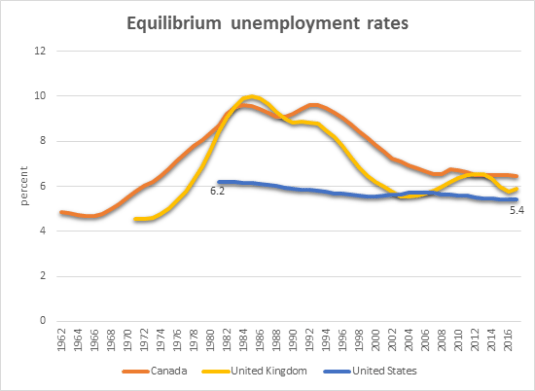
Source: OECD Economic Outlook November 2015 Data extracted on 10 Nov 2015 07:07 UTC (GMT) from OECD.Stat.
Furthermore, there is a large literature in the early 1970s and late 1990s arguing that the US equilibrium unemployment rate dropped as low as 4%.
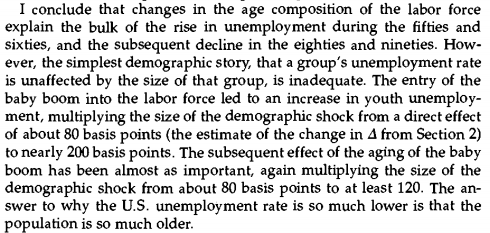
Source: Robert Shimer, Why is the U.S. Unemployment Rate So Much Lower? (1999).
More correctly, for the early 1970s literature, the equilibrium unemployment rate had risen to 4% after being at an equilibrium rate of about 3%. Something doesn’t add up.
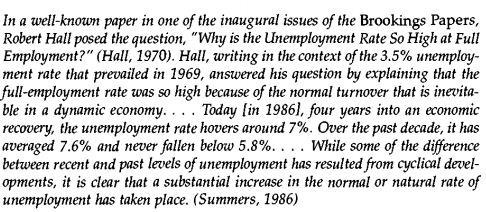
Source: Robert Shimer, Why is the U.S. Unemployment Rate So Much Lower? (1999).
This estimate of an unchanging US equilibrium unemployment rate doesn’t add up even more when you consider the discussions after the Great Recession about how the extensions to unemployment insurance from a time limit of 26 weeks to 99 weeks would increase the equilibrium unemployment rate. Something really doesn’t add up for the US equilibrium unemployment rate to be so stable and the British and Canadian equilibrium unemployment rates to be so volatile.
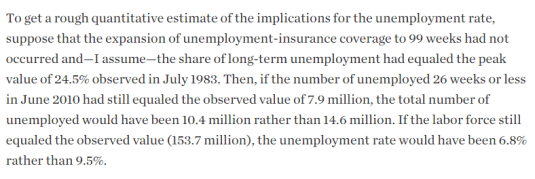
Source: Robert Barro: The Folly of Subsidizing Unemployment – WSJ.


Recent Comments