Updated: What we know about the shooting at a Charleston church that left nine dead wapo.st/church-shootin… http://t.co/88gPuzGYcC—
Post Graphics (@PostGraphics) June 19, 2015
Motives for hate crimes in the USA
02 Jul 2015 Leave a comment
in economic history, economics of crime, law and economics, politics - USA Tags: hate crimes, mass shootings
The Great Escape in life expectancies over the last 40 years
01 Jul 2015 Leave a comment
in economic history, health economics, politics - Australia, politics - New Zealand, politics - USA Tags: life expectancies, mortality rates, The Great Escape
There was a Global Cooling scare in the 1970s
01 Jul 2015 4 Comments
in economic history, economics of media and culture, environmental economics, global warming Tags: climate alarmism, global cooling, global warming, green rent seeking, Little ice age
Former Spanish colonies
01 Jul 2015 Leave a comment
in economic history Tags: imperialism: colonisation, Spain, Spanish Empire
Territories that at one time or another were under control of the Spanish Crown bit.ly/1xGBxB6 http://t.co/TK524oOYKM—
Brilliant Maps (@BrilliantMaps) November 26, 2014
Adoption of new technology since 1900 in the US
30 Jun 2015 Leave a comment
in economic history, entrepreneurship Tags: creative destruction, entrepreneurial alertness, technology diffusion
Adoption of new technology since 1900 in the US
(via: bit.ly/19wkABd) http://t.co/cG9HIWgAg9—
Max Roser (@MaxCRoser) May 28, 2015
1st 999 number introduced today 1937
30 Jun 2015 Leave a comment
in economic history, economics of crime, economics of media and culture, entrepreneurship, law and economics Tags: British economy, crime and punishment, London
999 – World's first emergency telephone number – was introduced in London #OnThisDay 30 June 1937 #emergencyservices http://t.co/I4gbrwJ2Vp—
BT Archives (@BTArchives) June 30, 2014
Down and out in Australia as measured by consumer durables affordability
30 Jun 2015 Leave a comment
in applied welfare economics, economic history Tags: Australia, living standards, The Great Enrichment
Economic freedom improves everyone's lives – especially the poor – as this graph from the IPA's @NovakMikayla shows: http://t.co/5qHIRcVRcN—
InstofPublicAffairs (@TheIPA) April 17, 2015
Televisions in the good old days
30 Jun 2015 Leave a comment
in economic history, technological progress Tags: living standards, The Great Enrichment
Top marginal income tax rate throughout the 20th century
29 Jun 2015 Leave a comment
in economic history, entrepreneurship, income redistribution, politics - USA, Public Choice, public economics, rentseeking Tags: Eurosclerosis, taxation and entrepreneurship, taxation and investment, taxation and the labour supply, top 1%
Piketty presents the changes in the top marginal income tax rate throughout the 20th century… #GCLIS http://t.co/sFpV0ypC5C—
LIS (@lisdata) April 16, 2014
Creative destruction in house sizes
28 Jun 2015 Leave a comment
in economic history, politics - USA, urban economics Tags: creative destruction, the good old days, The Grade Enrichment
CHART: Today’s new homes are 1,000 square feet larger than in 1973, and average living space per person has doubled http://t.co/vdBTwWsygG—
Mark J. Perry (@Mark_J_Perry) June 27, 2015
There is creative destruction in printers too
28 Jun 2015 Leave a comment
GRAPHIC: Why your middle-class salary is better than you might think
washingtonpost.com/blogs/wonkblog… http://t.co/vvRCo0PNel—
Mark J. Perry (@Mark_J_Perry) June 15, 2015
Boozy baby boomers?
28 Jun 2015 Leave a comment
in economic history, economics of regulation, health economics Tags: alcohol regulation
Mad Men makes the 1960s seem like a nonstop booze-fest. This chart proves it wasn't. bit.ly/1EdM9qu http://t.co/1dE5SA5Kdc—
Ezra Klein (@ezraklein) May 06, 2015
India at night in 1994 and 2010 – Estimating Poverty Using Nightlights
27 Jun 2015 Leave a comment
in development economics, econometerics, economic history, growth disasters, growth miracles Tags: India, measurement error, national accounts

Maxim Pinkovskiy and Xavier Sala-i-Martin last year suggested that national accounting estimates of poverty should be adjusted for the evolution of satellite-recorded night-time lights. I agree from personal experience.
In India between 1994 and 2010, its survey income grew by 29% but its GDP per capita more than doubled during this time. We see that lights in India increase dramatically both in their intensity over the major cities as well as in their extent over previously dark areas of the country. This suggests that the GDP estimate is a more accurate assessment of economic development of India and the faster reduction of poverty than income surveys suggest.
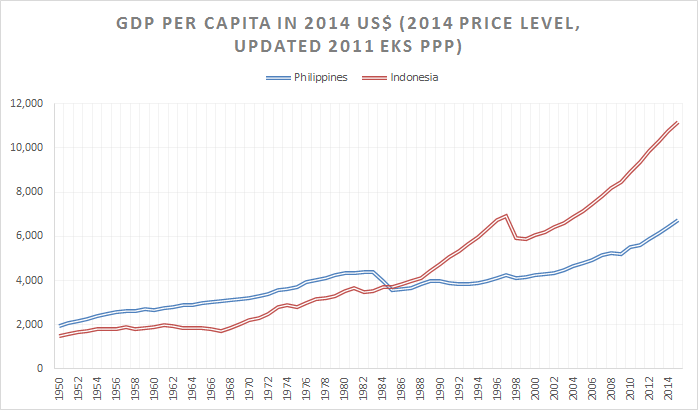
Source: The Conference Board. 2015. The Conference Board Total Economy Database™, May 2015, http://www.conference-board.org/data/economydatabase/
National accounting data on real GDP, PPP would suggest that Indonesia is a much wealthier country than the Philippines. The Philippines from about the late 1998, has had rapid economic growth, but so has Indonesia. I first visited the Philippines in 1997. I have never visited Indonesia.

When I first visited my parents-in-law in the Philippines in 1998, that part of Leyte had no sealed roads and no phones.
The next time I visited, the road was being sealed and mobile reception was better if you had an aerial on the roof.
After a five year gap in visiting, not only was mobile reception good, there was cable TV if you wanted it. When I visited in 2012, there was wireless internet if you had outside aerial.
Christmas before last, we hot spotted off my sister-in-law’s mobile. Neighbours have Skype if we want to say hello. I don’t know how that rapid change in economic fortunes is captured accurately in national accounting figures.
Why is the Australian top 0.1% far less greedy than the UK, US and Canadian top 0.1%?
26 Jun 2015 Leave a comment
in economic history, entrepreneurship, human capital, labour economics, labour supply, Marxist economics, occupational choice, politics - Australia, politics - USA, poverty and inequality Tags: Australia, British economy, Canada, Leftover Left, top 0.1%, top 1%
Figure 1: top 0.1% share of gross income, Australia, UK, USA and Canada since 1946

Source: Chartbook of Economic Inequality.
The top 0.1% in Australia is earning not much more than it did in 1946. For most of the post-war period, the Australian top 0.1% earned less than what it earned in 1946. The only spike in the earnings of the Australian top 0.1% occurred after the top tax rate of 66% was reduced to 49% in 1986.
There were major cuts in the top tax rates in Australia,the USA and UK in the early 1980s. Figure 1 shows that these top tax rate cuts were matched with a spike in the earnings of the top 0.1% subsequent to those large tax cuts.
Does Honey spoil?
26 Jun 2015 Leave a comment
in economic history, economics of media and culture, health economics Tags: food


Recent Comments