
25 years after the fall of communism – the economic scorecard
17 Apr 2015 3 Comments
in development economics, economic history, growth disasters, growth miracles, Marxist economics
Average tax rates on consumption, investment, labour and capital in USA, UK and Canada, 1950-2013
17 Apr 2015 5 Comments
in business cycles, economic growth, economic history, fiscal policy, global financial crisis (GFC), great recession, macroeconomics, politics - USA, public economics Tags: British economy, Canada, sick man of Europe, tax incidence, tax reform
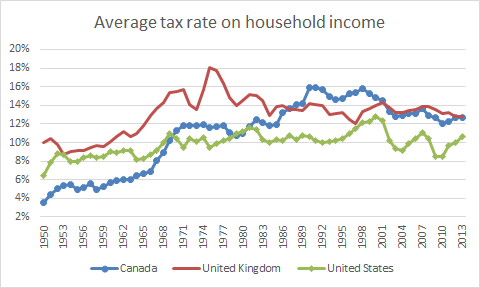
Income taxes in the USA and UK didn’t change all that much after the mid-70s. Prior to that, income tax rose quite steadily in the UK in the 1950s and 1960s and not surprisingly, Britain was the sick man of Europe in the 1970s. Income taxes rose quite steadily in Canada for most of the post-war period up until 1990 and then levelled out for most of that decade before a small tapered downwards.
Source: Cara McDaniel.
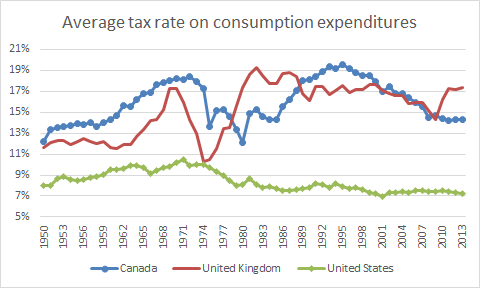
Taxes on consumption expenditure were very different stories across the Atlantic. There has been a tapering down in the average tax rate on American consumption expenditure since 1970 after modest increases before that. Canadian taxes on consumption expenditure rose steadily until the 1970s, then drop steadily in the 1970s and than rose in the 1980s and dropped again after 1992. British taxes on consumption expenditure rose sharply in the late 1960s, dropped sharply and then rose again in the 1970s and was pretty steady after that.
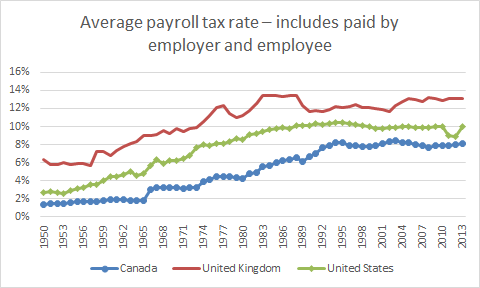
The sleeper tax in all three countries was payroll taxes to fund social security and the welfare state. These rose steadily in the USA, UK and Canada up until the 1990s.
Source: Cara McDaniel.
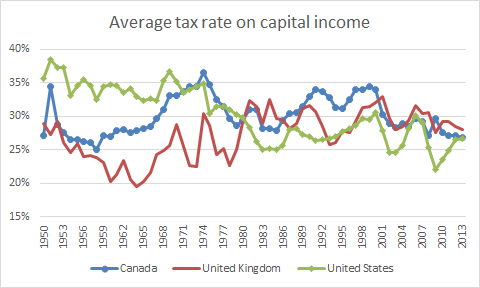
Despite all that nonsense about neoliberalism from the Left over Left, the average rate of tax on capital income did not appear to change much at all over the last 50 years. There was a modest taper in US capital income taxation from the mid-30s to the mid-20s over the entire post-war period. The average Canadian tax rate on income from capital rose steadily in the 60s, fell steadily in the 70s before rising again in the mid-1980s and fell again after 2000. The average British tax rate on capital income rose steadily in the 60s and 70s, coinciding with the emergence of Britain as a sick man of Europe, and then stabilised in the the 1980s onwards but with a dip in the late 80s before a rise in the early 1990s.. Despite the large cuts in the statutory corporate tax rate in the UK, there was only a mild taper in the average tax rate on capital income in the UK.
Source: Cara McDaniel.
The average tax rate on investment expenditures is pretty stable in the USA for the entire post-war period. The only significant increase in the average tax rate on investment expenditures in the UK coincided with the emergence of the sick man in Europe after a drop in the early 70s. The average tax rate on investment expenditures do not change at all in the UK after the 1970s. The Canadian average tax rate on investment expenditures is higher than elsewhere. It rose steadily in the 50s and 60s, dropped in the 70s and rose again in the 80s before tapering from 1992 onwards.
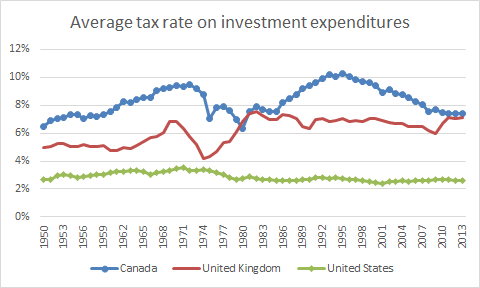
Source: Cara McDaniel.
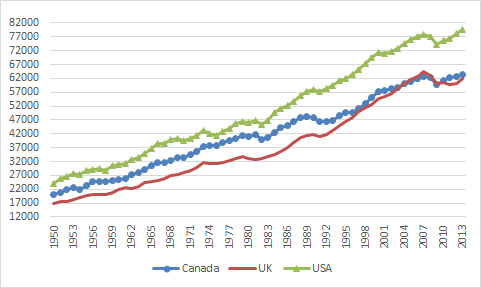
These higher on rising taxes and the UK and Canada did nothing for either country in catching up with the USA. The figure 1 below shows real GDP per working age per American, Canadian and British.
Figure 1: Real GDP per Canadian, British and American aged 15-64, converted to 2013 price level, updated 2005 EKS purchasing power parities, 1950-2013
Source: Computed from OECD StatExtract and The Conference Board, Total Database, January 2014, http://www.conference-board.org/economics
The USA is pulling away from Canada and the UK in GDP per working age person. The exception is British economy from about 1990 onwards which caught up with Canada.
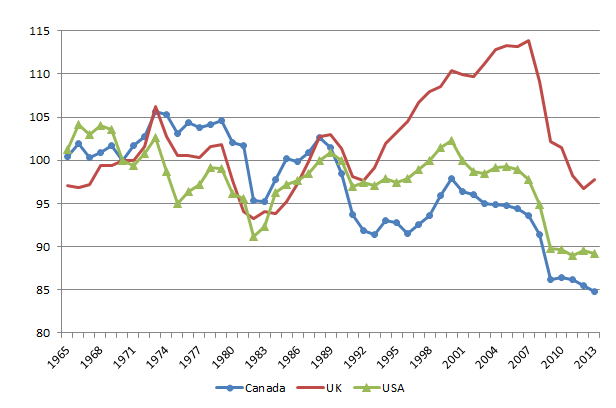
Figure 2, which is detrended GDP data, illustrates the British economic boom in the 1990s. Each country’s annual economic growth rate is detrended by 1.9%, the detrending value currently used by Ed Prescott. A flat line is growth at 1.9%, a rising line is above trend growth, a falling line is below trend growth.
Figure 2: Real GDP per Canadian, British and American aged 15-64, converted to 2013 price level, updated 2005 EKS purchasing power parities, detrended 1.9%, 1950-2013
Source: Computed from OECD Stat Extract and The Conference Board, Total Database, January 2014, http://www.conference-board.org/economics
Figure 2 shows that Canada has been in a long-term decline since the mid-1980s with much of this decline coinciding with periods of rising taxes on income from labour.
The British economy boomed in the 1990s, after the tax hikes of the 1970s and early 80s were reversed. This growth dividend was squandered by the Blair government in the 2000.
Figure 2 also shows that US growth was rather stable with some ups and downs up until 2007, expect during the productivity slowdown in the 1970s. The first major departure from trend growth of 1.9% was with the onset of the great recession.
Creative destruction in CD sales
17 Apr 2015 Leave a comment
in applied price theory, economic history, economics of media and culture, entrepreneurship, industrial organisation, Music, survivor principle Tags: creative destruction, entrepreneurial alertness
Digital music sales have exceeded those from CDs for the first time: on.wsj.com/1yp37FW http://t.co/LDOdrgGap9—
Wall Street Journal (@WSJ) April 15, 2015
Renewable energy to supply same market share in 2040 as in 1949
17 Apr 2015 Leave a comment
CHART: New EIA forecast — Fossil fuels will supply >81% of our energy for at least the next quarter century http://t.co/Oju3njQrfD—
Mark J. Perry (@Mark_J_Perry) April 15, 2015
Think renewables will be important source of future energy? Not so, fossil fuels will provide 81% of energy in 2040 http://t.co/9LOoqC3VRK—
Mark J. Perry (@Mark_J_Perry) March 15, 2015
/cdn0.vox-cdn.com/uploads/chorus_asset/file/3578930/Dubai_Islands_1920x1200.0.jpg)
Evolution of Coke 1899-1986
15 Apr 2015 Leave a comment
60 years ago North Korea was richer than the South
15 Apr 2015 1 Comment
in comparative institutional analysis, constitutional political economy, development economics, economic history, growth disasters, growth miracles Tags: capitalism and freedom, China, North Korea, South Korea


Causes of death in the 20th century
15 Apr 2015 Leave a comment
in economic history, health economics Tags: Population demographics, The Great Escape
Real GDP per Canadian and American aged 15-64, 2013 price level, updated 2005 EKS PPP, detrended, 1970-2013
15 Apr 2015 Leave a comment
in economic growth, economic history, macroeconomics, politics - USA Tags: Canada, living standards
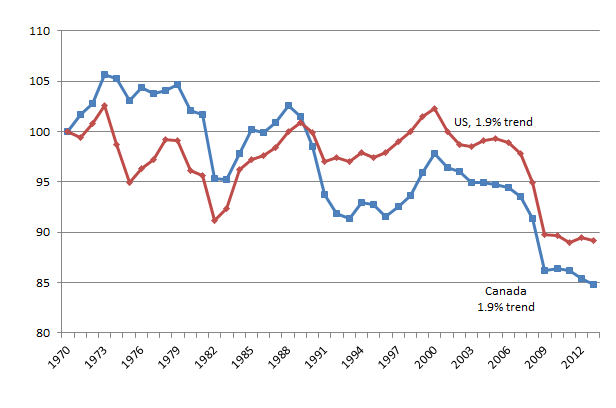
Figure 1: Real GDP per Canadian and American aged 15-64, converted to 2013 price level, updated 2005 EKS purchasing power parities, detrended 1.9%, 1970-2013, base 1970
Source: Computed from OECD Stat Extract and The Conference Board, Total Database, January 2014, http://www.conference-board.org/economics
A flat line means growth at the trend rate of 1.9%; a falling line means below trend rate of growth ; a rise in line means above trend rate of growth. Canada appears to have mostly been falling behind the USA.
Figure 2: Real GDP per Canadian and American aged 15-64, converted to 2013 price level, updated 2005 EKS purchasing power parities, 1950-2013
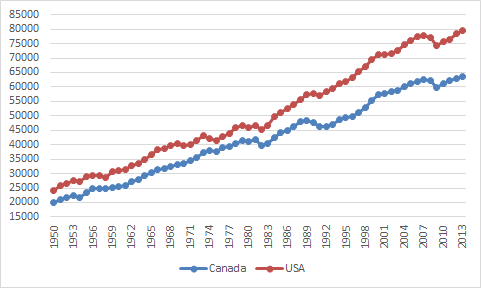
Source: Computed from OECD Stat Extract and The Conference Board, Total Database, January 2014, http://www.conference-board.org/economics.
The life and reign of English kings and queens visualised
14 Apr 2015 Leave a comment
in economic history Tags: British constitutional law
The life and reign of English kings and queens visualised gu.com/p/435fz/stw via @GuardianData @grbarnett http://t.co/f5twjrKntG—
Guardian Visuals (@GraphicGuardian) November 07, 2014
RT polio vaccine declared safe today 1955
13 Apr 2015 Leave a comment
in economic history, health economics Tags: anti-vaccination movement, polio, vaccines
2day 1955 Vaccine created by Jonas Salk against polio–scourge of the nation! is declared safe & effective! http://t.co/YgdJVEP3Il—
Hawkeye: JeSuisJuif (@inhuggermugger) April 13, 2015
In 1954, over 300,000 doctors, nurses, schoolteachers and other volunteers across the United States, Canada and Finland took part in one of the most complex and monumental medical trials in history.
The plan was to test the effectiveness of a newly-developed vaccine for a disease that was devastating the lives of children across the US: polio.
It was a mammoth task – a double-blind experiment, in which 650,000 schoolchildren were given the vaccine, 750,000 were given a placebo, and over 400,000 children acted as a control group and were given neither. For taking part, each participant was given a sweet and a certificate proclaiming their role as a‘Polio Pioneer’.
The results, announced in 1955, were just as monumental: the vaccine was safe and effective. As a direct result of the development of the vaccine, polio was completely eradicated in the US by 1979.
Global vaccination coverage
13 Apr 2015 Leave a comment
in economic history, health economics Tags: vaccinations, vaccines
Vaccination Coverage has improved in Africa, Asia, and Latin America.
From: OurWorldInData.org/data/health/va… http://t.co/ec4wsFkz1m—
Max Roser (@MaxCRoser) April 06, 2015
First morning after Sweden changed from driving on the left side, 1967
12 Apr 2015 Leave a comment
in economic history, transport economics Tags: network economics
The origins of the world’s major food crops
12 Apr 2015 Leave a comment
in economic history Tags: agricultural economics
See the origins of the world's major food #crops. http://t.co/Q92oFQeJlO—
Calestous Juma (@calestous) January 19, 2014


Recent Comments