Where I live, taxis suddenly starting texting to say they are five minutes away or outside.

Source: Why taxi drivers are suddenly getting nicer – The Washington Post
Celebrating humanity's flourishing through the spread of capitalism and the rule of law
07 Jan 2016 1 Comment
in applied price theory, economics of regulation, rentseeking, transport economics Tags: creative destruction, taxi regulation, Uber
Where I live, taxis suddenly starting texting to say they are five minutes away or outside.
Source: Why taxi drivers are suddenly getting nicer – The Washington Post
06 Jan 2016 Leave a comment
in economics of regulation, health economics, politics - New Zealand

The commitment of the Greens to credible science is dropped like a stone when they discuss fluoridation.

The Greens are no less cranky when it comes to GMOs.
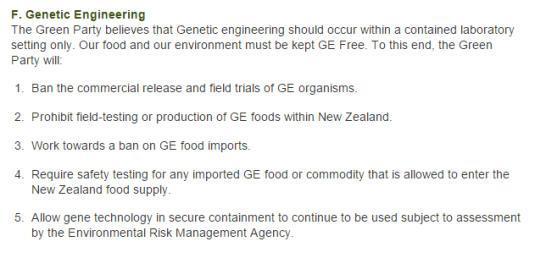
The Greens sacrifice what little scientific credibility they have left by not having a position on vaccinations and vaccine safety. I could not find any reference to it in their policy documents online.
https://twitter.com/KevinHague/status/642505850360213505
The Green Party health spokesman Kevin Hague has stated the Greens support of parents’ rights to choose which vaccine(s) (if any) their children receive without financial penalties.
05 Jan 2016 Leave a comment
in economics of regulation, environmental economics, politics - New Zealand, politics - USA, Public Choice, rentseeking, urban economics Tags: housing affordability, land use planning, RMA, zoning
04 Jan 2016 2 Comments
in economics of regulation, health and safety, health economics, labour economics
Many more drown in New Zealand than die at work. There is heavy regulation of workplace risks. The same cannot be said for people to jump into beaches, rivers and streams. Many more go to work each day as compared to going swimming.
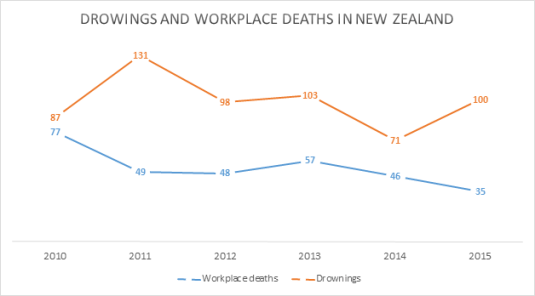
Source: Annual Statistics » DrownBase and Workplace fatalities by industry | Worksafe.
Voluntary assumption of risk cuts no ice with those that champion stronger occupational health and safety regulation. The approach to water safety is near laissez-faire both in terms of the rules and enforcement and certainly in terms of success in reducing drownings. The large variations in annual drownings suggest that human behaviour has a lot to do with drownings.
01 Jan 2016 Leave a comment
in economics of information, economics of media and culture, economics of regulation, health economics Tags: DHMO
01 Jan 2016 Leave a comment
in economics of regulation, health economics Tags: alcohol regulation, marijuana decriminalisation, medical marijuana decriminalisation, prohibition
17 Dec 2015 1 Comment
in economics of bureaucracy, economics of regulation, health economics, politics - New Zealand Tags: drug lags, Drug safety
Medsafe replicates in part or in whole the drug approval processes of its overseas counterparts. There is expedited processing for drugs already approved overseas.
Every day in which a drug approval application is sitting on the desk of a bureaucratic at Medsafe is a day in which another New Zealander may die but for that drug.
That delay in access to drugs because of the duplication in approval processes is the invisible graveyard of Medsafe. My Official Information Act requests so far have been unable to access a cost benefit analysis at the Ministry of Health that quantifies the size of that invisible graveyard.

If economists have a bitter drinking song it would be “how many people has the FDA killed today”. Many drugs became available years after they were on the market outside the USA because of drug approval lags at the FDA. The dead are many. To quote David Friedman:
In 1981… the FDA published a press release confessing to mass murder. That was not, of course, the way in which the release was worded; it was simply an announcement that the FDA had approved the use of timolol, a ß-blocker, to prevent recurrences of heart attacks. At the time timolol was approved, ß-blockers had been widely used outside the U.S. for over ten years.
It was estimated that the use of timolol would save from seven thousand to ten thousand lives a year in the U.S. So the FDA, by forbidding the use of ß-blockers before 1981, was responsible for something close to a hundred thousand unnecessary deaths.
The only rational basis for duplicating overseas drug safety approval processes is the honest belief that a New Zealand process can pick up errors. These errors must be so large that they justify the delay. If there are no such errors to pick up in a cost justified manner, the drug approval branch of Medsafe just adds to the invisible graveyard.
The Ministry of Health did advise its Minister of the unilateral recognition model in Singapore. If a drug is registered in two trusted jurisdictions, it is fast tracked. If it is registered in one other trusted jurisdiction, it goes through an expedited process. This process appears to only cut the registration process for a drug from 270 days to 240 days.
The truncated approaches when there is approval of the drug in a trusted jurisdiction usually call for access to evaluation reports and other red tape. What can drug trials in New Zealand
find out that is not already known? Medsafe targets processing applications for the approval of new drugs in New Zealand to be done within 200 days. That’s 200 days too many.

My preferred unilateral recognition process consists of authenticating the drug registration certificate from a trusted overseas jurisdiction. It would be a post-box process. The G7 countries plus Australia should be this list of trusted overseas jurisdiction. There should be automatic recognition in New Zealand of any drug registration in those jurisdictions.
There is no reason to believe that Medsafe will pick up errors of trusted jurisdictions overseas. Medsafe denied New Zealanders access to four drugs approved in comparable regulatory jurisdictions in the last three years. Medsafe rejected two other drugs in the last three years but these drugs were not approved in comparable jurisdictions. Medsafe is not involved in the funding of medicines; this is the responsibility of PHARMAC.
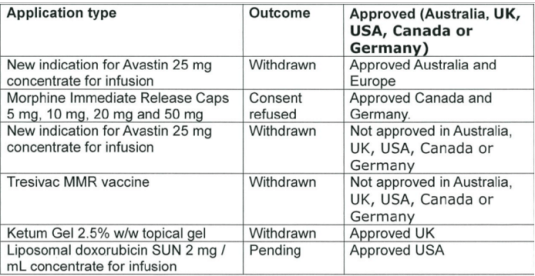
Source: data released 29 October 2015 pursuant to an Official Information Act request to the Ministry of Health.
Medsafe is turning down not even a handful of drugs were approved overseas jurisdictions in the past three years. Was that worth the wait? Was that worth a larger invisible graveyard?
The net benefits of the entire drug approval framework over the past three years in New Zealand is riding out on rejecting for approval half a dozen drugs, four of which are approved as safe in other comparable jurisdictions.
The size of the invisible graveyard has been quantified in the USA. The Prescription Drug User Fee Acts (PDUFA) reduced the drug approval time lag by 10 months:
Converting these economic gains into equivalent health benefits, we find that the more rapid access of drugs on the market enabled by PDUFA saved the equivalent of 140,000 to 310,000 life years.
A few drugs were approved that were later withdrawn. Their unfortunate consequences must always be weighed against the drugs that got to the market faster, saving lives, relieving pain and curing illnesses. That trade-off must be faced up to openly rather than as it is now left in the invisible graveyard.

17 Dec 2015 Leave a comment
in economics of natural disasters, economics of regulation, politics - New Zealand, urban economics Tags: earthquakes, efficient markets hypothesis, entrepreneurial alertness
Within the Wellington CBD, the average value of a commercial building is almost halved if it receives a legally binding earthquake-prone declaration. Discounts on specific buildings will vary around this average level, reflecting a number of factors such as costs of remediation and the nature of existing rental agreements.
15 Dec 2015 Leave a comment
in economics of regulation, energy economics, environmental economics, global warming Tags: climate alarmism, energy efficiency
14 Dec 2015 2 Comments
in applied price theory, economics of regulation, Gary Becker, industrial organisation, politics - New Zealand, politics - USA, Sam Peltzman Tags: Aaron Director, anti-trust law, cartels, competition law, creative destruction, entrepreneurial alertness, merger law enforcement, offsetting the, The fatal conceit, unintended consequences
New Zealand has decriminalised cartels. Price fixers cannot be sent to prison but can still be fined. Some agree, some disagree with the wisdom of this move.
Those that agreed with the wisdom of this move were christened cartel apologists by one of those that disagree with the removal of criminal penalties for cartels.
There is an infallible rule in competition law enforcement. It arises mostly crisply in merger law enforcement. If competitors oppose a merger, the merger must be pro-consumer. If the merger is anti-competitive, that merger will increase prices. The competing firms can follow those prices up and profit from the weakening of competition.
Under the collusion hypothesis, rivals of the merging firm benefit since there is a higher probability of successful collusion limits output and raises product prices. The share prices of these rival firms should increase in anticipation of enhanced cartel profits. As Eckbo explains:
Using Stigler (1964) theory of oligopoly, a horizontal merger can reduce the monitoring costs by reducing the number of independent producers in the industry. The fewer the members of the industry the more “visible” are each producers actions, and the higher is the probability of detecting members who try to cheat on the cartel by increasing output.
When was the last time an entrepreneur complained about his rivals putting their prices up? The entrepreneur can either match that price increase or undercut it to win more business. The real reason competitors oppose a merger is the merged firm will have lower costs, making it a fiercer competitor.

If the share prices of competitors fall on news of the merger, they are worse off as a result because they face a fiercer competitor. If their share prices rise, that suggests either that others in the industry are to benefit from higher prices or rival firms will soon replicate the cost savings discovered in the course of the merger. The latter is the information effect of mergers:
…since the production technologies of close competitors are (by definition) closely related, the news of a proposed efficient merger can also signal opportunities for the rivals to increase their productivity
Mergers are a high-risk way of securing higher prices unless there are offsetting cost saving of combining the two firms. Mergers disturb previously efficient firm sizes and risk diseconomies of scale and a burgeoning corporate hierarchy. A cartel is a safer way to raise prices by jointly agreeing to restrict output.

Cartels have few redeeming features. Cartels are inherently unstable because the history of cartels is the history of double-crossing. The best place in a cartel is to be on the outside undercutting it slightly to sell as you can at inflated cartel price.
The complication with cartels is competitors must sometimes coordinate their activities with their rivals in various ways such as agreeing product standards, undertaking joint ventures or licensing technologies to them.
Criminalisation of cartels may deter these business practices that promote consumer welfare. The process of innovation in new industries in particular often involves successful firms taking over the unsuccessful firms.
Serial competition is common in rapidly innovating industries with one dominant firm making hay for a while then quickly swept away. Merger law enforcement agencies do not handle the wake of creative destruction well.

There is no more cutthroat market than Hollywood. Yet the movie industry is riddled with collusion and joint ventures. Actors and producers can be collaborating on one film and also be making another film that will be its rival in the box office when released.
The movie industry would not work without this incestuous mix of competition and collaboration. Joint ventures are aplenty between otherwise direct competitors in the film industry. When do these joint ventures become cartels threatened with criminal penalties?
What should be another working rule in competition law enforcement is when there is reasons to stay your hand, that is usually a good idea even if you do not have the reasons worked out yet. When in doubt, stay your hand.
It goes back to that extremely famous 1984 essay by Frank Easterbrook on the limits of anti-trust law. The essay was about errors in competition policy and law enforcement:
Easterbrook argued that courts and enforcers should craft liability and procedural rules to minimise the sum of competition law’s error and decision costs:
The legal system should be designed to minimize the total costs of (1) anticompetitive practices that escape condemnation; (2) competitive practices that are condemned or deterred; and (3) the system itself
Competition law enforcers and policymakers made plenty of errors in the past. Chastened by their follies aplenty in the past, competition law policymakers should not approach any issue with overconfidence. They have had a dismal track record in aligning competition law with applied price theory and the basics of the economics of industrial organisation.
That is at best only a good start for the competition law enforcement agencies. This is because the economics of industrial organisation spent a lot of time condemning practices that neither restricted output or increased prices.
It took many decades for consumer welfare to be the exclusive goal of competition. Time and again protecting competitors from competition was the priority of competition law enforcement agencies.

The ICT revolution coincided with a revolution in competition law economics and policy. That revolution consisted of basing competition law on applied price theory and not condemning every novel or as yet unexplained practice.
In the high-tech industries, competition law runs a high risk of chilling innovation. As Joshua Wright said:
Innovation is critical to economic growth. Incentives to innovate are at the heart of the antitrust enterprise in dynamically competitive industries, and, thus, getting antitrust policy right in high-tech markets is an increasingly important component of regulatory policy in the modern economy. While antitrust enforcement activity in high-tech markets in the United States and the rest of the world is ever-increasing, there remain significant disputes as to how to assess intervention in dynamically competitive markets.
The relentless pursuit of Microsoft by the US Department of Justice at the behest of its competitors such as Netscape is notorious example of the chilling of innovation.
You are showing your age if you even remember who Netscape was. Its complaint was that Microsoft by giving away its browser was engaging in predatory competition.

Netscape want to protect consumers from the scourge of lower prices – from not having to pay $49 for the Netscape browser. You are showing your age if you have ever paid to install a browser.
Netscape had the advantage of a senior US senator representing the state where it was based. He happened to sit on the committee overseeing the budget of the US Anti-trust enforcement agencies.

We are still waiting for the day when Microsoft finishes giving away its browser, excludes competition from the market for browsers, jacks up its price to make up for a good 20 years of giving away its browser and is not immediately threatened by new entry.
Facebook is now worth more than Walmart
buff.ly/1fuvV7V h/t @DKThomp
$FB $WMT buff.ly/1fuvSZB http://t.co/FtIIJP3EGN—
Ninja Economics (@NinjaEconomics) June 22, 2015
The intrepid competition law enforcers of the 1990s did not anticipate a business model where competitors profitably give their product away.
Thankfully, Facebook did not face competitors who charged for their social media. If Facebook had faced such competition, what would the US Department of Justice thought of this anti-competitive practice of giving social media away. The scourge of lower prices again. That great bugbear of competition law enforcement agencies.
10 years ago today Facebook was founded by Mark Zuckerberg and his college friends http://t.co/IVFDFvu2VM—
History Pics (@HistoryPixs) February 04, 2014
Facebook is doing the exact same thing that Microsoft did when it gave away the Internet Explorer browser. To this day, competition law enforcement agencies including the New Zealand Commerce Commission do not accept lower prices to be lawful in all cases without exception.

A test of how imbibed you are with the fatal conceit about competition law is to cast your mind back as to what your attitude was to the Department of Justice anti-trust lawsuit against Microsoft.
If you thought the anti-trust lawsuit against Microsoft was well-founded, you are an optimist about the efficient scope of competition law. To quote McKenzie and Shughart:
Microsoft’s critics come far closer to the mark when they complain that Microsoft has been “brutally competitive” than when they claim Microsoft is a “monopoly.” From our perspective, it appears that once again the Justice Department is using the antitrust laws to thwart competition by a highly successful American firm. To protect unsuccessful competitors, it is squelching competition.
A long time has passed since that suit. People can reflect upon the extent to which Microsoft have successfully monopolised browsing the Internet. It hasn’t. As Gary Becker said:
Anti trust policy should recognize that dynamic competition is often a powerful force when static competition is weak. The big policy question then is whether it is worthwhile to bring expensive and time consuming anti trust cases against still innovating firms that have considerable profits and monopoly power, given the significant probability that new competitors will before long greatly erode this power through different products? I believe the answer to that is no, and that policy should often rely on dynamic competition, even when that allows dominant firms only temporarily to enjoy economic power.
The law and economics of competition has been a bit of a glass house for the last 50 years. People should be careful about criticising new idea and attempts to be more modest about the positive contribution the competition law makes to society.
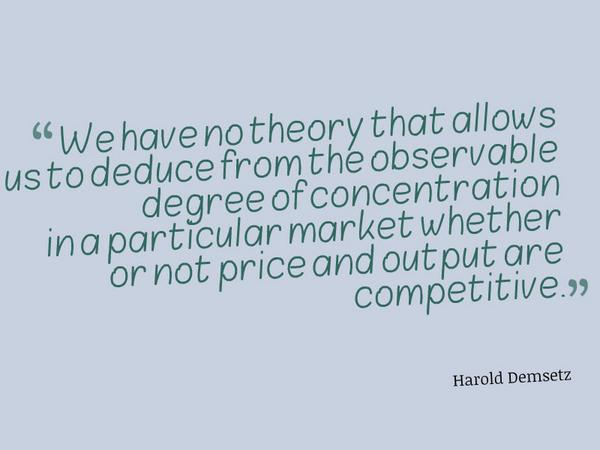
Competition law can subvert competition by stymieing the introduction of new goods and the temporary monopoly often necessary to recoup their invention costs and induce innovation. Sam Peltzman, when reflecting on the contributions of Aaron Director to the law and economics of competition said:
There are the myriad of ways in which real world business practices behave differently from the caricaturing in textbooks. Those differences sometimes arouses suspicious responses from economists. Visions of market power and deadweight loss triangles dance their heads, and some of the suspect practices have been constrained by anti-trust policy. Director rejected this kind of intellectual laziness, and he sought, sometimes successfully, to inoculate those around him against it.
Director approached all business practices with the methodology that entailed asking very basic questions and answering them in a rigorous logic that it appealed ultimately to facts. The style was verbal – some combination of Socratic dialogue and Adam Smith. This style had the disadvantage of producing few closed-form solutions. But it had the advantage of permitting analysis of the kind of problems that eluded simple solutions.
Indeed I believe that one reason for Director’s lasting influence he was able to show that simple judgements about business practices often cannot withstand rigorous scrutiny.
Economic theory and empirical evidence are full of examples of business conduct that reduce choice but increase consumer welfare through lower prices, more innovation, or higher quality products and services. Manne and Wright noted in the paper, Innovation and the Limits of Antitrust that:
Both product and business innovations involve novel practices, and such practices generally result in monopoly explanations from the economics profession followed by hostility from the courts (though sometimes in reverse order) and then a subsequent, more nuanced economic understanding of the business practice usually recognizing its pro-competitive virtues.
Competition law enforcement agencies are suing Google because it is anti-competitive. The dead hands of the competitors to Google are buried somewhere in those suits. Is there no learning. There is certainly no modesty about past mistakes about the proper scope of competition law.

13 Dec 2015 Leave a comment
in economics of regulation, energy economics, environmental economics, global warming, politics - New Zealand Tags: climate aid, climate alarmism, green rent seeking, international climate treaties, New Zealand Greens
Paris was a tremendous defeat for the climate alarmists. Now that they have their treaty – a non-binding treaty – their ability to stir up political momentum to do more is undermined. If the environmental movement already has their agreement to save the world, why is anything more necessary. Especially anything that is costly to the hip-pocket such as a carbon tax.
The Greens, rarely for them, have settled for half measures. That was unwise considering these half measures are nothing at all apart from climate aid. Few like to remember that the Republicans still control the U.S. Congress. Centre-right parties control most governments in Europe.
13 Dec 2015 Leave a comment
in economics of bureaucracy, economics of media and culture, economics of regulation, income redistribution, Marxist economics, politics - USA, Public Choice, rentseeking Tags: 2016 presidential election, expressive voting, left-wing populists, Leftover Left, rational ignorance, rational irrationality, right-wing populists
09 Dec 2015 Leave a comment
in development economics, economic history, economics of bureaucracy, economics of crime, economics of regulation, growth disasters, growth miracles, income redistribution, industrial organisation, law and economics, Public Choice, rentseeking Tags: bribery and corruption, capitalism and freedom, rent seeking, rule of law, The Great Fact
Corruption vs. Human Development (HDI) http://t.co/WNlSMYzdWD—
Max Roser (@MaxCRoser) August 08, 2015
06 Dec 2015 1 Comment
in economics of regulation, energy economics, environmental economics, global warming Tags: Hotelling, offsetting behaviour, Oil prices, OPEC, The fatal conceit
Matthew Kahn wrote a fascinating blog post today on the impact of climate change, regulatory risks and fossil fuels disinvestment campaigns on investment portfolios.
At the end of that post, Kahn discussed the implications of a threatened carbon tax extraction rates of fossil fuels and the level of greenhouse gases:
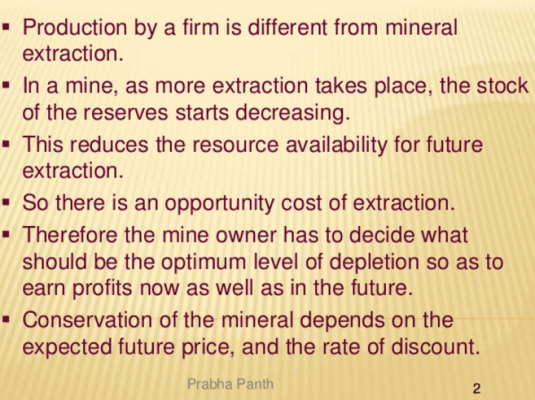
Suppose that Exxon is aware that there will be a rising $100 carbon tax 50 years from now. Al Gore has claimed (in a 2014 WSJ piece) that this carbon pricing will lead to “stranded assets” and Exxon shareholders will suffer greatly.
He needs to study his Hotelling no-arbitrage condition. Exxon will simply increase its extraction upfront to avoid this tax and the carbon emissions will occur earlier!
Regulatory uncertainty fostered by Greenpeace will have the same result of increasing extraction rates and carbon emissions with it because of the lower oil prices.
If Greenpeace looks like implementing any of its anti-growth, anti-poor, antidevelopment policies in a country, investors will respond by extracting as much as they can in anticipation of the regulatory crackdown.
Not long after I joined the Department of Finance from university, I remember attending a Treasury seminar that gave a property rights explanation of oil prices in the 1970s.
It was an alternative hypothesis to the OPEC cartel explanation. This was always a clumsy explanation because of the instability of cartels. Not only does OPEC not control the majority of production even in the 1970s, several members have been at war with each other and other OPEC member countries frequently in terrible financial straits with every incentive to cheat on their OPEC production quotas
Under the property rights hypothesis for oil prices, the oil companies anticipated nationalisation and pumped as much oil as they could before they were nationalised. This depressed prices prior to these nationalisations for as far back as the mid-50s. After these nationalisations, the oil companies became contractors who ran the oil fields on behalf of the national government who expropriated them.

After the nationalisation in the late 60s and early 70s, the radical change in property rights structure reduced extraction rates and with it increased oil prices in the international markets.
The oil price increases were a result of the change in control over production from the oil companies to the oil-producing countries. With these nationalisations there was a change from high rates of time preference to low rates on the part of the production decision-makers.

There was over-depletion because of insecure property rights. OPEC deserves credit for introducing long-overdue conservation policies to the benefit of generations of consumers then unborn.
The same logic applies to threats of a carbon tax. That risk encourages more depletion today so oil producers can sell at the untaxed rate. This will increase greenhouse gas emissions because oil prices will be depressed.
Policies that limit or reduce revenues in the future will induce the resource owners to bring their sales forward to the present. To quote Hans-Werner Sinn:
In my view, the Green Paradox is not simply a theoretical possibility. I believe it explains why fossil fuel prices have failed to rise since the 1980s, despite decreasing stocks of fossil fuels and the vigorous growth of the world economy.
The emergence of green policy movements around the world, rising public awareness of the climate problem, and increased calls for demand reducing policy measures, ranging from taxes and demand constraints to subsidies on green technologies, have alarmed resource owners.
In fact, while most of us perceived these developments as a breakthrough in the battle against global warming, resource owners viewed them as efforts that threatened to destroy their markets. Thus, in anticipation of the implementation of these policies, they accelerated their extraction of fossil fuels, bringing about decades of low energy prices.
Celebrating humanity's flourishing through the spread of capitalism and the rule of law
Celebrating humanity's flourishing through the spread of capitalism and the rule of law
Celebrating humanity's flourishing through the spread of capitalism and the rule of law
Celebrating humanity's flourishing through the spread of capitalism and the rule of law
Celebrating humanity's flourishing through the spread of capitalism and the rule of law
Celebrating humanity's flourishing through the spread of capitalism and the rule of law
Celebrating humanity's flourishing through the spread of capitalism and the rule of law
Celebrating humanity's flourishing through the spread of capitalism and the rule of law
A History of the Alt-Right
Econ Prof at George Mason University, Economic Historian, Québécois
Celebrating humanity's flourishing through the spread of capitalism and the rule of law
Scholarly commentary on law, economics, and more
Beatrice Cherrier's blog
Celebrating humanity's flourishing through the spread of capitalism and the rule of law
Celebrating humanity's flourishing through the spread of capitalism and the rule of law
Celebrating humanity's flourishing through the spread of capitalism and the rule of law
Why Evolution is True is a blog written by Jerry Coyne, centered on evolution and biology but also dealing with diverse topics like politics, culture, and cats.
Celebrating humanity's flourishing through the spread of capitalism and the rule of law
A rural perspective with a blue tint by Ele Ludemann
DPF's Kiwiblog - Fomenting Happy Mischief since 2003
Celebrating humanity's flourishing through the spread of capitalism and the rule of law
The world's most viewed site on global warming and climate change
Tim Harding's writings on rationality, informal logic and skepticism
A window into Doc Freiberger's library
Let's examine hard decisions!
Commentary on monetary policy in the spirit of R. G. Hawtrey
Thoughts on public policy and the media
Celebrating humanity's flourishing through the spread of capitalism and the rule of law
Politics and the economy
A blog (primarily) on Canadian and Commonwealth political history and institutions
Reading between the lines, and underneath the hype.
Economics, and such stuff as dreams are made on
"The British constitution has always been puzzling, and always will be." --Queen Elizabeth II
Celebrating humanity's flourishing through the spread of capitalism and the rule of law
Celebrating humanity's flourishing through the spread of capitalism and the rule of law
WORLD WAR II, MUSIC, HISTORY, HOLOCAUST
Undisciplined scholar, recovering academic
Celebrating humanity's flourishing through the spread of capitalism and the rule of law
Res ipsa loquitur - The thing itself speaks
In Hume’s spirit, I will attempt to serve as an ambassador from my world of economics, and help in “finding topics of conversation fit for the entertainment of rational creatures.”
Researching the House of Commons, 1832-1868
Reflections on books and art
Posts on the History of Law, Crime, and Justice
Celebrating humanity's flourishing through the spread of capitalism and the rule of law
Exploring the Monarchs of Europe
Cutting edge science you can dice with


Recent Comments