Uber has grown faster in its first five years than Facebook did buff.ly/1eTxaNH http://t.co/dD1Gv1djkb—
Business Insider (@businessinsider) June 06, 2015
Uber has grown faster in its first five years than Facebook
26 Jun 2015 Leave a comment
in economic history, economics of media and culture, financial economics, industrial organisation, survivor principle Tags: creative destruction, Facebook, Uber
"You didn’t build that" – which of sport superstars, celebrities and top CEOs earn their pay more?
25 Jun 2015 Leave a comment
in applied price theory, applied welfare economics, entrepreneurship, financial economics, industrial organisation, Marxist economics, politics - New Zealand, politics - USA, rentseeking, sports economics, survivor principle Tags: CEO pay, Leftover Left, obama, superstar wages, superstars, top 1%
Defenders have also pointed to the pay of pro ballplayers or Hollywood stars, but they do not determine their own pay (as CEOs do) and are paid based on performance. Once they begin to fail, they are dumped. By contrast, CEO pay isn’t tied to performance in any meaningful way.
It’s a big concession to say that athletes and celebrities earn their pay but top CEOs don’t. Most of all, that concession changes the case against the top 1% from inequality to just desert – a big shift in theories of distributive justice. It’s also a big risk to base the argument for greater equality and a 80% top tax rate not only on the excesses of CEOs but on the very specific and testable hypothesis that these CEOs determine their own pay.
if we are to look at CEOs, top athletes and Hollywood celebrities, it is the athletes and celebrities who benefited the most from the windfall of been able to service huge markets through the global media market.
Figure 1: CEO pay and share market performance

Source: Economic Policy Institute.
CEOs actually have to run large complex companies to earn their pay, which is why their compensation tracks the share market relatively closely. Athletes and celebrities don’t do that what they do any better than in the past. They simply do it in front of a global media market. Since the late 1970s, the ratio of average pay of CEOs of large public companies to the average market value of those companies has stayed relatively constant: CEO pay grew hand in hand with corporations.

Steven Kaplan and Joshua Rauh make a number of basic points backed up by detailed evidence about CEO pay:
- While top CEO pay has increased, so has the pay of private company executives and hedge fund and private equity investors;
- ICT advances increase the pay of many – of professional athletes (technology increases their marginal product by allowing them to reach more consumers), Wall Street investors (technology allows them to acquire information and trade large amounts more easily), CEOs and technology entrepreneurs in the Forbes 400; and
- Technology allows top executives and financiers to manage larger organizations and asset pools – a loosening of social norms and a lack of independent control of CEO pacesetting does not explain similar increases in pay for private companies– technology explains it;

To put it simply:
If the reason for growth of incomes at the very top is, say, managerial power in publicly owned companies, then one would expect the increases in income at the top levels to be much larger for that group.
But the breadth of the occupations that have seen a rise in top income levels is much more consistent with the argument that the increase in “superstar” pay (or pay at the top) has been driven by the growth of information and communications technology, and the ways this technology allows individuals with particular skills that are in high demand to expand the scale of their performance.
As for the turnover argument, that underperforming athletes and celebrities are dropped, prior to the GFC, CEO turnover was already on the rise:
Turnover is 14.9% from 1992 to 2005, implying an average tenure as CEO of less than seven years. In the more recent period since 1998, total CEO turnover increases to 16.5%, implying an average tenure of just over six years.
Internal turnover is significantly related to three components of firm performance – performance relative to industry, industry performance relative to the overall market, and the performance of the overall stock market.
Only 21.3% of CEOs in 1992 remained in that role in 1999; only 16.35% of CEOS on the job in 2000 were there in 2007. In any given year, one out of six Fortune 500 CEOs loses their jobs, compared to one out of 10 in the 1970s.

Dirk Jenter and Fadi Kanaan in a study of of 3,365 CEO turnovers from 1993 to 2009 found that:
CEOs are significantly more likely to be dismissed from their jobs after bad industry and, to a lesser extent, after bad market performance. A decline in industry performance from the 90th to the 10thpercentile doubles the probability of a forced CEO turnover.
In another study, Kaplan found that average CEO pay increased substantially during the 1990s, but declined by more than 30% from peak levels reached around 2000.

In addition, private company executives have seen their pay increase by at least as much as public companies. Private company executives with fewer agency problems have increased by more than public company executives. To close with another quote from Kaplan:
The point of these comparisons is to confirm that while public company CEOs earn a great deal, they are not unique. Other groups with similar backgrounds–private company executives, corporate lawyers, hedge fund investors, private equity investors and others—have seen significant pay increases where there is a competitive market for talent and managerial power problems are absent.
Again, if one uses evidence of higher CEO pay as evidence of managerial power or capture, one must also explain why these professional groups have had a similar or even higher growth in pay. It seems more likely that a meaningful portion of the increase in CEO pay has been driven by market forces as well.
Facebook is now worth more than Wal-Mart
25 Jun 2015 Leave a comment
in economic history, economics of media and culture, entrepreneurship, financial economics, industrial organisation, survivor principle Tags: creative destruction, entrepreneurial alertness, Facebook, Walmart
Facebook is now worth more than Walmart
buff.ly/1fuvV7V h/t @DKThomp
$FB $WMT buff.ly/1fuvSZB http://t.co/FtIIJP3EGN—
Ninja Economics (@NinjaEconomics) June 22, 2015
GM’s 1956 vision of a self drive car by 1976
22 Jun 2015 Leave a comment
in economic history, economics of media and culture, entrepreneurship, industrial organisation, survivor principle, transport economics Tags: creative destruction, self drive cars
Biggest box office successes by profit ratio
21 Jun 2015 Leave a comment
in economics of media and culture, entrepreneurship, industrial organisation, movies, survivor principle Tags: entrepreneurial alertness, markets selection, The meaning of competition
Paranormal Activity earned 3,592x its budget in domestic ticket sales alone. #dataviz
Source: randalolson.com/2014/12/29/the… http://t.co/i6RALzOChI—
Randy Olson (@randal_olson) December 30, 2014
Every 20 years we worry about losing jobs to technology
17 Jun 2015 Leave a comment
in economics of education, entrepreneurship, human capital, industrial organisation, labour economics, labour supply, occupational choice, Public Choice, rentseeking, survivor principle Tags: antimarket bias, creative distraction, expressive voting, make-work bias, rational ignorance, rational irrationality, technological unemployment
Every 20 years we worry about losing jobs to tech. books.google.com/ngrams/graph?c… http://t.co/KW47Iwzsp9—
James Bessen (@JamesBessen) August 10, 2014
Creative destruction in legacy media revenues
16 Jun 2015 Leave a comment
in economics of media and culture, entrepreneurship, industrial organisation, survivor principle Tags: creative destruction, economics of advertising, entrepreneurial alertness, legacy media, market selection
The media needs a new formula for paying for news gathering, says @bradwarthen: brook.gs/1JlfWUT http://t.co/QDGti24x1f—
Brookings (@BrookingsInst) May 15, 2015

Is Uber taking British customers for a ride?
14 Jun 2015 Leave a comment
in economics of regulation, entrepreneurship, industrial organisation, survivor principle Tags: creative destruction, taxi regulation, Uber
Is Uber taking British customers for a ride? i100.io/40kqOqH http://t.co/ok7UJmmgNQ—
i100 (@thei100) June 11, 2015

There is rampant height discrimination in the movie business?
13 Jun 2015 Leave a comment
in discrimination, industrial organisation, labour economics, movies, survivor principle Tags: competition as a discovery procedure, height discrimination, Hollywood economics, market selection, statistical discrimination, The meaning of competition


Spare me the conspiracy theories. When an actor or actress walks into a scene, the first impression of the audience is not supposed to be about how tall they are or how they differ in height from those already on the stage or film set.
This casting decision can be deliberate or simply that actors who do not differ as much in height seem to work well together and have more successful careers because of better rapport.
The scourge of lower prices illustrated
12 Jun 2015 Leave a comment
in applied price theory, applied welfare economics, industrial organisation, international economics, survivor principle Tags: antimarket bias, competition in monopoly, globalisation, import competition, import parity pricing, international trade, The meaning of competition
TIL America Online is still in business
12 Jun 2015 Leave a comment
in economic history, entrepreneurship, industrial organisation, survivor principle Tags: creative destruction, entrepreneurial alertness, market selection
After 18 years of acquisitions, sales, and spinoffs, AOL is still holding its own bloom.bg/1IwBaQp http://t.co/Qjwd94THPB—
Bloomberg VisualData (@BBGVisualData) May 17, 2015
The rising gales of creative destruction in brewing
09 Jun 2015 Leave a comment
in economic history, economics of regulation, entrepreneurship, health economics, industrial organisation, survivor principle Tags: alcohol regulation, beer brewing, creative destruction, entrepreneurial alertness, innovation
Breweries in the US http://t.co/rcYlpmJspa—
Charts and Maps (@ChartsandMaps) April 11, 2015
Corporate welfare in New Zealand – 2015 budget update
09 Jun 2015 2 Comments
in applied price theory, applied welfare economics, comparative institutional analysis, economics of bureaucracy, industrial organisation, politics - New Zealand, rentseeking, survivor principle Tags: corporate welfare
I have updated my 2014 report on corporate welfare for the 2015 budget. My report was published today by the Taxpayers’ Union.
My key finding was that corporate welfare increased in the 7th budget of the National Party-led Government from $1.178 billion in its 2014 budget to $1.344 billion in the 2015 budget – see figure 1 and table 1.
Figure 1: Corporate welfare, Budgets 2008/09 to 2015/16

Source: New Zealand budget papers, various years.
Table 1: Corporate welfare in Budgets 2008/09 to 2015/16, $million
| 08/09 | 09/10 | 10/11 | 11/12 | 12/13 | 13/14 | 14/15 | 15/16 | |
| Arts, Culture & Heritage |
3 |
11 |
19 |
10 |
29 |
4 |
4 |
42 |
| Commerce and Consumer Affairs |
6 |
6 |
6 |
6 |
7 |
7 |
6 |
7 |
| Communications |
0 |
25 |
39 |
150 |
178 |
205 |
215 |
190 |
| Economic Development |
372 |
419 |
446 |
379 |
332 |
284 |
280 |
297 |
| Finance |
16 |
44 |
3 |
108 |
15 |
210 |
0 |
0 |
| Primary Industries |
700 |
0.3 |
14 |
0.0 |
43 |
65 |
77 |
180 |
| Science and Innovation |
0 |
4 |
0 |
0 |
0 |
112 |
219 |
269 |
| Tourism |
76 |
94 |
119 |
113 |
98 |
124 |
124 |
121 |
| Transport |
578 |
530 |
376 |
510 |
680 |
119 |
255 |
239 |
| Total $million |
1,751 |
1,134 |
1,022 |
1,277 |
1,382 |
1,130 |
1,178 |
1,344 |
Source: New Zealand budget papers, various years.
Corporate welfare has ranged between about $1 billion and $1.4 billion per year in each of the seven budgets presented by the current National-led Government – see Table 1 and Figures 1 and 2.
Figure 2: Corporate welfare, Budgets 08/09 to 15/16 by Vote
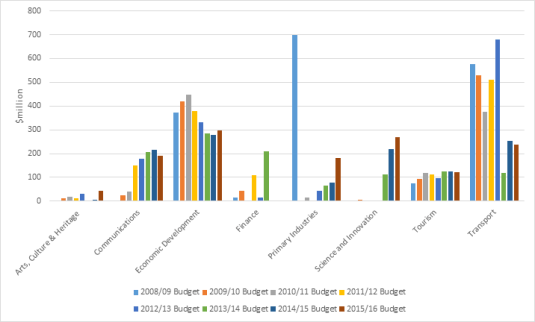
Source: New Zealand budget papers, various years; note: Vote Commerce and Consumer Affairs omitted in all years from Figure 2.
The predominant recipient of corporate welfare in this year’s budget, and all of those since 2008 is KiwiRail. Vote Transport accounts for a third of all corporate welfare – see Figures 3 and 4. Vote Economic Development is the next largest source of corporate welfare and accounts for 28% of the total since 2008 – see Figures 3 and 4.
Figure 3: Distribution of total corporate welfare across votes, 2008/09 to 2015/16

Source: New Zealand budget papers, various years.
Figure 4: State-owned enterprise welfare, Vote Transport and Vote Finance (KiwiRail), Budgets 08/09 to 15/16

Source: New Zealand budget papers, various years.
$280 – $450 million in corporate welfare has been under the patronage of the Minister for Economic Development over the last eight budgets – see Figure 5. In this year’s budget, corporate welfare under the Minister’s hand has increased slightly from $280 million to $297 million.
Figure 5: Corporate welfare, Vote Economic Development, Budgets 2008/09 to 2015/16
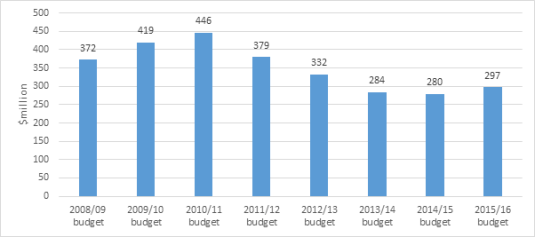
Source: New Zealand budget papers, various years.
Up until the 2013/14 budget, science and innovation spending was targeted at research that would not find private sponsors because it could not capture the returns from their discoveries – see Figure 6. Figure 6 shows that there is being rapid growth within Vote Science and Innovation of various forms of start-up and commercialisation grants in recent budgets.
Figure 6: Corporate welfare, Vote Science and Innovation, Budgets 08/09 to 15/16

Source: New Zealand budget papers, various years.
Figure 7 shows that the Government is getting back into the business of subsidising agriculture. The Primary Growth Partnership (PGP) is an R&D grants programme for the primary industry sector. There are 18 PGP programmes underway with a funding commitment from government and from industry combining to $708 million by 2017.
Figure 7: Farm welfare, Vote Primary Industries, Budgets 08/09 to 15/16
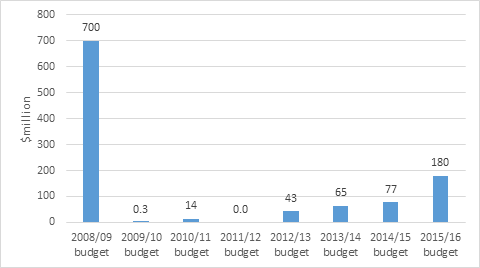
Source: New Zealand budget papers, various years.
Figure 8 shows that the National Party-led government is a major investor in ultrafast broadband – going where private entrepreneurs fear to tread.
Figure 8: Corporate welfare, Vote Communications, Budgets 08/09 to 15/16

Source: New Zealand budget papers, various years.
The corporate welfare in the Budget 2015 adds about six percentage points to the company tax rate. Should these corporate indulgences should continue or should the company tax rate drop six percentage points?
If that six percentage points on top of the company tax rate was renamed a business subsidies levy, how many businesses would want to pay it rather than developing their own business under much lower company tax rate?

Recent Comments