Every 20 years we worry about losing jobs to tech. books.google.com/ngrams/graph?c… http://t.co/KW47Iwzsp9—
James Bessen (@JamesBessen) August 10, 2014
Every 20 years we worry about losing jobs to technology
17 Jun 2015 Leave a comment
in economics of education, entrepreneurship, human capital, industrial organisation, labour economics, labour supply, occupational choice, Public Choice, rentseeking, survivor principle Tags: antimarket bias, creative distraction, expressive voting, make-work bias, rational ignorance, rational irrationality, technological unemployment
Creative destruction in legacy media revenues
16 Jun 2015 Leave a comment
in economics of media and culture, entrepreneurship, industrial organisation, survivor principle Tags: creative destruction, economics of advertising, entrepreneurial alertness, legacy media, market selection
The media needs a new formula for paying for news gathering, says @bradwarthen: brook.gs/1JlfWUT http://t.co/QDGti24x1f—
Brookings (@BrookingsInst) May 15, 2015

Is Uber taking British customers for a ride?
14 Jun 2015 Leave a comment
in economics of regulation, entrepreneurship, industrial organisation, survivor principle Tags: creative destruction, taxi regulation, Uber
Is Uber taking British customers for a ride? i100.io/40kqOqH http://t.co/ok7UJmmgNQ—
i100 (@thei100) June 11, 2015

There is rampant height discrimination in the movie business?
13 Jun 2015 Leave a comment
in discrimination, industrial organisation, labour economics, movies, survivor principle Tags: competition as a discovery procedure, height discrimination, Hollywood economics, market selection, statistical discrimination, The meaning of competition


Spare me the conspiracy theories. When an actor or actress walks into a scene, the first impression of the audience is not supposed to be about how tall they are or how they differ in height from those already on the stage or film set.
This casting decision can be deliberate or simply that actors who do not differ as much in height seem to work well together and have more successful careers because of better rapport.
The scourge of lower prices illustrated
12 Jun 2015 Leave a comment
in applied price theory, applied welfare economics, industrial organisation, international economics, survivor principle Tags: antimarket bias, competition in monopoly, globalisation, import competition, import parity pricing, international trade, The meaning of competition
TIL America Online is still in business
12 Jun 2015 Leave a comment
in economic history, entrepreneurship, industrial organisation, survivor principle Tags: creative destruction, entrepreneurial alertness, market selection
After 18 years of acquisitions, sales, and spinoffs, AOL is still holding its own bloom.bg/1IwBaQp http://t.co/Qjwd94THPB—
Bloomberg VisualData (@BBGVisualData) May 17, 2015
The rising gales of creative destruction in brewing
09 Jun 2015 Leave a comment
in economic history, economics of regulation, entrepreneurship, health economics, industrial organisation, survivor principle Tags: alcohol regulation, beer brewing, creative destruction, entrepreneurial alertness, innovation
Breweries in the US http://t.co/rcYlpmJspa—
Charts and Maps (@ChartsandMaps) April 11, 2015
Corporate welfare in New Zealand – 2015 budget update
09 Jun 2015 2 Comments
in applied price theory, applied welfare economics, comparative institutional analysis, economics of bureaucracy, industrial organisation, politics - New Zealand, rentseeking, survivor principle Tags: corporate welfare
I have updated my 2014 report on corporate welfare for the 2015 budget. My report was published today by the Taxpayers’ Union.
My key finding was that corporate welfare increased in the 7th budget of the National Party-led Government from $1.178 billion in its 2014 budget to $1.344 billion in the 2015 budget – see figure 1 and table 1.
Figure 1: Corporate welfare, Budgets 2008/09 to 2015/16

Source: New Zealand budget papers, various years.
Table 1: Corporate welfare in Budgets 2008/09 to 2015/16, $million
| 08/09 | 09/10 | 10/11 | 11/12 | 12/13 | 13/14 | 14/15 | 15/16 | |
| Arts, Culture & Heritage |
3 |
11 |
19 |
10 |
29 |
4 |
4 |
42 |
| Commerce and Consumer Affairs |
6 |
6 |
6 |
6 |
7 |
7 |
6 |
7 |
| Communications |
0 |
25 |
39 |
150 |
178 |
205 |
215 |
190 |
| Economic Development |
372 |
419 |
446 |
379 |
332 |
284 |
280 |
297 |
| Finance |
16 |
44 |
3 |
108 |
15 |
210 |
0 |
0 |
| Primary Industries |
700 |
0.3 |
14 |
0.0 |
43 |
65 |
77 |
180 |
| Science and Innovation |
0 |
4 |
0 |
0 |
0 |
112 |
219 |
269 |
| Tourism |
76 |
94 |
119 |
113 |
98 |
124 |
124 |
121 |
| Transport |
578 |
530 |
376 |
510 |
680 |
119 |
255 |
239 |
| Total $million |
1,751 |
1,134 |
1,022 |
1,277 |
1,382 |
1,130 |
1,178 |
1,344 |
Source: New Zealand budget papers, various years.
Corporate welfare has ranged between about $1 billion and $1.4 billion per year in each of the seven budgets presented by the current National-led Government – see Table 1 and Figures 1 and 2.
Figure 2: Corporate welfare, Budgets 08/09 to 15/16 by Vote
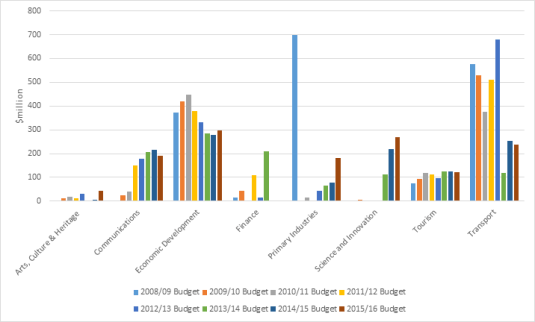
Source: New Zealand budget papers, various years; note: Vote Commerce and Consumer Affairs omitted in all years from Figure 2.
The predominant recipient of corporate welfare in this year’s budget, and all of those since 2008 is KiwiRail. Vote Transport accounts for a third of all corporate welfare – see Figures 3 and 4. Vote Economic Development is the next largest source of corporate welfare and accounts for 28% of the total since 2008 – see Figures 3 and 4.
Figure 3: Distribution of total corporate welfare across votes, 2008/09 to 2015/16

Source: New Zealand budget papers, various years.
Figure 4: State-owned enterprise welfare, Vote Transport and Vote Finance (KiwiRail), Budgets 08/09 to 15/16

Source: New Zealand budget papers, various years.
$280 – $450 million in corporate welfare has been under the patronage of the Minister for Economic Development over the last eight budgets – see Figure 5. In this year’s budget, corporate welfare under the Minister’s hand has increased slightly from $280 million to $297 million.
Figure 5: Corporate welfare, Vote Economic Development, Budgets 2008/09 to 2015/16
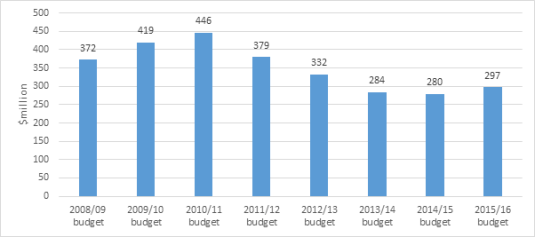
Source: New Zealand budget papers, various years.
Up until the 2013/14 budget, science and innovation spending was targeted at research that would not find private sponsors because it could not capture the returns from their discoveries – see Figure 6. Figure 6 shows that there is being rapid growth within Vote Science and Innovation of various forms of start-up and commercialisation grants in recent budgets.
Figure 6: Corporate welfare, Vote Science and Innovation, Budgets 08/09 to 15/16

Source: New Zealand budget papers, various years.
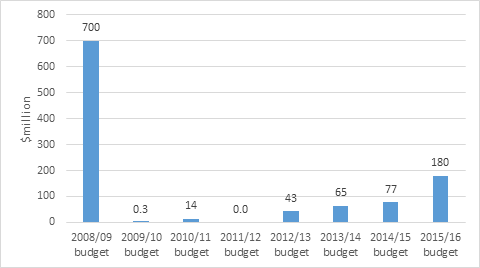
Figure 7 shows that the Government is getting back into the business of subsidising agriculture. The Primary Growth Partnership (PGP) is an R&D grants programme for the primary industry sector. There are 18 PGP programmes underway with a funding commitment from government and from industry combining to $708 million by 2017.
Figure 7: Farm welfare, Vote Primary Industries, Budgets 08/09 to 15/16
Source: New Zealand budget papers, various years.
Figure 8 shows that the National Party-led government is a major investor in ultrafast broadband – going where private entrepreneurs fear to tread.
Figure 8: Corporate welfare, Vote Communications, Budgets 08/09 to 15/16

Source: New Zealand budget papers, various years.
The corporate welfare in the Budget 2015 adds about six percentage points to the company tax rate. Should these corporate indulgences should continue or should the company tax rate drop six percentage points?
If that six percentage points on top of the company tax rate was renamed a business subsidies levy, how many businesses would want to pay it rather than developing their own business under much lower company tax rate?
Rise of private R&D and the fall of public R&D
06 Jun 2015 Leave a comment
in applied price theory, economic history, entrepreneurship, industrial organisation, politics - USA, rentseeking, survivor principle, technological progress Tags: creative destruction, entrepreneurial alertness, private R&D, public R&D, R&D

Who among the top 1% and top 0.1% increased their share of income most between 1979 and 2005?
03 Jun 2015 Leave a comment
in economic history, entrepreneurship, financial economics, human capital, industrial organisation, labour economics, labour supply, occupational choice, survivor principle Tags: CEO pay, entrepreneurial alertness, Occupy Wall Street, separation of ownership and control, superstar wages, superstars, top 0.1%, top 1%, Twitter left
The members of the top 1% whose income increased the most between 1979 and 2005 were real estate professionals followed by financial professionals – see figure 1.
Figure 1: increase in share of national income (including capital gains) received by top 1% for each primary taxpayer occupation in top 1% between 1979 and 2005

Source: Jon Bakija, Adam Cole and Bradley T. Heim “Jobs and Income Growth of Top Earners and the Causes of Changing Income Inequality: Evidence from U.S. Tax Return Data”.
Figure 2 shows that the fastest-growing shares among the top 1% as in figure 1 are not necessarily the largest occupational group are those income earners. Moreover, their fortunes seem largely unrelated to each other.
Figure 2: Percentage of national income (including capital gains) received by top 1%, and each primary taxpayer occupation in top 1%

Source: Jon Bakija, Adam Cole and Bradley T. Heim “Jobs and Income Growth of Top Earners and the Causes of Changing Income Inequality: Evidence from U.S. Tax Return Data”.
The next members of the top 1% in terms of income growth were rather respectable group:professionals and scientists and arts, media and sports. The latter,arts, media and sports get a complete pass on their membership of the top 1% despite their great success in increasing their incomes since 1979 at the expense apparently on the bottom 99% if the Twitter Left is to be believed.
Figure 3: increase in share of national income (including capital gains) received by top 0.1% for each primary taxpayer occupation in top 0.1%between 1979 and 2005

Source: Jon Bakija, Adam Cole and Bradley T. Heim “Jobs and Income Growth of Top Earners and the Causes of Changing Income Inequality: Evidence from U.S. Tax Return Data”.
Arts, media and sports superstars are one of the fastest-growing members of the top 0.1% – see figure 3. Again, the arts, media and sports superstars get a complete pass on their membership of the top 0.1% from the Twitter Left. Most of the other occupations in the top 0.1% don’t strike me as anything other than working rich – see figure 3 and figure 4.
As with the top 1%, the top 0.1% of income earners are a mixed bag of occupations – see figure 4. Their fortunes are unrelated to each other terms of the forces driving there are increased incomes.
Figure 4: Percentage of national income (including capital gains) received by top 0.1%, and each primary taxpayer occupation in top 0.1%

Source: Jon Bakija, Adam Cole and Bradley T. Heim “Jobs and Income Growth of Top Earners and the Causes of Changing Income Inequality: Evidence from U.S. Tax Return Data”.
Creative destruction in digital devices
01 Jun 2015 Leave a comment
in economics of media and culture, entrepreneurship, industrial organisation, survivor principle, technological progress Tags: cell phones, creative destruction, entrepreneurial alertness, PCs, smart phones, The Great Enrichment
1993 vs 2013: http://t.co/tdnNqmRmcS—
History Pics (@HistoryPixs) January 08, 2014
How much of the top 0.1% are now working rich in the USA, 1916–2013, and Canada, 1946–2007
01 Jun 2015 Leave a comment
in economic history, entrepreneurship, human capital, industrial organisation, labour economics, labour supply, occupational choice, survivor principle Tags: Canada, CEO pay, creative destruction, entrepreneurial alertness, super-entrepreneurs, superstar wages, superstars, top 0.1%, top 1%, working rich
Piketty and Saez (2003) concluded that a substantial fraction of the rise in top incomes was due to surging top wage incomes. They concluded that top executives (the ‘working rich’) replaced top capital owners (the ‘rentiers’) at the top of the income hierarchy.
That conclusion still holds for both the USA and Canada. The largest portion of the top 0.1% in both countries have become those earning wages. The top 0.1% are top wage earners who work for their livings founding, building or directing businesses.
Figure 1: percentage of top 0.1% with wages, salaries, pensions or entrepreneurial incomes, USA, 1916 – 2013

Source: Alvaredo, Facundo, Anthony B. Atkinson, Thomas Piketty and Emmanuel Saez, The World Top Incomes Database.
Figure 2: percentage of top 0.1% with incomes from interest, dividends and rents, USA, 1916 – 2013

Source: Alvaredo, Facundo, Anthony B. Atkinson, Thomas Piketty and Emmanuel Saez, The World Top Incomes Database.
Figure 3: percentage of top 0.1% with wage salary and pension incomes, business incomes and professional incomes, Canada, 1946 – 2007

source : Alvaredo, Facundo, Anthony B. Atkinson, Thomas Piketty and Emmanuel Saez, The World Top Incomes Database.
Figure 4: percentage of top 0.1% with dividend, interest or investment incomes, Canada, 1946 – 2007

Source: Alvaredo, Facundo, Anthony B. Atkinson, Thomas Piketty and Emmanuel Saez, The World Top Incomes Database.


Recent Comments