Fact checking @Bernie Sanders latest presidential debate
27 Nov 2015 Leave a comment
in applied price theory, applied welfare economics, economic growth, labour economics, politics - USA, poverty and inequality, welfare reform Tags: 2016 presidential election, Leftover Left, Twitter left
@economicpolicy gathers more evidence of a waning gender pay gap @joshbivens_DC @eliselgould
22 Nov 2015 Leave a comment
in applied price theory, discrimination, economic history, gender, human capital, labour economics, labour supply, minimum wage, occupational choice, poverty and inequality Tags: asymmetric marriage premium, Claudia Goldin, compensating differentials, economics of fertility, gender wage gap, marriage and divorce, power couples
As part of a large paper calling for massive government intervention, the Economic Policy Institute, impeccably left-wing, massed a considerable amount of evidence about the withering away of the gender wage gap and anomalies in what is left of that gap. None of these anomalies bolster the case for more regulation of the labour market.
The first of their charts showed the large reduction in the gender wage gap in the USA. Women’s wages have been increasing consistently over the last 40 years or so. The second of their tweeted charts shows that women of all races consistently outperformed men in wages growth, often by a large margin.
Their most interesting chart is about how the gender gap is not only highest among top earners, their pay gap has not fallen at all in the last 40 years. If anything, that gender wage gap is rising at the top end of the labour market albeit slowly. Progress in closing the gender gap been pretty consistent at the lower pay levels. That progress is certainly better than no progress at all.

The Economic Policy Institute didn’t enquire in any detail into why women with the most options in the labour market had made the least progress in closing the gender wage gap.
None of their solutions such as more collective-bargaining and a higher minimum wage will help the top end of the job market.
There is an anomaly in the Economic Policy Institute’s reasoning. The women who would suffer least from a purported inequality of bargaining power inherent in the capitalist system and have plenty of human capital have had least success in closing the gender pay gap. These women can shop around for better job offers and start their own businesses. Many do because they are professionals where self-employment and professional partnerships are common.
The better discussions of the gender wage gap emphasise choice. Women choosing at the top end of the labour market to balance career and family and choosing the occupation and education where the net advantages of doing that are the greatest. As the Economic Policy Institute itself notes:
In 2014, the gap was smallest at the 10th percentile, where women earned 90.9 percent of men’s wages. The minimum wage is partially responsible for this greater equality among the lowest earners, as it results in greater wage uniformity at the bottom of the distribution.
The gap is highest at the top of the distribution, with 95th percentile women earning 78.6 percent as much as their male counterparts. Economist Claudia Goldin (2014) postulates that the gap is larger for women in high-wage professions because they are penalized for not working long, inflexible hours that often come with many professional jobs, due in large part to the arrival of children and long-standing social expectations about the division of household labour between men and women.
What the Economic Policy Institute does not explain is why these long-standing social expectations about the division of household labour should be strongest among well-paid women with plenty of options.
Among these options of high-powered women in well-paid jobs is the ability to buy every labour-saving appliance, hire a nanny and ample childcare and acquire everything else on the list of demands of the Economic Policy Institute on closing the gender pay gap. Something doesn’t add up?

Of course, the Economic Policy Institute discusses the unadjusted gender wage rather than the adjusted gender wage. When you study the gender wage gap after making adjustments for demographic and other obvious factors, it is clear that this pay gap is driven by the choices women make between career and family.
Claudia Goldin did a great study of Harvard MBAs using online surveys of their careers. This is the very group that according to the Economic Policy Institute have made the least progress in bringing down patriarchy in the labour market. Specifically, the overturning of traditional expectations about the marital division of labour in childcare and parenthood.
https://twitter.com/alyssalynn7/status/669219008747610113
Goldin found that three proximate factors accounted for the large and rising gender gap in earnings among MBA graduates as their careers unfold:
- differences in training prior to MBA graduation,
- differences in career interruptions, and
- differences in weekly hours.
The greater career discontinuity and shorter work hours for female MBAs are largely associated with motherhood. There are some careers that severely penalise any time at all out of the workforce or working less than punishingly long and rigid hours.
A 2014 Harvard Business School study found that 28 percent of recent female alumni took off more than six months to care for children; only 2 percent of men did.

Claudia Goldin found one counterfactual that cancels out the gender wage gap amongst MBA professionals: hubby earns less! Female MBAs who have a partner who earn less than them earn as much as the average MBA professional on an hourly basis but work a few less hours per week.
The gender wage gap is persisted in high-paying jobs because career women have so many options. Studies of top earning professionals show that they make quite deliberate choices between family and career. The better explanation of why so many women are in a particular occupation is job sorting: that particular job has flexible hours and the skills do not depreciate as fast for workers who take time off, working part-time or returning from time out of the workforce.
Low job turnover workers will be employed by firms that invest more in training and job specific human capital:
- Higher job turnover workers, such as women with children, will tend to move into jobs that have less investment in specialised human capital, and where their human capital depreciates at a slower pace.
- Women, including low paid women, select careers in jobs that match best in terms of work life balance and allows them to enter and leave the workforce with minimum penalty and loss of skills through depreciation and obsolescence.
This is the choice hypothesis of the gender wage gap. Women choose to educate for occupations where human capital depreciates at a slower pace.
The gender wage gap for professionals can be explained by the marriage market combined with assortative mating:
- Graduates are likely to marry each other and form power couples; and
- There tends to be an age gap between men and women in long-term relationships and marriages of two years.
This two-year age gap means that the husband has two additional years of work experience and career advancement. This is likely to translate into higher pay and more immediate promotional prospects.
An interesting and informed look at the pay gap between men and women economist.com/blogs/freeexch… https://t.co/0nxtC9ILWo—
Charles Read (@EconCharlesRead) November 06, 2015
Maximising household income would imply that the member of the household with a higher income, and greater immediate promotional prospects stay in the workforce. This is entirely consistent with the choice hypothesis and equalising differentials as the explanation for the gender wage gap. As Solomon Polachek explains:
At least in the past, getting married and having children meant one thing for men and another thing for women. Because women typically bear the brunt of child-rearing, married men with children work more over their lives than married women. This division of labour is exacerbated by the extent to which married women are, on average, younger and less educated than their husbands.
This pattern of earnings behaviour and human capital and career investment will persist until women start pairing off with men who are the same age or younger than them. That is, more women will have to start marrying down in both income and social maturity.

Productivity and the National Living Wage
21 Nov 2015 1 Comment
in applied price theory, applied welfare economics, entrepreneurship, industrial organisation, labour economics, minimum wage, politics - New Zealand, poverty and inequality, survivor principle Tags: British economy, living wage
A brilliant point by @FlipChartRick in the reblog. What sort of single year labour productivity increase is required to cover a UK living wage increase. Basic arithmetic kills.
A 6.6% annual productivity growth would be required to fund a living wage. This will be far above trend and would be required in sectors such as services that are not at all known for rapid productivity growth because of Baumol’s disease.
A subsequent Twitter exchange updated a key chart to include Australia and New Zealand.
The CIPD and the Resolution Foundation are collaborating on a piece of research into the impact of the National Living Wage (NLW). According to their first study over half of the country’s employers expect to be affected by it. Around a third said they would meet the increased cost by improving productivity and 22 percent said they would take lower profits. Only 15 percent said they would lay off workers or slow down recruitment.
That all sounds promising but, as Matt Whittaker points out, the productivity increase needed to cover the cost of the NLW could be pretty steep. As you might expect, there is a strong relationship between rising minimum wages and rising productivity. Most countries in the OECD have not strayed very far from this line of best fit.
 In the absence of any productivity growth, the proposed NLW would move some way from the line (the green circle) by 2016 and…
View original post 565 more words
How labour and other markets work
18 Nov 2015 Leave a comment
in applied price theory, Austrian economics, entrepreneurship, human capital, industrial organisation, labour economics, labour supply, Milton Friedman, minimum wage, occupational choice, poverty and inequality, survivor principle, unions Tags: market process, The meaning of competition
Unions – not the cause of our 40 hour workweek
10 Nov 2015 Leave a comment
in applied price theory, applied welfare economics, economic history, entrepreneurship, health and safety, human capital, industrial organisation, labour economics, labour supply, Marxist economics, minimum wage, politics - Australia, politics - New Zealand, politics - USA, poverty and inequality, unions Tags: The Great Enrichment, union power, union wage premium
Child poverty by British Prime Minister since 1961
03 Nov 2015 Leave a comment
in economic growth, economic history, poverty and inequality
When I pointed out yesterday that the only periods of sustained real household income growth in recent British history was under those neoliberal lapdogs Thatcher and Blair, the Twitter Left on Reddit decided rather prematurely I might say that:
The prime minister rarely influences broad economic realities — like commodity prices or interest rates, or double digit economic growth in china. Elections frequently change the party in power AFTER the economy turns downwards. As though that party had anything to do with the down turn.
I’m sure that the morally centred Twitter Left will be equally forgiving of the sustained rise in child poverty due to many more workless households shown in the chart below under Thatchernomics. The only sustained fall in child poverty rates in recent British history was under Tony Blair. The British Left and current British Labour Party leadership dismiss him as a continuation of Thatchernomics.
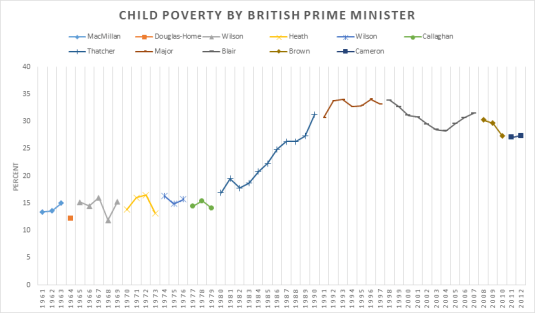
Source: Incomes in the UK – Institute For Fiscal Studies – IFS.
Top incomes and the decline of unions in Canada, France and Italy
03 Nov 2015 Leave a comment
in applied price theory, applied welfare economics, economic history, entrepreneurship, industrial organisation, labour economics, labour supply, Milton Friedman, poverty and inequality, Public Choice, rentseeking, unions Tags: Canada, entrepreneurial alertness, France, Italy, top 1%, union power, union wage premium
The French ruling class is as lazy as their transnational co-conspirators down under. French union membership is in serious decline albeit from a low base. An opportunity lost for the French ruling class. It has not lifted a finger to extract additional labour surplus from the downtrodden French proletariat now stripped of their only line of collective defence against capitalist exploitation.

Source: OECD Stat and Top Incomes Database.
The top 10% and top 1% in France are no better off than two generations ago despite the decline of French unions. The French Left must be most disappointed. No kicking in the rotten door of the permanent revolution anytime soon after the immiserised French proletariat rises up because it has nothing to lose but its chains. The 21st century version of the Marxist call to the barricades would be a proletariat stirred to revolution with nothing to lose but their suburban home, motorcar, IPad and air points

Source: OECD Stat and Top Incomes Database.
The Italian ruling class has had little success in bringing Italian unions down. The top 10% in Italy is earning no more now than back when the Red Brigades were gunning for them.

Source: OECD Stat and Top Incomes Database.
The top 1% in Italy is doing a little bit better than when the Red Brigade was gunning for them, but not much more. Unions don’t figure in explaining that small rise in Italian top 1% incomes over the last 40 years. Italian unions are pretty much a strong as they were 40 years ago in membership. Italian employment protection laws are pretty much as strong as they used to be too.

Source: OECD Stat and Top Incomes Database.
The Canadian ruling classes even more incompetent than their transnational co-conspirators over in Italy. There appears to have been next to no decline in union membership in Canada. The Canadian top 10% is not earning any more than back in the 60s.

Source: OECD Stat and Top Incomes Database.
The Canadian top 1% is doing a little bit better than 25 years ago also but not off the back of unions which are almost as strong as in the past. The Canadian Left will have to look for a different hypothesis than the ravages of the top 1%.

Source: OECD Stat and Top Incomes Database.
All in all, the Economic Policy Institute simply got lucky with a spurious correlation between top incomes and union membership in the USA.
Did the British disease pass retirees by? British retiree and non-retiree median real household income by Prime Minister since 1977
03 Nov 2015 Leave a comment
in applied welfare economics, economic growth, economic history, macroeconomics, poverty and inequality Tags: British economy, British politics, Margaret Thatcher, Tony Blair
The British disease and the horrors of Thatchernomics past British retirees by as did pretty much the Global Financial Crisis. Slow and steady as she goes under every Prime Minister since 1977 has been year in year out result for the real disposable median incomes of British retired households. Despite it all, British retiree household incomes increased by 170% since the winter of discontent. The fastest growth in retiree incomes was under Tony Blair.
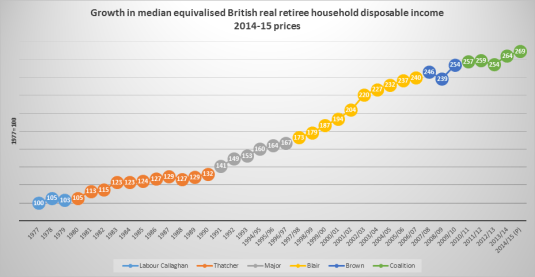
Source: Release Edition Reference Tables – ONS.
Notes:
1 Households are ranked by their equivalised disposable incomes, using the modified-OECD scale.
2 1994/95 represents the financial year ending 1995, and similarly through to 2014/15, which represents the financial year ending 2015.
3 Income figures have been deflated to 2014/15 prices using an implied deflator for the household sector.
It has been a much rockier ride for British households yet to retire. Once again, the only time a sustained real income increases for non-retired households was under Thatcher and Blair. Despite it all, household real incomes have doubled since the winter of discontent. The majority of that doubling was under the dead hand of Tony Blair. British Labour now spends a considerable amount of time repudiating that time of unusually rapid household income growth across all of British society.
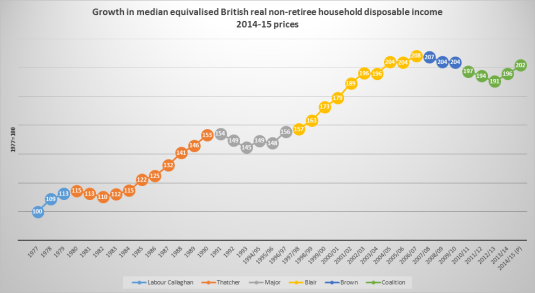
Source: Release Edition Reference Tables – ONS.
Notes:
1 Households are ranked by their equivalised disposable incomes, using the modified-OECD scale.
2 1994/95 represents the financial year ending 1995, and similarly through to 2014/15, which represents the financial year ending 2015.
3 Income figures have been deflated to 2014/15 prices using an implied deflator for the household sector.
@resfoundation shows @jeremycorbyn how good it was under Blair
02 Nov 2015 Leave a comment
in applied welfare economics, economic history, labour economics, poverty and inequality
@Greencatherine 1996 US welfare reforms and the employment of single mums who were high school dropouts
31 Oct 2015 Leave a comment
in labour economics, labour supply, politics - USA, poverty and inequality, welfare reform Tags: 1996 US welfare reforms, paternal labour supply, single mothers, single parents, social insurance, welfare state
https://twitter.com/hamiltonproj/status/659776768094547968
There was a step increase in the employment rate of single parents and in particular high school dropouts straight after the implementation of the 1996 US federal welfare reforms.
These single mothers who dropped out of high school were thought to be least employable and most at risk to the 1996 US welfare reform. There was a large increase in their employment and this massive improvement in their rates of employment is enduring to this day.

New Zealand child poverty compared internationally
30 Oct 2015 Leave a comment
in labour economics, politics - Australia, politics - New Zealand, politics - USA, poverty and inequality Tags: child poverty
Every 3rd Child in the US lives in poverty.
(in #Norway & #Finland: https://t.co/K5Ub2QuPoE—
Max Roser (@MaxCRoser) October 21, 2015
@zoesqwilliams has great timing on capitalism not doing enough on poverty @worstall
23 Oct 2015 Leave a comment
in development economics, economic history, growth disasters, growth miracles, Marxist economics, poverty and inequality Tags: extreme poverty, global poverty, Leftover Left, life expectancies, The Great Escape, The Great Fact, Twitter left
When Zoe Williams was born in 1973, 60% of humanity lived in extreme poverty. That has dropped to 1 in 10.
When my father was born, 7 in 10 people lived in absolute poverty.
Today, it's 1 in 10! https://t.co/1Caqku3AY1—
Tim Fernholz (@TimFernholz) October 21, 2015
Just the other day, the World Bank estimated that extreme poverty has dropped below 10% of the world’s population for the first time in human history but some are still grumbling.
What will it take to finish the “Last Mile” in ending extreme #poverty? brook.gs/1LiFT8E http://t.co/YxSZ36VCSW—
Brookings (@BrookingsInst) October 07, 2015
Zoe Williams is not grumbling about the failed states and predatory government responsible for the last pockets of extreme poverty, but about the inequality from economic progress under capitalism.
The extreme poor live in conflict & rural areas: wrld.bg/Nynge #endpoverty http://t.co/43HDDI11JR—
World Bank (@WorldBank) May 31, 2015
Zoe Williams honestly believes that extreme poverty could have been reduced faster if we had taken on the socialist road.
These 4 nations are 50% of mankind. That's 3.5 billion people who are living longer. buff.ly/1Kle6mU #health http://t.co/949oqisMsL—
HumanProgress.org (@humanprogress) June 30, 2015
China and India escaped from extreme poverty by rejecting socialism.
Just released: new global poverty estimates from 1990-2015 using updated extreme poverty line http://t.co/LxD5q2n6Mg—
Laurence Chandy (@laurencechandy) October 04, 2015
China and India received next to no overseas development assistance in their Great Escape from extreme poverty.
Embrace the free market and overtake your socialist competitors. buff.ly/1PZ3yuN http://t.co/xfpF4vtqlv—
HumanProgress.org (@humanprogress) October 05, 2015
There’s been some clear-cut natural experiments such as between Chile and Venezuela and Japan, Hong Kong, Singapore and just about any other developing country in terms of capitalism as the only path to prosperity.

Recent Comments