@garethmorgannz @geoffsimmonz the public choice illogic of the UBI

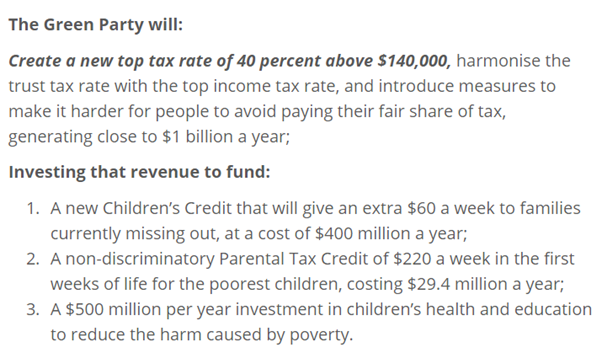
Things are pretty grim when your ideas for fixing child poverty by throwing a lot more money at the problem are easily outclassed by the Greens in terms of economic rationale, fiscal sense and political practicality.
image

Source: Greens launch billion dollar plan to reduce child poverty | Green Party of Aotearoa New Zealand.

But that is the case for Gareth Morgan’s proposals for a universal basic income for New Zealand. His proposal for a universal basic income funded by comprehensive capital tax make much less sense than those of the Greens for giving the in work family tax credit for those do not work but are on a welfare benefit.

The Greens have a far superior proposal for reducing child poverty and a far better chance of getting it implemented in parliament. Their proposal is simply to introduce a parental tax credit and give the in work tax credit to those currently on the benefit to increase their incomes.

Gareth Morgan’s solution to child poverty is to give billions of dollars to adults not in poverty and leave those who are in poverty worse off under the universal basic income. It is obvious which of these is more likely to attract political support and provoke resistance from taxpayers and political parties willing to court those are opposed to great big new taxes.

One of the economic reforms in the 1980s and 1990s that saved the welfare state was more efficient taxes and more efficient government spending. The targeting of government social spending reduce  growth in the overall tax burden and therefore the political resistance it provoked.

Government spending grew in many countries in the 20th century because of demographic shifts, more efficient taxes, more efficient spending, a shift in the political power from those taxed to those subsidised, shifts in political power among taxed groups, and shifts in political power among subsidised groups. Sam Peltzman argues that:

governments grow where groups which share a common interest in that growth and can perceive and articulate that interest become more numerous.

The median voter in all countries was alive to the power of incentives and to not killing the goose that laid the golden egg. After 1980, the taxed, regulated and subsidised groups had an increased incentive to converge on new lower cost modes of redistribution.

More efficient taxes, more efficient spending, more efficient regulation and a more efficient state sector reduced the burden of taxes on the taxed groups. Most subsidised groups benefited as well because their needs were met in ways that provoked less political opposition.

Gary Becker and Casey Mulligan in Deadweight Costs and the Size of Government (NBER Working Paper Number No. 6789) concluded that flatter and broader taxes encourage bigger government. This is because taxpayers offer less resistance to increases in flat tax rates than to more onerous and less efficient forms of taxation. Any decline in the resistance of taxpayers to taxes leads to larger governments since an endless number of groups lobby to divide up the large revenue base.

An inefficient tax system or spending program  from the standpoint of optimal tax theory can improve taxpayer welfare this so-called inefficient system creates additional political pressure for suppressing the growth of government. Inefficient taxes do not raise much revenue and therefore do not support a large sized government.

A switch to more efficient taxes through tax reforms allows governments to raise the same amount or larger amount of revenue for the same level of political resistance from taxpayers. This is because less revenue and output is wasted by discouraging labour supply, investment, savings and investment in capital with high marginal rates of tax on narrower tax basis.

The rising deadweight losses of taxes, transfers and regulation all limit the political value of inefficient redistributive policies. Tax and regulatory policies that are found to significantly cut the total wealth available for redistribution by governments are avoided relative to the germane counter-factual, which are other even costlier modes of redistribution.

Everyone can gain from converging on more efficient modes redistribution. The tax burden is less than otherwise. Government spending is more than a wise because taxes are raised with less deadweight social costs.

An improvement in the efficiency of either taxes or spending reduces political pressure from taxed and regulated groups for suppressing the growth of government and thereby increases total tax revenue and spending because there is less political opposition. Improvements in the efficiency of taxes, regulation and in spending reduce political pressure from the taxed and regulated groups in society.

The post-1980 reforms of Thatcher, Reagan, Clinton, Hawke and Keating, Lange and Douglas and others saved the modern welfare state. Their moves towards more efficient taxes and better targeted social spending  did reduce growth in government spending but also prevented even larger cuts to  social spending since 1980 at the behest of the increasingly restive taxpayer.

Social spending growth did temper after 1980 but the level of spending was larger than otherwise because of the extra revenue raised through more efficient taxes – more efficient taxes which provoked less political opposition.

More efficient taxes, more efficient spending, more efficient regulation and a more efficient state sector reduced the burden on the taxed groups while still supporting extensive but more tempered social spending.

Governments everywhere hit a brick wall in terms of their ability to raise further tax revenues. Political parties of the Left and Right recognised this new reality. Gareth Morgan has not when he proposes a great big new tax to fund his universal basic income.

Billions of extra dollars in revenue must be raised and political resistance provoked to his proposed comprehensive capital tax to fund a universal basic income for those who are not poor. Child poverty is not reduced  by a universal basic income because single parents and the children receive no more income support from government than before.

Which has more political legs? The Greens’ proposal to raise taxes by $1 billion to fight child poverty or the proposal by Gareth Morgan to raise taxes by 10 times that and have less impact on child poverty?

The current and future governments of New Zealand have enough on their plate to work out how to fund  a universal old age pension and health spending without giving away billions of dollars to the non-poor through an universal basic income.
@garethmorgannz @geoffsimmonz the labour supply effects of UBI – updated

One of the many drawbacks of the universal basic income is it will induce the recipients to cut back on their labour supply. There are studies of this labour supply effect through the study of what happens when people win the lottery – either the big one or a small prize.

Winning the lottery is the equivalent of winning an annuity equal to whatever annual income you can get it current low interest rates and share market returns.

A surprisingly number of people on the Left who deny that taxes have significant labour supply effects will nonetheless accept that winning the lottery will induce people to quit work permanently or cut back at least. The most likely reason is they buy lottery tickets too.

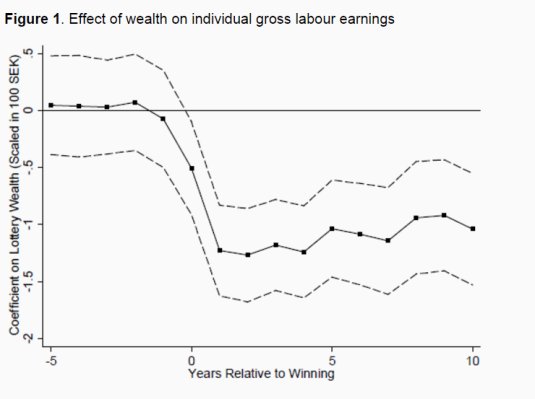
A study has just come out on the labour supply effects of winning the Swedish lottery. The sample in this study was really big: several million Swedish lottery winners.

Sweden seems to be like the USA in that both are awash with interesting economic data to the many other countries do not collect. Moreover, they were able to study these Swedish lottery winners over a 5 to 10-year period. Labour supply detail at that level is like going to heaven for an empirical labour economists.

Source: Labour supply responses of lottery winners | VOX, CEPR’s Policy Portal.

The researchers found that in common with a previous study of the labour supply of lottery winners after their win that there were

modest reductions in labour earnings suggesting every dollar of universal basic income would reduce labour earnings by roughly $0.11.

The new research also found productivity losses of $1.40 for every hundred dollars of lottery winnings and that the partners of the lottery winners cut back on their labour suppliers well. No surprise there. Taking all these labour supply effects into account, our researchers concluded that:

every dollar won in a lottery reduces lifetime after-tax labour earnings of winners by $0.10-$0.20.

All in all, the universal basic income will be a negative productivity shock built on a negative productivity shock. First of all, there is the great big new tax to fund the universal basic income. Then the recipients of the basic income will cut back on their labour supply further compounding the massive social costs of the universal basic income.
A universal basic income is a bad idea from start to finish and that is before you consider the many advantages of encouraging people to work for their living. Working for your living is a central expectation of adult life.

UPDATE: what is the magnitude of this labour supply drop from universal basic income? The usual labour supply effect of a recession as recently summarised by Richard Rogerson is as follows:

Consider by way of comparison the labour market fluctuations associated with the business cycle. Going from normal times to a fairly severe recession is usually associated with a drop in total hours worked of about 3 percent.

A universal basic income will push the New Zealand economy into recession off the back of labour supply effect from the windfall increase in incomes alone. That is before you consider the massive productivity shock pushing the economy down further through a massive increase in the taxation of capital, which is the most inefficient form of taxation.

62 Billionaires alert: technology diffusion could have been so much faster but for their profit-taking

@FairnessNZ shows how everything is getting better in NZ @FIRST_Union

The union movement posted two excellent charts during the last election showing how well things have gone since the 1980s economic reforms and their consolidation in the early 1990s.

The charts show that real wage growth returned in the early 1990s after the passage of the Employment Contracts Act and the consolidation of government finances. This was after two decades of wage stagnation in what the unions regards as the good old days.

Furthermore, as the union chart shows, the average incomes of the top 1% in New Zealand is a pretty stable for several decades. Whatever else is happening New Zealand, you cannot blame it on the top 1% because they are lazy. What increase there was in average top incomes in New Zealand was followed by the return of real wage growth in New Zealand and a long economic boom where the unemployment rate drop below 3.5%

The main bugbear is housing affordability which is a result of the Resource Management Act passed in 1993 as the union chart shows. The unions, the Labour Party and Greens all support the laws that result in this housing unaffordability.

Child poverty is twice 30 years ago? @GarethMorgan @povertymonitor @geoffsimmonz

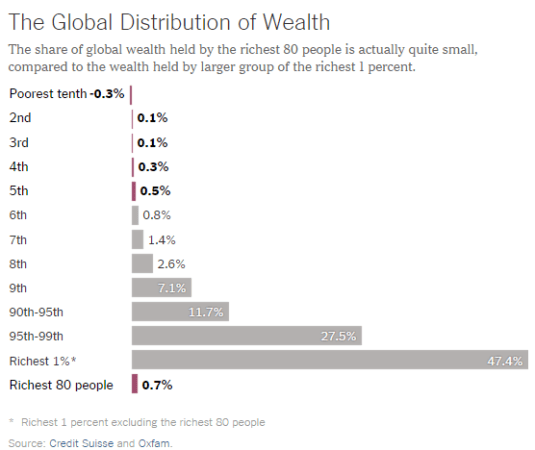
@Oxfam it is 0.7%, not 50% @OxfamNZ

Source: We Can’t Blame a Few Rich People for Global Poverty – The New York Times.

https://twitter.com/MaxCRoser/status/689227375582785536

https://twitter.com/MaxCRoser/status/689178825989685248

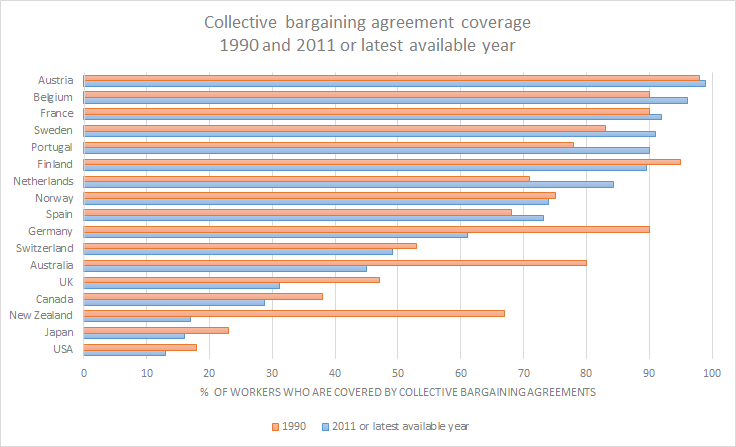
Collective bargaining coverage across the OECD, 1990 and 2011

Despite all the hullabaloo, collective bargaining agreement coverage is not declined by that much outside of the English-speaking countries. Outside of the USA, the top 1% are very lazy so they have not benefited from this decline of union power. Within the USA, so few people are covered by collective bargaining agreements for so long that it would not figure in the rising top incomes over the last 30 or more years.

image

Source: Economic Policy Reforms 2015: Going for Growth – © OECD 2015 and OECD Employment Outlook 2002.

As for New Zealand, the main difference between 70%  collective bargaining agreement coverage in 1990 and less than 20% collective bargaining coverage in 2011  is real wage growth returned to New Zealand in the early 1990s after 20 years of wage stagnation. The major economic event of the time was the passage of the Employment Contracts Act.

@garethmorgannz are the poor are just like everyone else except that they have less money?

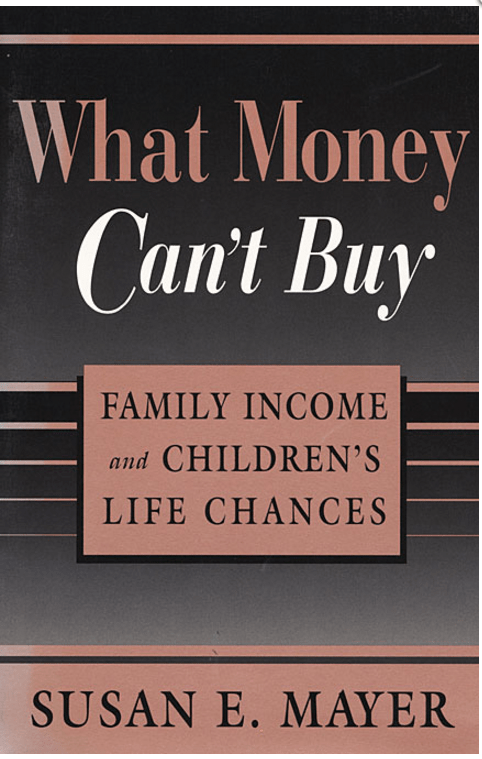
There is a large literature on what money can buy in terms of improved child outcomes. Central to the left-wing view is the poorer are just like everyone else but they have less money. Susan Mayer, a proud registered Democrat all her life, kick-started the literature challenging this with her book in 1997.

More money does help the children of poor families but the effect is considerably less–and more complicated–than is generally thought because as Mayer says ‘once children’s basic material needs are met, characteristics of their parents become more important to how they turn out than anything additional money can buy.

Doubling the income of poor families would lift most children above the poverty line, it would have virtually no effect on their test scores and only a slight effect on social behaviour. Among her findings, which have largely survive the test of time, are:

  1. Higher parental income has little impact on reading and mathematics test scores.
  2. Higher income increases the number of years that children attend school by only one-fifth of a year.
  3. Higher income does not reduce the amount of time sons are idle as young adults.
  4. Higher income reduces the probability of daughters growing up to be single mothers by 8 to 20 percent.

Mayer found that as parents have more money to spend, they usually spend the extra money on food, especially food eaten in restaurants; larger homes; and on more automobiles. As a result, children are likely to be better housed and better fed, but not necessarily better educated or better prepared for high-income jobs. Mayer said that her findings do not endorse massive cuts in welfare:

My results do not show that we can cut income support programs with impunity…Indeed, they suggest that income support programs have been relatively successful in maintaining the material living standard of many poor children.

Mayer found that non-monetary factors play a bigger role than previously thought in determining how children overcome disadvantage as she explains. Parent-child interactions appear to be important for children’s success, but the study shows little evidence that a parent’s income has a large influence on parenting practices.

Mayer said that if money alone were responsible for overcoming such problems as unwed pregnancy, low educational achievement and male idleness, states with higher welfare benefits could expect to see reductions in these problems. In reality

once we control all relevant state characteristics, the apparent effect of increasing Aid to Families with Dependent Children benefits is very small.

Social economics has been here before. In the 1960s, the Coleman Report rather than finding that investing in schools improved child outcomes found that most variation between child outcomes depended on family backgrounds. When we talking about schools not matter in too much we are talking about average bad schools and average good school not American inner-city schools into war zones.

Source: Savings, Genes, and Fade-Out, Bryan Caplan | EconLog | Library of Economics and Liberty.

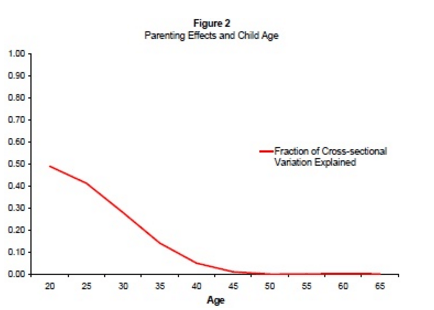
Behavioural genetics has been a bit of a blow to those that think greater parental investment can raise child outcomes as Bryan Caplan has explained:

Economists like Nobel laureate Gary Becker have been studying the family for decades.  Like most modern parents, economists usually take it for granted that “parental investment” has large, lasting effects on adult outcomes.

And yet adoption and twin researchers find surprisingly little evidence for this this assumption(link is external)!  With a few notable exceptions, the measured effect of upbringing on adult outcomes is small to zero.  Adoptees barely resemble their adopting families, identical twins are much more similar than fraternal twins, and identical twins raised apart are often as similar as identical twins raised together.  Almost all traits run in families, but the overarching reason is heredity.

Caplan notes that while it is extremely difficult for parental investments to change the adult outcomes of his children, it is well within his power to give his children a happy childhood.

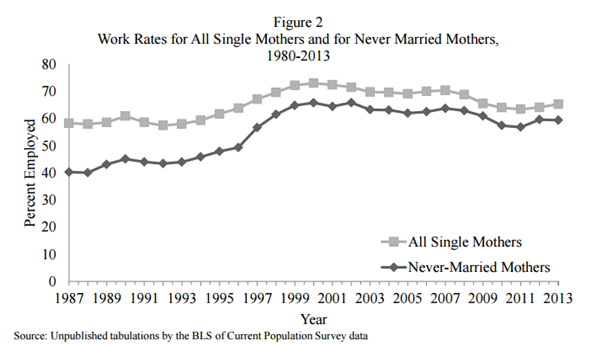
1996 US welfare reforms & single mother employment rates @garethmorgannz @geoffsimmonz

image

Source: Ron Haskins (2015).

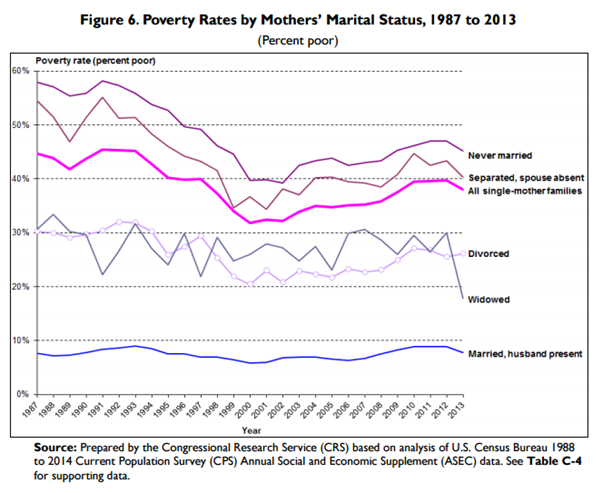
Poverty Rates by Mothers’ Marital Status, 1987 to 2013

image

Source: Congressional Research Service.https://www.fas.org/sgp/crs/misc/R41917.pdf

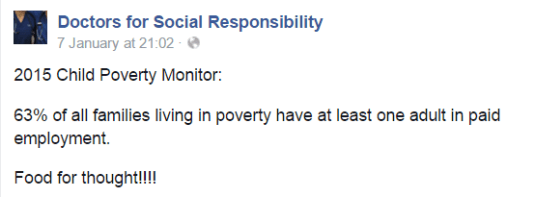
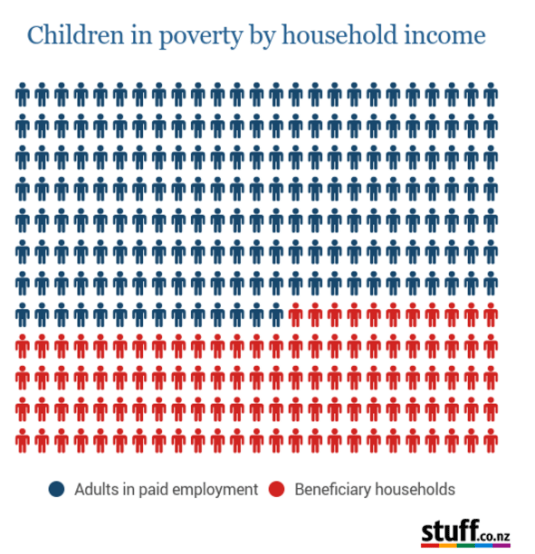
A curious @povertymonitor based child poverty infographic

Source: Child Poverty is everyone’s problem – Children’s Commissioner | Stuff.co.nz.

Source: Child Poverty Monitor: Technical Report.

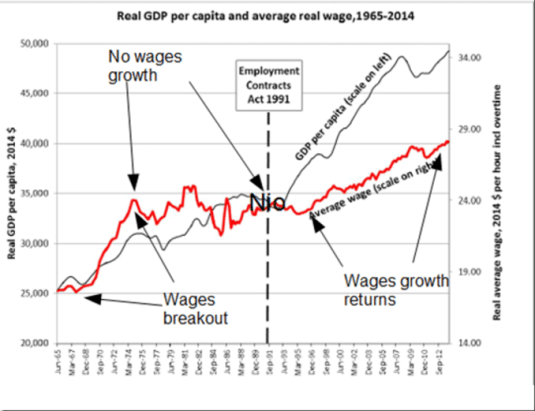
@povertymonitor confirms success of neoliberalism in restoring real wages growth

After two lost decades from 1974 where there was real wage stagnation and next to no real GDP growth, following the Mother of All Budgets in 1991 under Ruth Richardson and the passage of the Employment Contracts Act in the same year, real wages growth returned after a hiatus of 20 years. These 20 years of real wage stagnation were the good old days if the Leftover Left is to be believed.

Source: Child Poverty Monitor: 2015 Technical Report, figure 39.

Dave Armstrong food banks existed in NZ since the 19th century

Source: Donna Wynd, Hard to Swallow Foodbank Use in New Zealand (2005).

David Armstrong claimed incorrectly that there have been no food banks in New Zealand until recently:

That’s how it used to be here not so long ago, when foodbanks didn’t exist and the number of homeless was tiny. I remember when we had few cases of “poverty” diseases such as rheumatic fever or rickets.

What else explains the increased popularity of food banks, which have been long-standing in New Zealand, it is not falling wages.

The main economic development over the last 25 years is the return of real wage growth after decades of wage stagnation in the boys own good old days of David Armstrong.

Source: Low Wage Economy | New Zealand Council of Trade Unions – Te Kauae Kaimahi.

As for the number of homeless being tiny in the good old days of New Zealand, a New Zealand Parliamentary Library 2014 paper on homeless started its historical narrative in 1850 and spent a lot of time discussing housing deprivation in the early and mid-20th century:

A 1936 national survey found nearly a third of the total urban housing stock was unsatisfactory and 15% of this only fit for demolition. [5]   Māori in particular experienced poor housing conditions.  The first Labour Government loaned money for private house purchases and built state housing to rent.

During the 1950s, the National Government moved to reduce the waiting list for state housing and promoted home ownership, but lengthy waits for some people were reported. Likewise, concern was expressed over severe overcrowding, especially among Māori. By the late 1950s, Wellington’s housing needs were identified as ‘particularly acute.

In the 1960s voluntary organisations recorded a gradual increase in some groups experiencing housing difficulties. The Christchurch Methodist Church night shelter found that their main users were employed people who could not afford other accommodation, unmarried women with children, and those leaving homes because of domestic violence also increasingly sought shelter

Not even a self-described liberal elitist of the left can be forgiven for forgetting some of the key achievements of the first Labour government in social housing. The idea was to improve the quality of New Zealand housing for the poor.

Source: The first state house – State housing | NZHistory, New Zealand history online.

In common with Max Rashbrooke, David Armstrong’s recollection of his boys own childhood does not include Maori as they drifted to the city. Prior to the middle of the 20th century about 85% of Maori lived in rural areas, often lacking electricity, running water and living on dirt floors as the Encyclopaedia of New Zealand explains:

Attracted by work opportunities and the ‘bright lights’ of city life, rural Māori began to move to Auckland and Wellington in the 1920s. However, many faced problems finding accommodation. The reputation Māori had among Pākehā for overcrowding and taking poor care of their homes meant few landlords were prepared to have them as tenants. As attendee James Rukutoki told a Māori leaders conference in 1939, ‘the only dwellings open to the Maori are the ramshackle discards of the Pākehā’.


What does the poverty rate tell us? @keith_ng @EricCrampton @geoffsimmonz @apdrmabsc @bryce_edwards

Keith Ng stumbled onto an interesting point in a Twitter feud yesterday before he muted me about what is the poverty rate for. Are we interested in the poverty rate before government transfers and other social assistance or after them? Why?

If you are making the case for more assistance to the poor, the correct poverty rate measure is after the existing government assistance. Interestingly, most of those making the case for greater assistance to the poor use the before government transfer measures of poverty rates.

The reason why the correct measure is after government assistance is you are attempting to measure whether the assistance to date has provided people with an adequate standard of living. The before government assistance poverty rate provides no insight into that question.

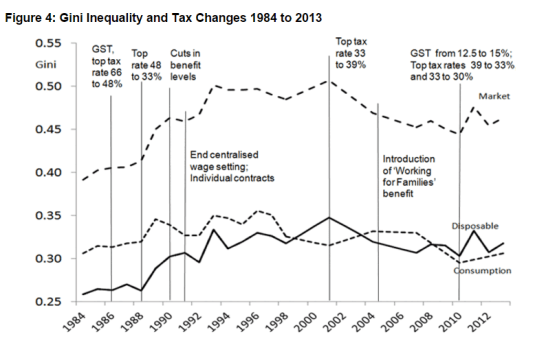
The recent calculation by the Treasury of inequality based on income and consumption illustrates this. Most people are concerned about what people have to spend rather than how much they earn when thinking about topping them up with government social assistance.

Source: Inequality in New Zealand 1983/84 to 2013/14 (WP 15/06) — The Treasury – New Zealand

As the above chart shows, consumption inequality in New Zealand has not changed much since 1984 while income inequality has. Which is more important how much people have to spend or how much they are? Growing inequality is not a reason for more government assistance to the poor in New Zealand because it simply has not got worse for 30 years.

The reason that the before government assistance poverty rate is used is this rate is a relative measure that does not fall by that much. It therefore helps dramatise the politics of poverty and perhaps strengthen your case in the eyes of low information voters.

The better guide is the poverty rate after government assistance because that tells you how much extra you really need to top up the incomes of the poor to ensure they have an adequate minimum standard of living. The before government assistance poverty rate provides no insight into the success of social insurance and the welfare state regarding the adequacy of income support for the poor.

The poverty rate is not a reliable policy statistic @HelenKellyUnion @apdrmabsc @keith_ng

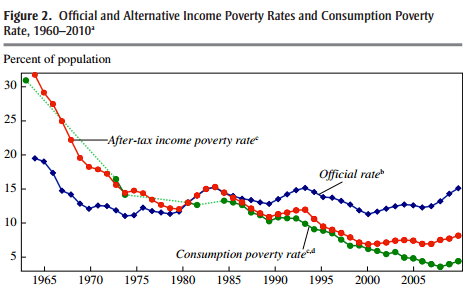
The official poverty rate in the USA missed poverty falling to near zero by the eve of the Global Financial Crisis in 2007 as shown in the chart below. That is no small oversight. It calls into question whether the official poverty rate which is based on a percentage of the median income is a useful guide to the magnitude of social problems before us.

Source: Meyer and Sullivan (2012), p. 153.

Meyer and Sullivan calculated a consumption based measure of poverty and found that the poverty rate fell much faster than previously single digits.

People worry about poor not have enough, not how much income they have before taxes and social insurance. The official poverty rate is before tax and social insurance and therefore before how much the poor actually have to get by with after receiving social assistance of all types and sources.

Interestingly, the divergence between consumption-based poverty and income-based poverty started with the election of Reagan and picked up the US federal welfare reforms in 1996. The number of children in poverty in deep poverty fell immediately after those 1996 US welfare reforms. There is a lesson in that for New Zealand.

It is widely agreed that the official poverty rate is flawed. Measuring poverty as a percentage of median income, usually 60% of the median income, means that poverty may not fall despite incomes doubling every generation and more.

Indeed, increases in the median income can increase poverty without anyone being poorer. This is because the gap between the median income earners and the poor increased such as the New Zealand in 2014 without any of the poor experiencing a fall in income and social support.

The reason why the median is pulling away from the bottom – the reason why income distribution is fanning out – is more people going to university and securing the associated wage premium and the greater rewards for talent in a globalised world.

The forces behind greater educational attainment and the globalisation of markets benefit all and in particular those of bottom of the income distribution through a more prosperous, dynamic, innovative society.

Previous Older Entries Next Newer Entries

David Andolfatto

Celebrating humanity's flourishing through the spread of capitalism and the rule of law

Monetary Non-Neutrality

Celebrating humanity's flourishing through the spread of capitalism and the rule of law

Reason Magazine

Celebrating humanity's flourishing through the spread of capitalism and the rule of law

Coyote Blog

Celebrating humanity's flourishing through the spread of capitalism and the rule of law

Thoughts from the North

Celebrating humanity's flourishing through the spread of capitalism and the rule of law

Fardels Bear

A History of the Alt-Right

Vincent Geloso

Econ Prof at George Mason University, Economic Historian, Québécois

Bassett, Brash & Hide

Celebrating humanity's flourishing through the spread of capitalism and the rule of law

Truth on the Market

Scholarly commentary on law, economics, and more

The Undercover Historian

Beatrice Cherrier's blog

Matua Kahurangi

Celebrating humanity's flourishing through the spread of capitalism and the rule of law

Temple of Sociology

Celebrating humanity's flourishing through the spread of capitalism and the rule of law

Velvet Glove, Iron Fist

Celebrating humanity's flourishing through the spread of capitalism and the rule of law

Why Evolution Is True

Why Evolution is True is a blog written by Jerry Coyne, centered on evolution and biology but also dealing with diverse topics like politics, culture, and cats.

NoTricksZone

Celebrating humanity's flourishing through the spread of capitalism and the rule of law

Homepaddock

A rural perspective with a blue tint by Ele Ludemann

Kiwiblog

DPF's Kiwiblog - Fomenting Happy Mischief since 2003

The Dangerous Economist

Celebrating humanity's flourishing through the spread of capitalism and the rule of law

Watts Up With That?

The world's most viewed site on global warming and climate change

The Logical Place

Tim Harding's writings on rationality, informal logic and skepticism

Doc's Books

A window into Doc Freiberger's library

The Risk-Monger

Let's examine hard decisions!

Uneasy Money

Commentary on monetary policy in the spirit of R. G. Hawtrey

Barrie Saunders

Thoughts on public policy and the media

Liberty Scott

Celebrating humanity's flourishing through the spread of capitalism and the rule of law

Point of Order

Politics and the economy

James Bowden's Blog

A blog (primarily) on Canadian and Commonwealth political history and institutions

Science Matters

Reading between the lines, and underneath the hype.

Peter Winsley

Economics, and such stuff as dreams are made on

A Venerable Puzzle

"The British constitution has always been puzzling, and always will be." --Queen Elizabeth II

The Antiplanner

Celebrating humanity's flourishing through the spread of capitalism and the rule of law

Bet On It

Celebrating humanity's flourishing through the spread of capitalism and the rule of law

History of Sorts

WORLD WAR II, MUSIC, HISTORY, HOLOCAUST

Roger Pielke Jr.

Undisciplined scholar, recovering academic

Offsetting Behaviour

Celebrating humanity's flourishing through the spread of capitalism and the rule of law

JONATHAN TURLEY

Res ipsa loquitur - The thing itself speaks

Conversable Economist

In Hume’s spirit, I will attempt to serve as an ambassador from my world of economics, and help in “finding topics of conversation fit for the entertainment of rational creatures.”

The Victorian Commons

Researching the House of Commons, 1832-1868

The History of Parliament

Articles and research from the History of Parliament Trust

Books & Boots

Reflections on books and art

Legal History Miscellany

Posts on the History of Law, Crime, and Justice

Sex, Drugs and Economics

Celebrating humanity's flourishing through the spread of capitalism and the rule of law

European Royal History

Exploring the Monarchs of Europe

Tallbloke's Talkshop

Cutting edge science you can dice with

Marginal REVOLUTION

Small Steps Toward A Much Better World

NOT A LOT OF PEOPLE KNOW THAT

“We do not believe any group of men adequate enough or wise enough to operate without scrutiny or without criticism. We know that the only way to avoid error is to detect it, that the only way to detect it is to be free to inquire. We know that in secrecy error undetected will flourish and subvert”. - J Robert Oppenheimer.