
Source: Environmental and Urban Economics: Climate Change and Economic Growth.
Celebrating humanity's flourishing through the spread of capitalism and the rule of law
03 Dec 2015 Leave a comment
in applied price theory, economic growth, entrepreneurship, environmental economics, global warming, macroeconomics, Robert E. Lucas Tags: climate alarmists, endogenous growth theory, entrepreneurial alertness, exogenous growth theory, global warming, Matthew Kahn, neoclassical growth theory, offsetting, Robert Solow, unbalanced growth, unintended consequences
02 Dec 2015 Leave a comment
in applied price theory, budget deficits, business cycles, economic growth, economic history, economics of regulation, Euro crisis, fiscal policy, global financial crisis (GFC), great depression, great recession, macroeconomics, monetary economics Tags: adverse selection, bank panics, bank runs, banking crises, deposit insurance, economics central banks, financial crises, moral hazard, sovereign defaults
02 Dec 2015 Leave a comment
in applied price theory, applied welfare economics, comparative institutional analysis, economic growth, economic history, entrepreneurship, industrial organisation, macroeconomics Tags: creative destruction, endogenous growth theory, entrepreneurial alertness, innovation, international technology diffusion
Michael Reddell was right to run his sceptical eye over the enthusiasm of the New Zealand government for promoting local R&D. Politicians are obsessed with boffins in lab coats who invent thing rather than the entrepreneurs who risk import technologies and adapt them to local markets.
New Zealand is a technology follow-up. 99% of global R&D is undertaken abroad. The key innovation policy question for New Zealand is how to adopt those technologies rather than how to invent them.
https://img.quozio.com/img/a6dd47b6/1025/The-fraction-of-US.jpg
Appropriate institutions and distance for the global technological frontier
As technology followers such as New Zealand approach the global technological frontier, the institutions appropriate for continued productivity growth change.
As a country moves closer to the global technological frontier, the impact of each successive technology import will decline. The latest imported technology is usually a smaller and smaller upgrade on before. A more skilled workforce and greater entrepreneurship is needed to squeeze out all of the available productivity and product quality gains from the latest imported technologies.
The institutions appropriate to further growth are context-dependent
The political, tax and regulatory institutions that favour the more ready-made implementation of more standardised imported technologies do not necessarily favour the growing demand for the domestic innovations in New Zealand as the global technological frontier nears. There is a growing demand for more highly skilled workers to master and adapt the leading-edge technologies to the distinctive circumstances of each New Zealand workplace to stay ahead in rapidly changing competitive environments and meet the changing needs of customers.
Productivity growth is not manna from heaven. Every increase in productivity and in product quality and variety are the sum of many inventions that must be first discovered by prospective innovators building on past ideas and developed, tested, adopted and adapted by profit-minded entrepreneurs and workers. Investments in R&D, in human capital and in on-the job learning and in the entrepreneurial judgments about risking investments in the new technologies that all underpin further growth in productivity are all influenced by public policies.
Moving from implementation-based to innovation-based policy regimes
As a country approaches the global technology frontier, continued technological imitation is no longer enough to keep productivity growing at the trend rate of two per cent per year. There must be an institutional switch from a technology implementation-based policy regime to an innovation-based policy regime.
The end by 1990 of the EU’s productivity convergence on the USA has been partly attributed to not making the policy shift from technology implementation enhancing institutions to innovation enhancing institutions. EU members invested far less than the USA in R&D and tertiary education had more rigid labour and product markets, had less entry and exit of firms, and much higher taxes.
Institutions must adapt to distance from the technological frontier
As a country approaches the global technology frontier, there must be younger firms, fewer incumbents, better educated workers, more R&D, more entry and exit, more flexible product and labour markets and lower taxes. These dynamic entrepreneurial features were not common-place in pre-1984 New Zealand.
New Zealand too had to switch to institutions that enhanced innovation and entrepreneurial entry just to return to growing at the global trend rate of 2 per cent per year. The political, tax and regulatory institutions appropriate prior to 1973 when New Zealand was a colonial farm for the UK are different to the institutions that are growth-enhancing in a less sheltered economic environment. There is no reason to suppose that the rising burden of knowledge and product proliferation has in any way ebbed to lighten the pressure for continued reform.
The institutional foundations of prosperity and stagnation
Questions about greater prosperity of New Zealand must be correctly posed and should focus on the fundamental causes of productivity growth rather than the proximate causes. The proximate causes of productivity and prosperity are the accumulation of more human and physical capital and technological progress.
Institutions are the fundamental cause of prosperity and cross-country differences in per capita incomes. Institutions determine the incentives and constraints on working, learning and investing, and influence, in a profound way, investments in physical and human capital and R&D and the importing of new technologies. It is premature to conclude that the national institutions and policies of OECD member countries are fairly similar and that the institutional differences that they do have are minor in their impact on respective national productivity and income levels.
There have been periods of prosperity, divergence, depression, recovery, catch-up and no catch-up at difference times in OECD member countries and usually for country-specific reasons. These large changes in fortune are not by chance. The differences in policy that gave rise to these divergences in income levels and extended periods of prosperity and stagnation should be open to analysis so that policy improvements can be discovered for possible application in New Zealand.
The Productivity Hub is a partnership of agencies which aims to improve how policy can contribute to the productivity performance of the New Zealand economy and the wellbeing of New Zealanders. The Hub Board is made up of representatives from the Productivity Commission, the Ministry of Business, Innovation and Employment, Statistics New Zealand and the Treasury
The Productivity Hub yesterday hosted a symposium in Wellington with the title “Growing more innovative and productive Kiwi firms”. “Growing” things is usually something gardeners do – people doing stuff to things. So the title perhaps carried somewhat unfortunate connotations of successful firms being the products of government action. That probably wasn’t their intention, at least not wholly, but then again it wasn’t entirely out of line with the list of attendees – 161 names, of whom at least 150 would have been bureaucrats, academics, and the like. There appeared to be only a very…
View original post 2,243 more words
01 Dec 2015 Leave a comment
in economic growth, economic history, macroeconomics, politics - Australia, politics - New Zealand
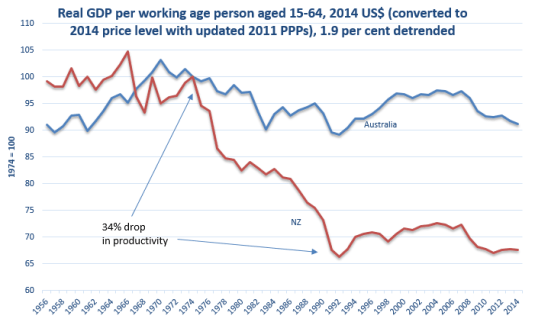
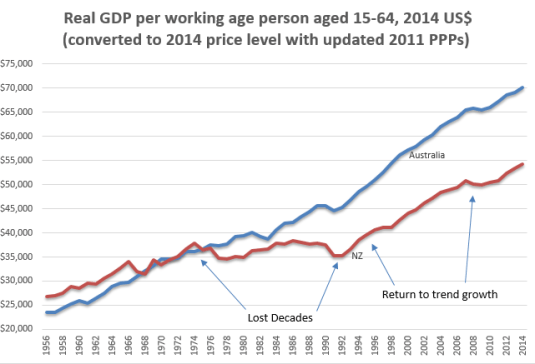
I have updated my estimates of Australian and New Zealand detrended real GDP growth for the 2014 working age population statistics from the OECD. The charts show:
Source: Computed from OECD Stat Extract and The Conference Board. 2015. The Conference Board Total Economy Database™, May 2015, http://www.conference-board.org/data/economydatabase/
The real GDP data in the above chart is detrended by 1.9% per annum. 1.9% growth per year is the trend real GDP growth rate of the USA in the 20th century. The growth rate of the USA is taken as the growth rate of the global technological frontier. A flat line in the above chart is real GDP growth at 1.9% per year. A falling line is real GDP growth in that year of less than 1.9%; a rising line is growth that is greater than 1.9% in that year.
Source: Computed from OECD Stat Extract and The Conference Board. 2015. The Conference Board Total Economy Database™, May 2015, http://www.conference-board.org/data/economydatabase/
27 Nov 2015 Leave a comment
in applied price theory, applied welfare economics, economic growth, labour economics, politics - USA, poverty and inequality, welfare reform Tags: 2016 presidential election, Leftover Left, Twitter left
21 Nov 2015 2 Comments
in currency unions, economic growth, economic history, Euro crisis, fiscal policy, macroeconomics, politics - USA Tags: British disease, British economy, Eurosclerosis, France, sick man of Europe, Sweden, Swedosclerosis, Twitter left
The Washington Centre for Equitable Growth have joined the Wall Street Journal in falling for that dodgy OECD hypothesis about rising inequality holding back economic growth.
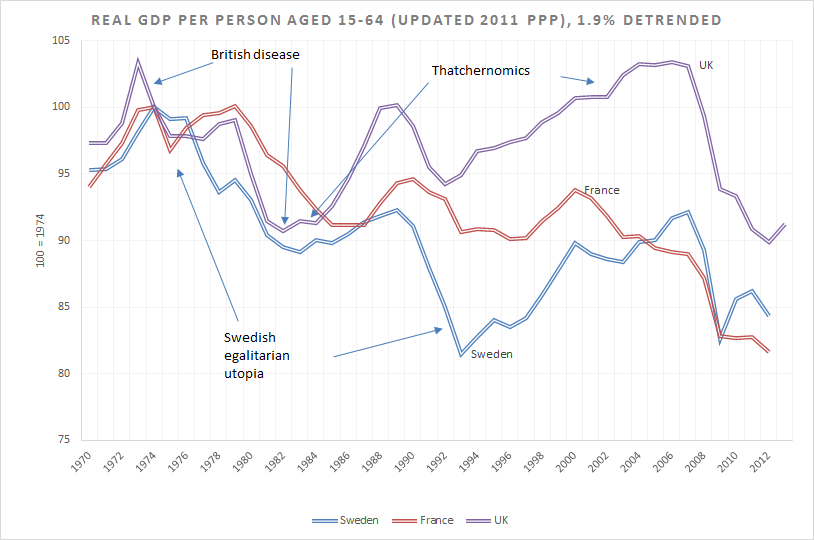
The chart below shows stark differences between egalitarian Sweden and France, and the more unequal UK since 1970 in departures from a trend growth rate of 1.9% in real GDP per working age person, PPP.
Source: Computed from OECD Stat Extract and The Conference Board. 2015. The Conference Board Total Economy Database™, May 2015, http://www.conference-board.org/data/economydatabase/
In the above chart, a flat line is growth at the same rate as the USA for the 20th century, which was 1.9% for GDP per working age person on a purchasing power parity basis. The USA’s growth rate is taken as the trend rate of growth of the global technological frontier. A falling line in the above chart is growth in real GDP per working age person, PPP, at below this trend rate of 1.9%; a rising line is above trend rate growth for that year.
Britain did very well, both under the neoliberal horrors of Thatcherism and the betrayals by Tony Blair of a true Labour Party platform. The UK grew at above the trend annual growth to 1.9% for most of the period from the early 1980s to 2007.
Neither France or Sweden, despite their egalitarian economies, kept up with the US growth rate since 1970. Under the OECD’s hypothesis, if France and Sweden had been more unequal, their trend growth rates would have been even more appalling since 1970.
17 Nov 2015 Leave a comment
in economic growth, economic history, global financial crisis (GFC), labour economics, macroeconomics Tags: British economy, British history
15 Nov 2015 1 Comment
in applied welfare economics, economic growth, economic history, economics of regulation, fiscal policy, labour economics, politics - New Zealand Tags: Australia, John Quiggin, lost decades
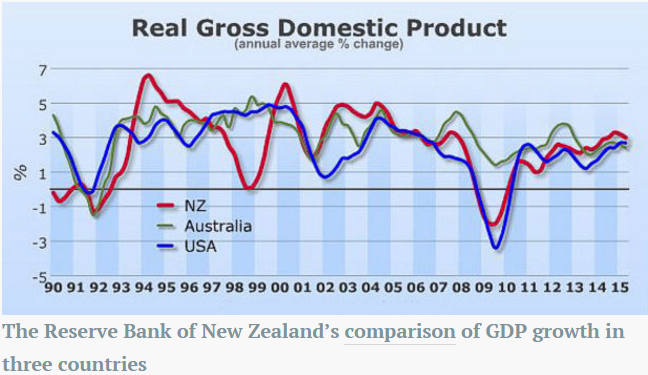
Leading Australian academic economist John Quiggin has just published an article arguing that New Zealand should not be a policy role model for anything. To quote Quiggin:
For most of the twentieth century, the New Zealand and Australian economies performed almost identically. New Zealand took a somewhat larger hit when Britain entered the European Common Market in the 1970s, but that impact has long since washed out. The real divergence came in the 1980s. Since then, New Zealand’s income per person has fallen 35 per cent behind Australia’s
He used Reserve Bank of New Zealand data going back to 1990, which is common starting point for most Reserve Bank data.
Source: John Quiggin “How New Zealand fell further behind”. Inside Story, 11 November 2015.
If he had taken that chart back to the 1970s and earlier using the Conference Board Total Database, Quiggin would have found that New Zealand economy diverged from Australia in the 1970s, not in the 1980s. His data from the Reserve Bank of New Zealand started at the low point in 1990 – at the end of that divergence that started in 1974. The New Zealand economy was depressed between 1974 and 1992. I label this Great Depression in New Zealand as New Zealand’s Lost Decades.
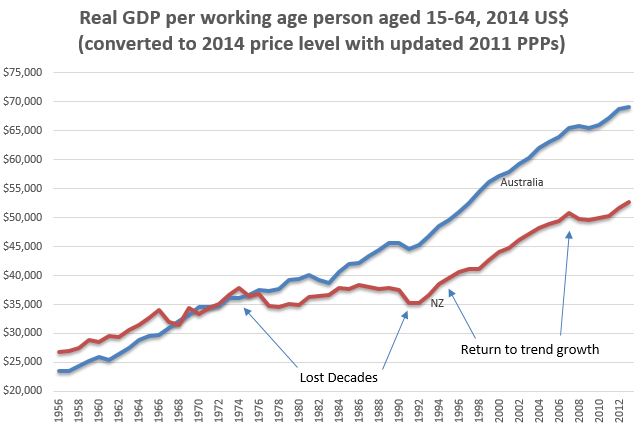
Source: Computed from OECD Stat Extract and The Conference Board. 2015. The Conference Board Total Economy Database™, May 2015, http://www.conference-board.org/data/economydatabase/
Real GDP PPP per working age New Zealander fell rapidly after 1974 (a 34% drop against trend) when that economy was a heavily regulated, highly taxed economy. This heavily regulated, highly taxed, economically stagnant New Zealand is the good old days in the eyes of the Twitter Left.
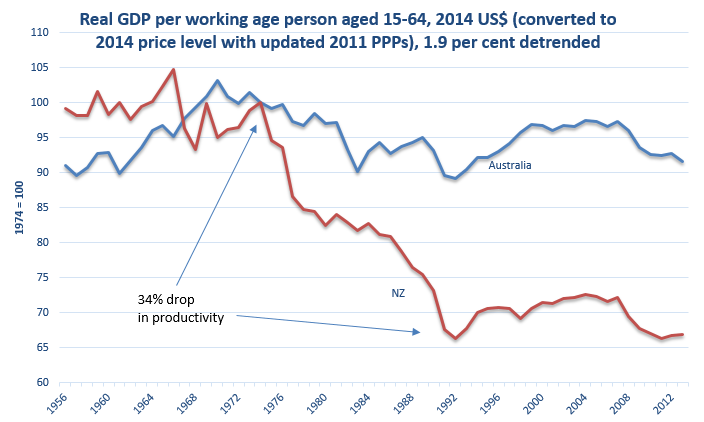
Source: Computed from OECD Stat Extract and The Conference Board. 2015. The Conference Board Total Economy Database™, May 2015, http://www.conference-board.org/data/economydatabase/
In the chart above, the base is 1974 which equals 100. A flat-line means annual growth equal to the trend rate of growth in the 20th century for the USA. A falling line means below trend growth; a rising line means above trend rate economic growth per working age Australian or New Zealander.
With the election of a National Party government in 1990 and a massive fiscal consolidation, New Zealand growth rate returned to the previous trend rate of 1.9% in 1992. Ruth Richardson’s horror budget of 1991 was so bad that the what became the Twitter Left called it the “Mother of All Budgets“.
What followed this massive fiscal consolidation where welfare benefits for cut severely was an economic boom that lasted until the GFC.
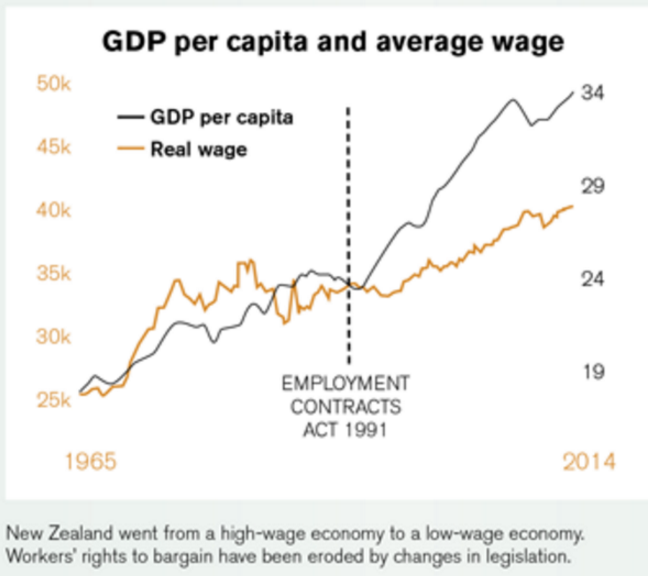
Source: Income Gap | New Zealand Council of Trade Unions – Te Kauae Kaimahi.
As shown in the chart conveniently compiled by the New Zealand Council of Trade Union, there was 20 years of real wage stagnation until the passage of the Employment Contracts Act in 1991.
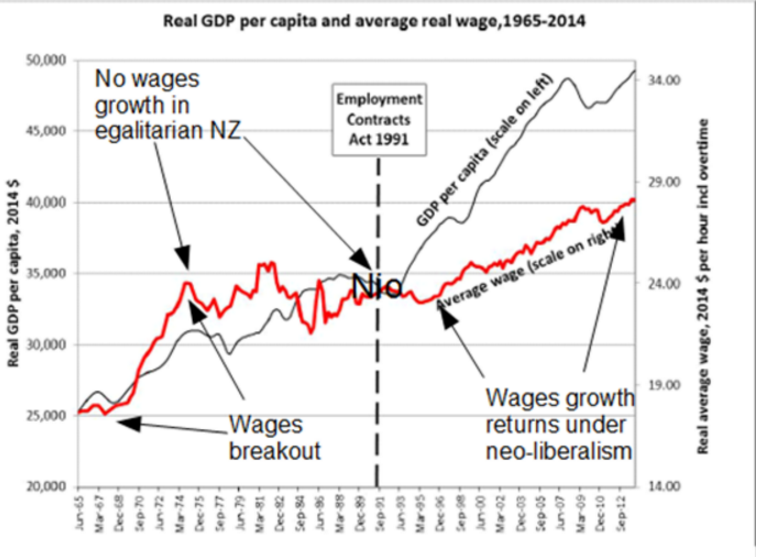
Source: Income Gap | New Zealand Council of Trade Unions – Te Kauae Kaimahi with annotations.
What followed the passage of that Act was sustained real wages growth for the first time in two decades and the end of growing inequality under the previously highly taxed, heavy regulated economy that was good old days New Zealand if the Twitter Left is to be believed.
To do this, to paint pre-1984 New Zealand, pre-neoliberal New Zealand as a fairly egalitarian paradise, Max Rashbrooke is an example of that is had to ignore two thirds of the population and the inequalities they suffered:
“New Zealand up until the 1980s was fairly egalitarian, apart from Maori and women, our increasing income gap started in the late 1980s and early 1990s,” says Rashbrooke. “These young club members are the first generation to grow up in a New Zealand really starkly divided by income.”
Racism and patriarchy can sit comfortably with a fairly egalitarian society if you are to believe the vision of the Twitter Left as to their good old days. John Quiggin refers to the period in Australia known as the Menzies Era as part of his golden age of the mixed economy. The Menzies Era was most of the 23 years of uninterrupted conservative party rule between 1949 and 1972. The actual Menzies Era was the period up to 1966 when Liberal Party Prime Minister Sir Robert Menzies retired
The reforms of the 1980s known as Rogernomics stopped the long-term stagnation in real wages that started in about 1974. The reforms of the early 1990s under a National Party government including a massive fiscal consolidation and the passing of the Employment Contracts Act was followed by the resumption of sustained growth in real wages with little interruption since.
New work by Chris Ball and John Creedy shows substantial *declines* in NZ inequality.
initiativeblog.com/2015/06/24/ine… http://t.co/f94fw4Bhae—
Eric Crampton (@EricCrampton) June 24, 2015
This boom after two decades of minimal real economic growth per working age New Zealander benefited everyone. The unemployment rate fell to a record low of 3.5% about 2005. Maori unemployment was at a 20-year low of 8% in 2008. Maori labour force participation rates increased from 45% in the late 1980s to about 62% by the eve of the Global Financial Crisis.
The increase in percentage terms of Maori and Pasifika real household income is much larger than for Pakeha since the economic reforms of the 1980s and 1990s. As Bryan Perry (2015, p. 67) explains when commenting on table D6 sourced by Closer Together Whakatata Mai:
From a longer-term perspective, all groups showed a strong rise from the low point in the mid 1990s through to 2010. In real terms, overall median household income rose 47% from 1994 to 2010: for Maori, the rise was even stronger at 68%, and for Pacific, 77%. These findings for longer- term trends are robust, even though some year on year changes may be less certain. For 2004 to 2010, the respective growth figures were 21%, 31% and 14%.
06 Nov 2015 Leave a comment
in economic growth, economic history, fiscal policy, George Stigler, Marxist economics, Public Choice, public economics Tags: conspiracy theories, growth of government, Leftover Left, median voter theorem, neoliberalism, rational ignorance, Sam Peltzman, size of government
I learnt a new word today off the back of Jane Kelsey winning a $600,000 Marsden grant to study embedded neoliberalism and her latest transnational conspiracy theory about trade agreements.
I’ve never heard of embedded liberalism before today despite a keen interest in popular and academic news. I don’t think I’m poorer for that ignorance but let’s push on. According to that source of all knowledge and truth Wikipedia, embedded neoliberalism’s been around for about 35 years:
Embedded liberalism is a term for the global economic system and the associated international political orientation as it existed from the end of World War II to the 1970s. The system was set up to support a combination of free trade with the freedom for states to enhance their provision of welfare and to regulate their economies to reduce unemployment. The term was first used by the American political scientist John Ruggie in 1982.[1]
Mainstream scholars generally describe embedded liberalism as involving a compromise between two desirable but partially conflicting objectives. The first objective was to revive free trade. BeforeWorld War I, international trade formed a large portion of global GDP, but the classical liberal order which supported it had been damaged by war and by the Great Depression of the 1930s. The second objective was to allow national governments the freedom to provide generous welfare programmes and to intervene in their economies to maintain full employment.[2] This second objective was considered to be incompatible with a full return to the free market system as it had existed in the late 19th century—mainly because with a free market in international capital, investors could easily withdraw money from nations that tried to implement interventionist and redistributive policies.[3]
The resulting compromise was embodied in the Bretton Woods system, which was launched at the end of World War II. The system was liberal[4] in that it aimed to set up an open system of international trade in goods and services, facilitated by semi fixed exchange rates. Yet it also aimed to “embed” market forces into a framework where they could be regulated by national governments, with states able to control international capital flows by means of capital controls. New global multilateral institutions were created to support the new framework, such as the World Bank and theInternational Monetary Fund.
Source: Embedded liberalism – Wikipedia, the free encyclopedia.
Decoding Marxist rhetoric is never easy, but I think what these academic Marxists are trying to do is describe the rise of the mixed economy and the welfare state over the course of the early and middle parts of 20th century.

The welfare state was never an easy thing for your card-carrying Marxist looking forward to the immiserisation of the proletariat as the trigger for the proletarian revolution.
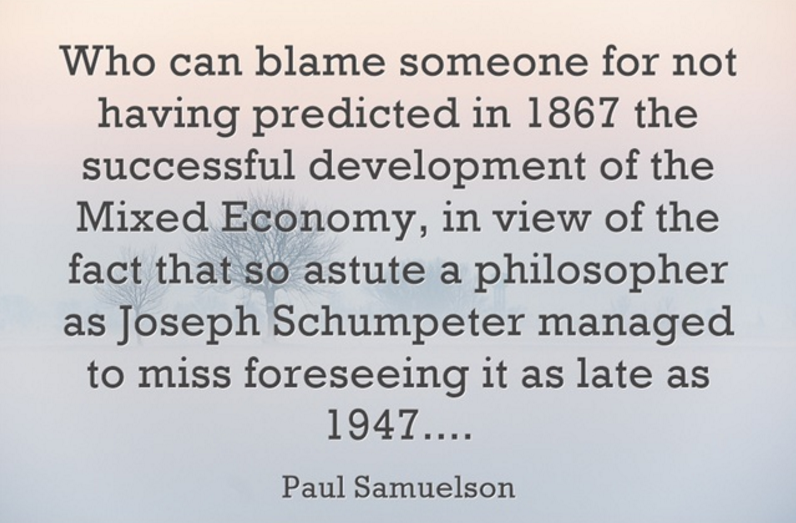
Embedded neoliberalism mostly all about what Aaron Director in the 1950s explained as the reasons for the growth of government in the 20th century. He put forward what George Stigler label for him Director’s Law of Public Expenditure. George Stigler published an article on this law because Aaron Director published next to nothing for reasons no one understands. Director founded law and economics through teaching law classes at the University of Chicago law school.
Long live the Slopegraph. Long live Edward Tufte. tinyurl.com/naeh7rc http://t.co/C8Lgnupxz9—
Amity Shlaes (@AmityShlaes) May 16, 2015
Sam Peltzman pointed out that most of modern public spending is supported by the median voter – the ‘swinging’ voter. He observed that governments at the start of the 20th century were a post office and a military; at the end of the 20th century, governments are a post office, a larger military and a very large welfare state.
Studies starting from Peltzman in 1980 showed that governments grew in line with the growth in the size and homogeneity of the middle class that was organised and politically articulate enough to implement a version of Director’s Law.
Director’s Law of public expenditure is that public expenditure is used primary for the benefit of the middle class, and is financed with taxes which are borne in considerable part by the poor and the rich. Based on the size of its population and its aggregate wealth, the middle class will always be the dominant voting bloc in a modern democracy. Growth in the size of governments across the developed world took off in the mid-20th century as the middle class blossomed. Peltzman maintained that:
“The levelling of income differences across a large part of the population … has in fact been a major source of the growth of government in the developed world over the last fifty years” because the levelling created “a broadening of the political base that stood to gain from redistribution generally and thus provided a fertile source of political support for expansion of specific programs. At the same time, these groups became more able to perceive and articulate that interest … [and] this simultaneous growth of ‘ability’ served to catalyse politically the spreading economic interest in redistribution.”
After the 1970s economic stagnation, the taxed, regulated and subsidised groups had an increasing incentive to converge on new, lower cost modes of income redistribution.
Sweden, Norway and Denmark could be examples of Gary Becker’s idea that political systems converge on the more efficient modes of both regulation and income redistribution as their deadweight losses grew in the 1970s and 1980s and after. Unlike some of their brethren abroad, more of the Nordic Left and, more importantly, the Nordic median voter were cognizant of the power of incentives and to not killing the goose that laid the golden egg. Taxes on income from capital are low in Scandinavia.
The rising deadweight losses of taxes, transfers and regulation all limit the political value of inefficient redistributive policies. Tax and regulatory policies that are found to significantly cut the total wealth available for redistribution by governments are avoided relative to the germane counter-factual, which are other even costlier modes of redistribution.
An improvement in the efficiency of either taxes or spending reduces political pressure from taxed and regulated groups for suppressing the growth of government and thereby increases total tax revenue and spending because there is less political opposition. Efficient taxes lead to higher taxes.
Improvements in the efficiency of taxes, regulation and in spending reduce political pressure from the taxed and regulated groups in society. This suppressed the growth of government and thus increased or prevented cuts to both total tax revenue and spending since 1980. Economic regulation lessened after 1980 and there were privatisations, but social and environmental regulation grew unabated. Certainly in New Zealand the post-1984 economic reforms followed a good 10 years of economic stagnation and regular economic crises:
In the early 1980s, New Zealand’s economy was in trouble. The country had lost its guaranteed export market when Britain joined the European Economic Union in 1973. The oil crisis that year had also taken a toll.
The post-1980 reforms of Thatcher, Reagan, Clinton, Hawke and Keating, Lange and Douglas and others saved the modern welfare state for the middle class. Most income transfer programmes in modern welfare states disproportionately benefit older people. With an aging society, that trend can only continue. That is why these reforming policies survived political competition, election after election. The political parties on the left and right that delivered efficient increments and streamlined the size of government were elected, and in turn, got thrown out from time to time because they became tired and flabby.

The rest of embedded neoliberalism is trying to explain widespread economic deregulation and liberalisation of international trade along with the continual growth of social regulation. This is something that Gary Becker, George Stigler and Sam Peltzman have written on previously.
The continued growth of social regulation is best explained by the median voter theorem. Both Bryan Caplan and Sam Peltzman pointed out that it’s hard to think of any major government program or regulation that does not enjoy widespread popular support.
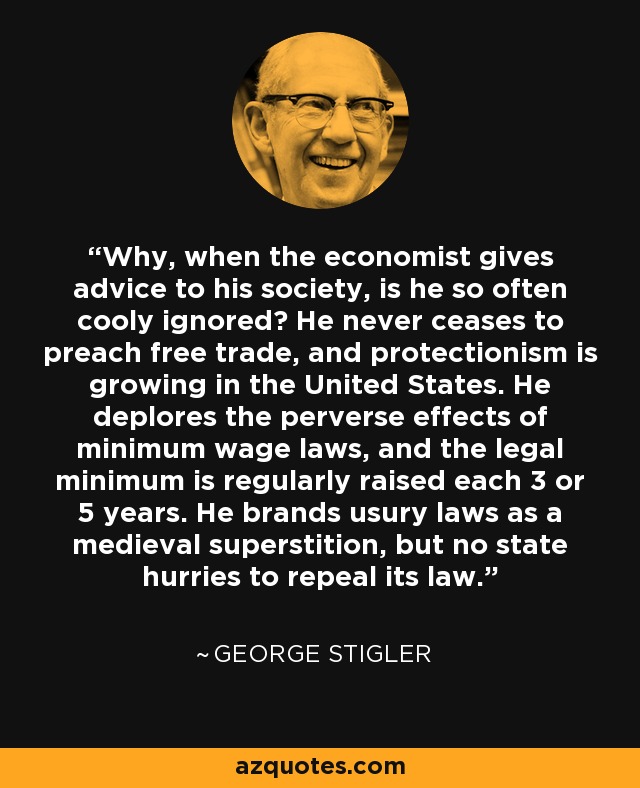
As for the public been duped by neoliberal economists, George Stigler argued that ideas about economic reform need to wait for a market. As Stigler noted, when their day comes, economists seem to be the leaders of public opinion but when the views of economists are not so congenial to the current requirements of special interest groups and voting public, these economists are left to be the writers of letters to the editor in provincial newspapers. These days they would run an angry blog.
03 Nov 2015 Leave a comment
in economic growth, economic history, poverty and inequality
When I pointed out yesterday that the only periods of sustained real household income growth in recent British history was under those neoliberal lapdogs Thatcher and Blair, the Twitter Left on Reddit decided rather prematurely I might say that:
The prime minister rarely influences broad economic realities — like commodity prices or interest rates, or double digit economic growth in china. Elections frequently change the party in power AFTER the economy turns downwards. As though that party had anything to do with the down turn.
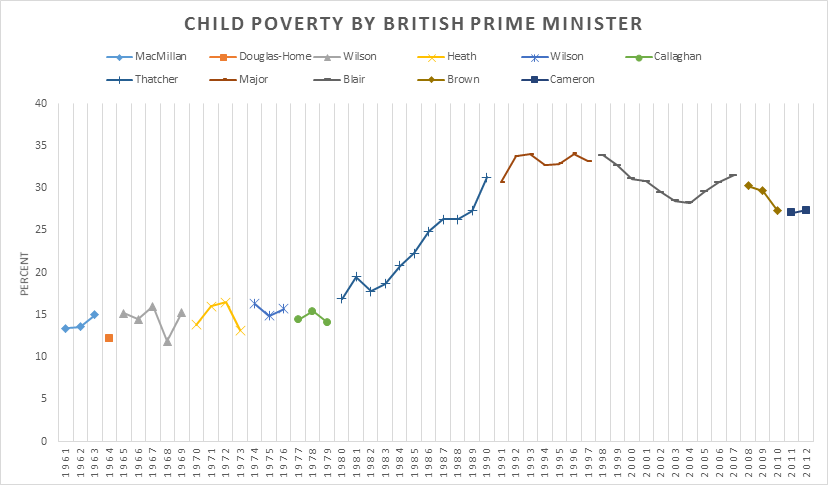
I’m sure that the morally centred Twitter Left will be equally forgiving of the sustained rise in child poverty due to many more workless households shown in the chart below under Thatchernomics. The only sustained fall in child poverty rates in recent British history was under Tony Blair. The British Left and current British Labour Party leadership dismiss him as a continuation of Thatchernomics.
Source: Incomes in the UK – Institute For Fiscal Studies – IFS.
03 Nov 2015 Leave a comment
in applied welfare economics, economic growth, economic history, macroeconomics, poverty and inequality Tags: British economy, British politics, Margaret Thatcher, Tony Blair
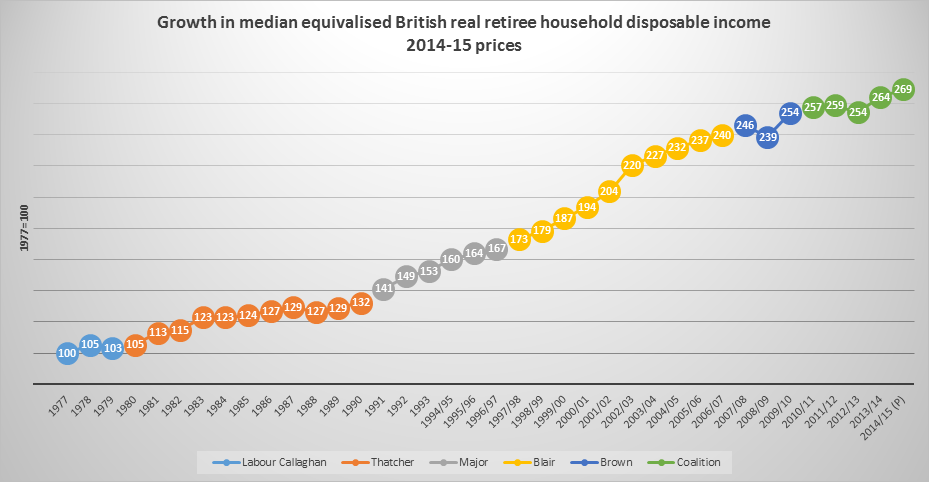
The British disease and the horrors of Thatchernomics past British retirees by as did pretty much the Global Financial Crisis. Slow and steady as she goes under every Prime Minister since 1977 has been year in year out result for the real disposable median incomes of British retired households. Despite it all, British retiree household incomes increased by 170% since the winter of discontent. The fastest growth in retiree incomes was under Tony Blair.
Source: Release Edition Reference Tables – ONS.
Notes:
1 Households are ranked by their equivalised disposable incomes, using the modified-OECD scale.
2 1994/95 represents the financial year ending 1995, and similarly through to 2014/15, which represents the financial year ending 2015.
3 Income figures have been deflated to 2014/15 prices using an implied deflator for the household sector.
It has been a much rockier ride for British households yet to retire. Once again, the only time a sustained real income increases for non-retired households was under Thatcher and Blair. Despite it all, household real incomes have doubled since the winter of discontent. The majority of that doubling was under the dead hand of Tony Blair. British Labour now spends a considerable amount of time repudiating that time of unusually rapid household income growth across all of British society.
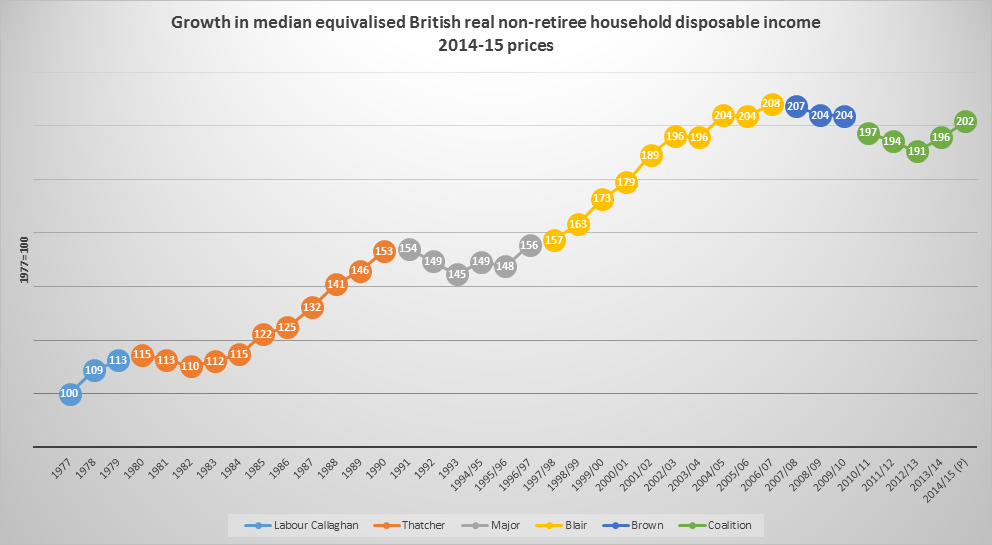
Source: Release Edition Reference Tables – ONS.
Notes:
1 Households are ranked by their equivalised disposable incomes, using the modified-OECD scale.
2 1994/95 represents the financial year ending 1995, and similarly through to 2014/15, which represents the financial year ending 2015.
3 Income figures have been deflated to 2014/15 prices using an implied deflator for the household sector.
03 Nov 2015 2 Comments
in applied welfare economics, economic growth, economic history, macroeconomics
The only two periods of sustained increases in median equivalised British real household disposable income is was under Mrs Thatcher, once she got going on Thatchernomics and under Tony Blair. Despite the ups and downs, real household incomes more than doubled in Britain since the winter of discontent. Equivalised income takes account of changes in the composition of households such as more single-parent households and fewer children since 1977.
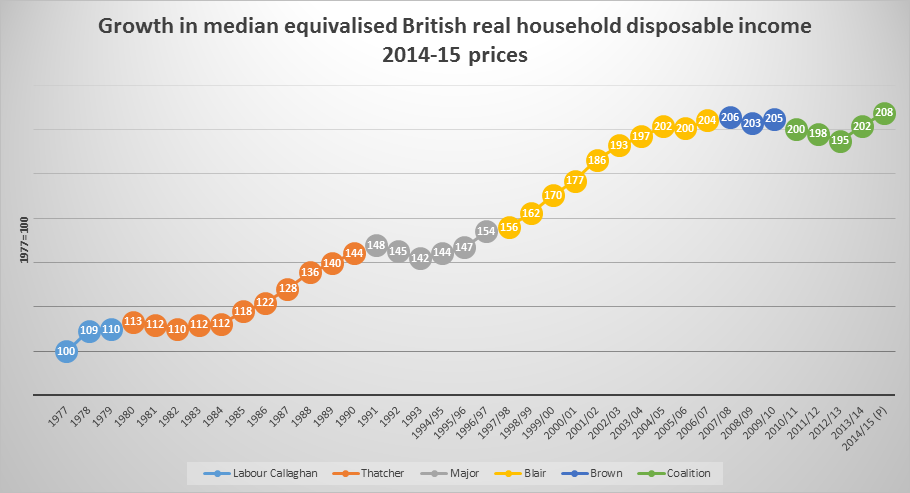
Source: Release Edition Reference Tables – ONS.
Notes:
1 Households are ranked by their equivalised disposable incomes, using the modified-OECD scale.
2 1994/95 represents the financial year ending 1995, and similarly through to 2014/15, which represents the financial year ending 2015.
3 Income figures have been deflated to 2014/15 prices using an implied deflator for the household sector
01 Nov 2015 Leave a comment
in economic growth, politics - New Zealand, politics - USA
31 Oct 2015 1 Comment
in economic growth, economic history, macroeconomics, Marxist economics, public economics
Max Roser seems upset that British inequality rose since the 1980s for the top 1%. Other measures of inequality did not rise such as for disposable income.
https://twitter.com/MaxCRoser/status/657509056052133888
At the same time as top income shares grew at a pace, as shown in the chart below, the British economy boomed under the Thatchernomics, and if the British Left is to believed, under Thatchernomics by another name under Tony Blair. I’m not suggesting much in the way of linkages but the British Left gets excited about the relationship between top income shares and British economic prosperity. Britain grew at well above the trend rate of growth for the USA in the 20th‘s century for most of the period of Thatchernomics despite rising top 1% income shares or maybe course of that. Let’s not get carried away about linkages.
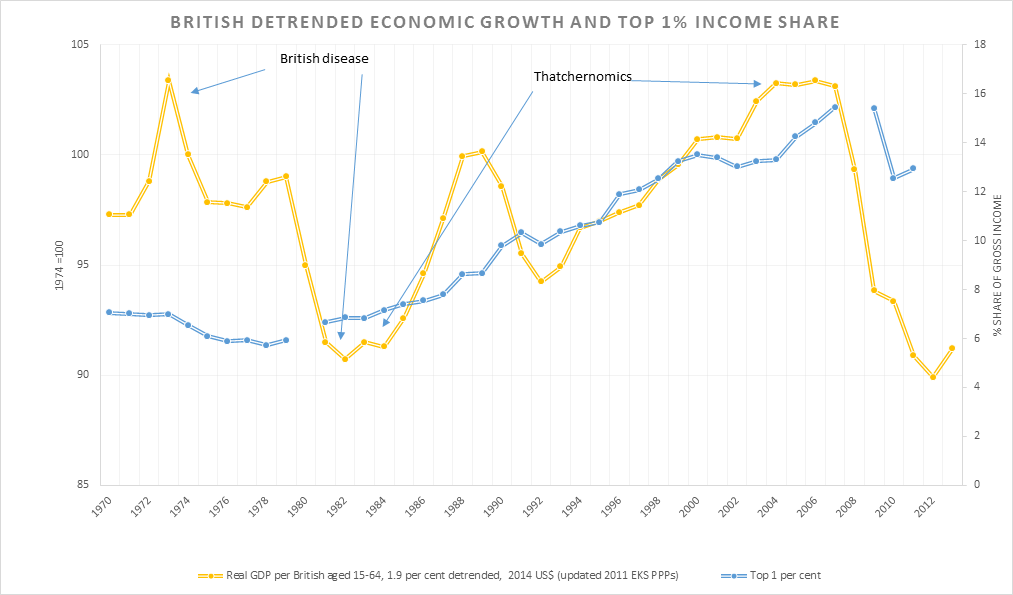
Source: Computed from OECD Stat Extract and The Conference Board. 2015. The Conference Board Total Economy Database™, May 2015, http://www.conference-board.org/data/economydatabase/ and Anthony B Atkinson and Salvatore Morelli CHARTBOOK OF ECONOMIC INEQUALITY.
In the chart above, British economic growth since 1970 is detrended by the growth rate of the USA for the 20th century. The USA is taken to be the global technological frontier. A flat-line in the chart above is British growth at the same rate the USA which is 1.9%; a rising line is growth in that year faster than trend; and a falling line is growth below the trend rate growth.
25 Oct 2015 Leave a comment
in applied welfare economics, economic growth, economic history, macroeconomics, Marxist economics Tags: endogenous growth theory, envy, Leftover Left, politics of envy, Sweden, top 1%
#Sweden: Inequality decreased hugely in the 20th century – but is now rising.
bit.ly/1DEBY1P https://t.co/MHPgp29AWZ—
Max Roser (@MaxCRoser) October 24, 2015
A fall in the share of the top 1% of total Swedish total incomes was in tune with the emergence of a new word in the English language which was Swedosclerosis. That was the long stagnation in the Swedish economy in the 1970s and the 1980s with Swedish economic growth well below that in the trend rate of growth in the USA. Only after an increase in the top 1% share in Sweden did economic growth start recovering to trend.
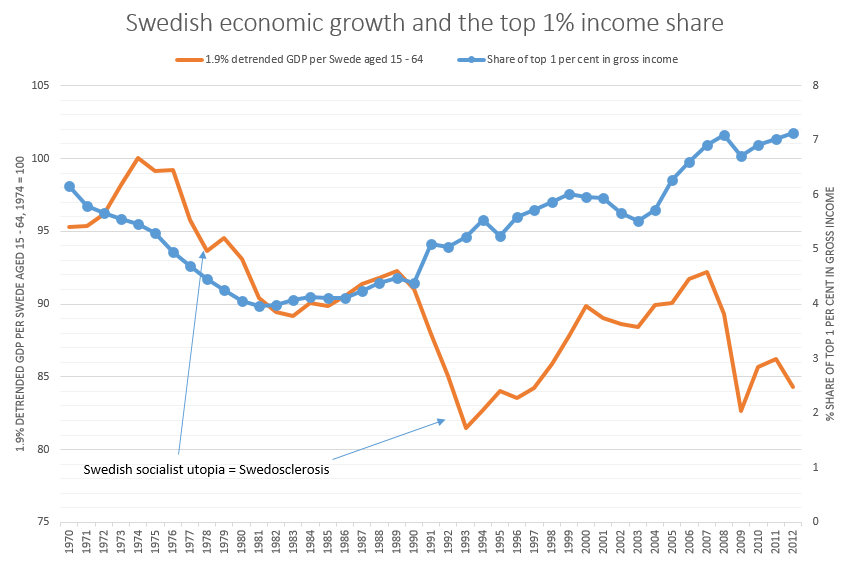
Source: Computed from OECD StatExtract and The Conference Board. 2015. The Conference Board Total Economy Database™, May 2015, http://www.conference-board.org/data/economydatabase/
In the chart above, a flat-line in real GDP per working age Swede is growth at the trend rate of the US economy for the 20th century which was 1.9% per year. A falling line is Swedish growth below trend, a rising line is growth above that trend rate of 1.9% in Sweden. A trend rate of 1.9% is the trend rate of growth currently used by Edward Prescott for the USA in the 20th century.
Celebrating humanity's flourishing through the spread of capitalism and the rule of law
Celebrating humanity's flourishing through the spread of capitalism and the rule of law
Celebrating humanity's flourishing through the spread of capitalism and the rule of law
Celebrating humanity's flourishing through the spread of capitalism and the rule of law
Celebrating humanity's flourishing through the spread of capitalism and the rule of law
Celebrating humanity's flourishing through the spread of capitalism and the rule of law
Celebrating humanity's flourishing through the spread of capitalism and the rule of law
A History of the Alt-Right
Econ Prof at George Mason University, Economic Historian, Québécois
Celebrating humanity's flourishing through the spread of capitalism and the rule of law
Scholarly commentary on law, economics, and more
Beatrice Cherrier's blog
Celebrating humanity's flourishing through the spread of capitalism and the rule of law
Celebrating humanity's flourishing through the spread of capitalism and the rule of law
Celebrating humanity's flourishing through the spread of capitalism and the rule of law
Why Evolution is True is a blog written by Jerry Coyne, centered on evolution and biology but also dealing with diverse topics like politics, culture, and cats.
Celebrating humanity's flourishing through the spread of capitalism and the rule of law
A rural perspective with a blue tint by Ele Ludemann
DPF's Kiwiblog - Fomenting Happy Mischief since 2003
Celebrating humanity's flourishing through the spread of capitalism and the rule of law
The world's most viewed site on global warming and climate change
Tim Harding's writings on rationality, informal logic and skepticism
A window into Doc Freiberger's library
Let's examine hard decisions!
Commentary on monetary policy in the spirit of R. G. Hawtrey
Thoughts on public policy and the media
Celebrating humanity's flourishing through the spread of capitalism and the rule of law
Politics and the economy
A blog (primarily) on Canadian and Commonwealth political history and institutions
Reading between the lines, and underneath the hype.
Economics, and such stuff as dreams are made on
"The British constitution has always been puzzling, and always will be." --Queen Elizabeth II
Celebrating humanity's flourishing through the spread of capitalism and the rule of law
Celebrating humanity's flourishing through the spread of capitalism and the rule of law
WORLD WAR II, MUSIC, HISTORY, HOLOCAUST
Undisciplined scholar, recovering academic
Celebrating humanity's flourishing through the spread of capitalism and the rule of law
Res ipsa loquitur - The thing itself speaks
In Hume’s spirit, I will attempt to serve as an ambassador from my world of economics, and help in “finding topics of conversation fit for the entertainment of rational creatures.”
Researching the House of Commons, 1832-1868
Articles and research from the History of Parliament Trust
Reflections on books and art
Posts on the History of Law, Crime, and Justice
Celebrating humanity's flourishing through the spread of capitalism and the rule of law
Exploring the Monarchs of Europe
Cutting edge science you can dice with


Recent Comments