Figure 1: French, German and Italian unemployment rates, 1956 – 2013

Source: OECD StatExtract.
Celebrating humanity's flourishing through the spread of capitalism and the rule of law
03 Jun 2015 Leave a comment
in economic growth, economic history, job search and matching, labour economics, labour supply, macroeconomics, unemployment Tags: Eurosclerosis, France, Germany, Italy
Figure 1: French, German and Italian unemployment rates, 1956 – 2013
Source: OECD StatExtract.
31 May 2015 1 Comment
in economic growth, economic history, macroeconomics, politics - Australia, politics - New Zealand Tags: Australia, Canada, economic geography, endogenous growth theory, lost decades
Figure 1 shows that Canada has been diverging from Australia in real GDP per working age person since the mid-1990s particularly since the global financial crisis.
Figure 1: Real GDP per New Zealander, Canadian and Australian aged 15-64, converted to 2013 price level with updated 2005 EKS purchasing power parities, 1956-2013

Source: Computed from OECD StatExtract and The Conference Board, Total Database, January 2014, http://www.conference-board.org/economics
In common with New Zealand, Figure 2 shows that Canadian productivity has been in a pretty much along declines is about 1974, rarely catching up with any lost ground. Figure 1 shows that Canada used to be richer than Australia but is now poorer than Australia. Figure 2 is real GDP growth data detrended by the growth rate of the USA in the 20th century. A flat line in figure 2 is annual real GDP growth at 1.9%; a rising line is growth above 1.9%; a falling line is annual growth below 1.9% a year.
Figure 2: Real GDP per New Zealander, Canadian and Australian aged 15-64, converted to 2013 price level with updated 2005 EKS purchasing power parities, 1.9 per cent detrended, 1956-2013

Source: Computed from OECD StatExtract and The Conference Board, Total Database, January 2014, http://www.conference-board.org/economics
Figure 2 shows that Canadian productivity has been below trend for perhaps 30 years. There has been the occasional recovery but followed by a further decline. If Canadian labour productivity had grown at the same rate as the USA since 1974, labour productivity in Canada is something like 18% better.
Australia, as shown in figure 2, has neither caught up nor falling behind the USA in labour productivity for the entire post-war period since 1956. Canada has been falling behind its neighbour most markedly since the mid-1970s.
The proximate causes of the Canadian productivity gap with the USA have a familiar echo to New Zealand ears. Relative to the USA, Rao et al. (2006) and Sharp (2003) attributed the gap to less capital per worker, an innovation gap as shown by lower R&D expenditure, a smaller and less dynamic high technology sector, less developed human capital at the top end of the labour market, and more limited scale and scope economies.
These factors have been put forward, at one time or another, as the proximate causes of the New Zealand productivity gap with the USA. Identifying the barriers to higher Canadian productivity may offer fresh insights into removing similar productivity barriers in New Zealand.
Canada, New Zealand and Australia should be catching-up with the USA in productivity per capita because copying the global leader is cheaper than innovation. Canada, New Zealand and Australia all have the basics to do this: a market economy, the rule of law and openness to foreign technology and international trade.
Instead of asking why New Zealand is not catching-up with Australian productivity, further study of the lack of productivity catch-up of Australia and Canada with the USA may uncover subtle barriers to productivity growth with similarities in New Zealand.
The productivity decline in Canada is of interest in New Zealand because Canada certainly cannot blame remoteness because it borders the USA. Canada cannot blame lack of size because it is noticeably larger than Australia and certainly New Zealand.
31 May 2015 Leave a comment
in business cycles, economic growth, economic history, great depression, great recession, macroeconomics, politics - USA Tags: prosperity and depression
30 May 2015 Leave a comment
in economic growth, macroeconomics Tags: British economy, Margaret Thatcher
25 May 2015 1 Comment
in economic growth, economic history, economics of regulation, industrial organisation, job search and matching, labour economics, unions Tags: Employment Contracts Act, employment law, employment protection laws, employment regulation, labour market deregulation, lost decades, union power
The Council of Trade Unions scored something of an own goal in the 2014 election campaign when it was denouncing the Employment Contracts Act 1991 as the reason for wages growth have not kept up with GDP per capita growth since its passage in 1991. Its evidence in chief against the deregulation of the New Zealand labour market is in the snapshot below showing their graph of real GDP per capita and average real wages from 1965 to 2014.

Source: Low Wage Economy | New Zealand Council of Trade Unions – Te Kauae Kaimahi.
The chart selected by the Council of Trade Unions shows several distinct trends in wages growth and real GDP growth per capita in New Zealand. None of these trends nor breaks in trends support the hypothesis that the days prior to the Employment Contracts Act 1991 were the good old days where workers shared generally in gains from economic growth.
From about 1970 to 1975 in the snapshot below of the Council of Trade Unions chart there was rapid real wages growth, well in excess of real growth in per capita GDP. This wages breakout was followed by some ups and downs but essentially wages in 1995 were no different from what they were in 1975. Real wages were about $24 per hour in real terms in New Zealand for about 20 years – from 1975 to 1995.

These are the good old days in the eyes of the Council of Trade Unions. No real wages growth for 20 years. There was no real GDP per capita growth from 1975 until 1979 nor in the five years leading up to the passage of the Employment Contracts Act 1991 in the chart selected by the Council of Trade Unions in the snapshot above.
The period leading up to 1975 in the preceding wages breakout was the zenith of union membership with nearly 70% of all workers belonging to a union – see figure 1. What followed from 1975 was a long declining in trade union membership that did not end until just after the Employment Contracts Act in 1991 – see figure 1.
Figure 1: Trade union densities, New Zealand, Australia, United Kingdom and United States, 1970–2013

Source: OECD StatExtract.
Whatever happened to union power in New Zealand happened before the passage of the Employment Contracts Act 1991 and with it the deregulation of the New Zealand labour market. 20 years of no real wages growth and economic stagnation may explain part of the decline of unions in New Zealand.
Real GDP per capita growth was pretty stagnant after 1975 to 1994 in the chart of data selected by the Council of Trade Unions, which is why I have previously referred to 1974 to 1992 as New Zealand’s Lost Decades – see figures 2 and 3.
Figure 2: Real GDP per New Zealander and Australian aged 15-64, converted to 2013 price level with updated 2005 EKS purchasing power parities, 1956-2013, $US
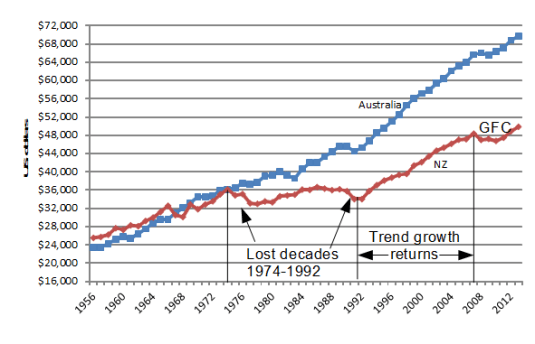
Source: Computed from OECD Stat Extract and The Conference Board, Total Database, January 2014, http://www.conference-board.org/economics
Figure 2 shows that New Zealand lost two decades of productivity growth between 1974 and 1992 after level pegging with Australia for the preceding two decades.
These lost decades of growth are the unions’ good old days but workers cannot share in the general gains of economic growth when there isn’t any economic growth as the chart selected by the Council of Trade Unions and figure 2 both show.
New Zealand returned to trend growth in real GDP per working age New Zealander between 1992 and 2007, which is straight after the passage of the Employment Contracts Act 1991 – see figure 2. Coincidence?
Figure 3: Real GDP per New Zealander and Australian aged 15-64, converted to 2013 price level with updated 2005 EKS purchasing power parities, 1.9 per cent detrended, base 100 = 1974, 1956-2013, $US
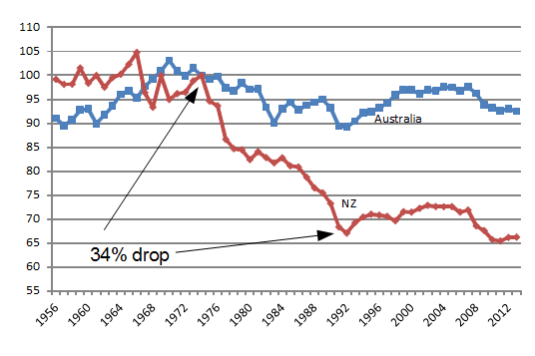
Source: Computed from OECD Stat Extract and The Conference Board, Total Database, January 2014, http://www.conference-board.org/economics
In Figure 3, a flat line equates to a 1.9% annual growth rate in real GDP per working age person; a falling line is a below trend growth rate; a rising line is an above 1.9% growth rate of real GDP per working age person. The trend growth rate of 1.9% per working age person is the 20th century trend growth rate that Edward Prescott currently estimates for the global industrial leader, which is the United States of America.
Figure 3 shows that there was a 34% drop against trend growth in real GDP per working age New Zealander between 1974 and 1992; a return to trend growth between 1992 and 2007; and a recession to 2010. this 34% drop against trend productivity growth is looked upon by the Council of Trade Unions as some sort of good old days.
A long period of no labour productivity growth and little real GDP per capita growth are pretty good reasons to rethink New Zealand’s economic policies at a fundamental level, which is exactly what happened after 1984 with the election of a Labour Government.
The unions have conveniently provided another explanation for the Lost Decades of growth in New Zealand from 1974 to 1992. That is the rapid growth of real wages ahead of real GDP per capita in the seven years before growth stalled in New Zealand in 1974 in the snapshot above. This real wages breakout was followed by two decades of lost growth.
Most ironically of all, steady growth in real wages in New Zealand did not return until after the passage of the Employment Contracts Act in 1991! After nearly 20 years of no real wages growth, real wages growth returned at long last in 1995.
After staying at about $24 per hour for 20 years from 1975 in the good old days of union power and collective bargaining, average wages in New Zealand have increased from $24 an hour to about $28 per hour by 2014 in one of the most deregulated labour markets in the world.
The Council of Trade Unions regards the return of real wages growth after a 20 year hiatus as an unwelcome development or something to complain about.
24 May 2015 Leave a comment
in applied price theory, business cycles, econometerics, economic growth, economic history, economics of media and culture, macroeconomics Tags: consultants, efficient markets hypothesis, forecasting errors
19 May 2015 Leave a comment
in economic growth, economic history, macroeconomics, politics - USA Tags: British economy, Canada, convergence
Figure 1: US and Canadian real GDP per capita are as percentage of British GDP per capita (1990 Int. GK$PPP), 1800 – 2010

Source: The Maddison-Project, http://www.ggdc.net/maddison/maddison-project/home.htm 2013 version.
18 May 2015 Leave a comment
in economic growth, economic history, macroeconomics Tags: British economy, Canada, convergence, industrial revolution
The USA only overtook Britain in per capita GDP per capita in purchasing power parity terms early in the 20th century. Canada overtook the mother country in the post-war period.
Figure 1: British, American and Canadian GDP per capita (1990 Int. GK$PPP), 1775 – 2010

Source: The Maddison-Project, http://www.ggdc.net/maddison/maddison-project/home.htm 2013 version.
Figure 2: British, American and Canadian GDP per capita (1990 Int. GK$PPP), 1775 – 1870

Source: The Maddison-Project, http://www.ggdc.net/maddison/maddison-project/home.htm 2013 version.
Figure 3: British, American and Canadian GDP per capita (1990 Int. GK$PPP), 1870 – 2010

Source: The Maddison-Project, http://www.ggdc.net/maddison/maddison-project/home.htm 2013 version.
17 May 2015 Leave a comment
in development economics, economic growth, economic history, growth disasters, growth miracles, macroeconomics Tags: Australia, British economy, convergence, lost decades, Maddison database, New Zealand
Pretty quickly according to figure 1. Britain, Australia and New Zealand quickly had similar standards of living in the middle of the 19th century until about 1880. Australia was richer for about 20 years until the great Federation drought took the wind out of its sails.
Figure 1: British, Australian and New Zealand GDP per capita (1990 Int. GK$PPP), 1820 – 2010

Source: The Maddison-Project, http://www.ggdc.net/maddison/maddison-project/home.htm 2013 version.
New Zealand then broke away at the end of the Second World War from both Australia and UK. In the mid-1960s circumstances changed with Australia drifting ahead of the UK and New Zealand drifting away to a lower standard of living.
Figure 2: British and Australian GDP per capita (1990 Int. GK$PPP), 1820 – 2010

Source: The Maddison-Project, http://www.ggdc.net/maddison/maddison-project/home.htm 2013 version.
Figure 2 shows that from about 1960 until 1990 Australia was richer than the UK. After that, the growth dividend of Thatchernomics allowed the British to catch up again to the Australians.
Figure 3: British and New Zealand GDP per capita (1990 Int. GK$PPP), 1820 – 2010

Source: The Maddison-Project, http://www.ggdc.net/maddison/maddison-project/home.htm 2013 version.
Figure 3 shows that New Zealand was richer than the UK in the mid-20th century. The lost decades in New Zealand from 1974 to 1992 let the sick man of Europe overtake New Zealand before Thatchernomics caused a growth spurt in the UK to take the British well ahead.
Figure 4: Australian and New Zealand GDP per capita (1990 Int. GK$PPP), 1820 – 2010

Source: The Maddison-Project, http://www.ggdc.net/maddison/maddison-project/home.htm 2013 version.
Figure 4 shows that New Zealand was richer than Australian in the first part of the post-war period. The divergence started with the onset of the lost decades in New Zealand in the early 1970s.
15 May 2015 Leave a comment
in economic growth, economic history, macroeconomics, politics - Australia, politics - New Zealand Tags: Australia, British economy, lost decades
Figure 1: Real GDP per New Zealander, British and Australian aged 15-64, converted to 2013 price level with updated 2005 EKS purchasing power parities, 1956-2013

Source: Computed from OECD Stat Extract and The Conference Board, Total Database, January 2014, http://www.conference-board.org/economics
Figure 2: Real GDP per New Zealander, British and Australian aged 15-64, converted to 2013 price level with updated 2005 EKS purchasing power parities, 1.9 per cent detrended, 1956-2013

Source: Computed from OECD Stat Extract and The Conference Board, Total Database, January 2014, http://www.conference-board.org/economics
12 May 2015 Leave a comment
in applied price theory, economic growth, economic history, great depression, labour economics, labour supply, macroeconomics, politics - USA, Public Choice, public economics, taxation Tags: Edward Prescott, Euroclerosis, France, Germany, labour supply, Robert Lucas, taxation and labour supply
Figure 1 shows that Americans work the same hours per year pretty much the entire post-war period. By contrast, there is been a long decline in hours worked in Germany and France. The large drop in 1992 was German unification.
Figure 1: annual hours worked per working age American, German and French, 1950 – 2013

Source: OECD StatExtract and The Conference Board Total Economy Database™,January 2014, http://www.conference-board.org/data/economydatabase/
The long decline seemed to tally with the disproportionately sharp rise in the average tax rate on labour income, including social security contributions in France and Germany. When tax rates on labour income, including social security contributions stabilised in about 1980, hours worked stabilised in all countries.
Figure 2: average tax rate on labour income,USA, Germany and France, 1950 – 2013

Source: Source: Cara McDaniel.
Some pander to the great vacation theory of European labour supply. This is the hypothesis of a large increase in the preference for leisure in the European Union member states. That is, mass voluntary unemployment and mass voluntary reductions and labour supply by choice by Europeans. They just decided to work less.
This is not the first outing for the great vacation theory of labour supply. In the late 1970s, Modigliani dismissed the new classical explanation of Lucas and Rapping (1969) of the U.S. great depression in which the 1930s unemployment was voluntary unemployment – the great depression was just a great vacation – with the following remarks:
Sargent (1976) has attempted to remedy this fatal flaw by hypothesizing that the persistent and large fluctuations in unemployment reflect merely corresponding swings in the natural rate itself.
In other words, what happened to the U.S. in the 1930’s was a severe attack of contagious laziness!
I can only say that, despite Sargent’s ingenuity, neither I nor, I expect most others at least of the non-Monetarist persuasion, are quite ready yet. to turn over the field of economic fluctuations to the social psychologist!
As Prescott has pointed out, the USA in the Great Depression and France since the 1970s both had 30% drops in hours worked per adult. That is why Prescott refers to France’s economy as depressed. The reason for the depressed state of the French (and German) economies is taxes, according to Prescott:
Virtually all of the large differences between U.S. labour supply and those of Germany and France are due to differences in tax systems.
Europeans face higher tax rates than Americans, and European tax rates have risen significantly over the past several decades.
Countries with high tax rates devote less time to market work, but more time to home activities, such as cooking and cleaning. The European services sector is much smaller than in the USA.
Time use studies find that lower hours of market work in Europe is entirely offset by higher hours of home production, implying that Europeans do not enjoy more leisure than Americans despite the widespread impression that they do. Europeans did not work less. They worked more on activities that were not taxed.
11 May 2015 Leave a comment
in business cycles, economic growth, economic history, macroeconomics, politics - USA Tags: Canada, prosperity and depression
Figure 1: Real GDP per American and Canadian aged 15-64, converted to 2013 price level with updated 2005 EKS purchasing power parities, 1955-2013

Source: Computed from OECD Stat Extract and The Conference Board, Total Database, January 2014, http://www.conference-board.org/economics
Figure 2: Real GDP per American and Canadian aged 15-64, converted to 2013 price level with updated 2005 EKS purchasing power parities, 1.9 per cent detrended, 1955-2013

Source: Computed from OECD Stat Extract and The Conference Board, Total Database, January 2014, http://www.conference-board.org/economics
A rising line in figure 2 is above trend rate growth; a flat line is trend growth of 1.9%; and a falling line is below trend growth.
Canada has a volatile ride in the post-war period after economic success up until 1975. Despite ups and downs the Canadian economy has been in a long-term decline since 1975. Growth as rarely being at trend and was often below, sometimes sharply below trend.
None of these depressed periods in the Canadian economy were long enough to count as a great depression. Instead there was just a long-term decline.
Canada is next door to the USA and a member of the North American Free Trade Area (NAFTA) and its antecedents so its cannot blame distance nor small size for its decline in economic performance as some do in New Zealand.
Relative to the USA, Rao et al. (2006) and Sharp (2003) attributed the gap between the USA and Canada to less capital per Canadian worker, an innovation gap as shown by lower R&D expenditure in Canada, a smaller and less dynamic high technology sector in Canada, less developed human capital at the top end of the Canadian labour market, and more limited scale and scope economies in Canada.
These factors have been put forward, at one time or another, as the proximate causes of the New Zealand productivity gap with the USA. Identifying the barriers to higher Canadian productivity may offer fresh insights into removing similar productivity barriers in New Zealand.
Figure 3 suggests that the increase in tax revenues as a percentage of GDP from 30% to 35% at the same time as the Canadian economic boom came to an end and its economic decline began is worthy of further scrutiny. The strong economic recovery from 1995 onwards also coincided with the decline tax revenues as a percentage of GDP.
Figure 3: tax revenue as a percentage of GDP

Source: OECD StatExtract
11 May 2015 Leave a comment
in business cycles, economic growth, Euro crisis, fiscal policy, global financial crisis (GFC), great depression, great recession, macroeconomics Tags: labour productivity, prosperity and depression, TFP
Britain has led most of the rich world in job creation, but badly lagged in productivity. on.wsj.com/1IiEjli http://t.co/URIFuFS9Il—
Sudeep Reddy (@Reddy) May 07, 2015
10 May 2015 Leave a comment
in economic growth, economics of regulation, income redistribution, macroeconomics, politics - New Zealand, politics - USA, rentseeking, urban economics Tags: Enrico Moretti, Green Left, housing affordability, Inner-city Left, labour mobility, land supply, land use planning, land use regulation, NIMBYs, regional mobility, RMA, zoning
Bloomberg Business highlighted a great new study by Enrico Moretti on power of the regulatory restrictions on land supply to destroy wealth.

Moretti focused on the impact that restrictions on land supply have on the ability of workers to move to higher productivity cities. Moretti is the second best urban economist working at the moment. The best is Ed Glaeser. Moretti concluded that
A limited number of American workers can have access to these very high-productivity cities
He concluded that a more efficient distribution would be “a general benefit for the entire economy.”
The secret of his analysis was to look at how different US cities, the high productivity cities, contributed to national economic growth. He then explore the implications of fewer and fewer workers been able to move to these cities to take advantage of the great productive potential. The barrier to them moving was high housing prices and high rents.
For example, labour productivity grew quickly in San Francisco, New York and San Jose overt 45-years. All of these cities are famous for their human capital-intensive industries including technology and finance. These cities weren’t America’s growth engine:
The reason is that the main effect of the fast productivity growth in New York, San Francisco, and San Jose was an increase in local housing prices and local wages, not in employment.
Despite the large difference in local GDP growth between New York, San Jose, and San Francisco and the Rust Belt cities, both groups of cities had roughly the same contribution to aggregate output growth.
The drivers of US growth between 1964 and 2009 were southern U.S. cities and 19 other large cities. These cities attracted many residents because of good weather and abundant supply of cheap housing.
The lesson both the US and for New Zealand, and Auckland in particular, is this reallocation of population away from the expensive cities with restricted land supply reduced national output because these population movements bring workers to cities "where the marginal product of labour is low."
In a technology boom town such as San Francisco, it is now what like New Zealand will be as Generation Rent runs its course – 65% of residents are renters:
Over the past year, the City and County of San Francisco boasted the second strongest labour market in the nation, adding 25,000 new jobs. Yet only 2,548 new housing units were permitted and even fewer were built.
Just think: 25,000 new workers and their families have been knocking on San Francisco doors, but there are new units for less than 10 percent of them. It is not surprising that apartment prices get bid up.
10 May 2015 Leave a comment
in business cycles, economic growth, job search and matching, labour economics, labour supply, macroeconomics, politics - USA, unemployment Tags: Canada, unemployment rates

Source: OECD StatExtract
Unemployed people are defined as those who report that they are without work, that they are available for work and that they have taken active steps to find work in the last four weeks.
The ILO Guidelines specify what actions count as active steps to find work; these include answering vacancy notices, visiting factories, construction sites and other places of work, and placing advertisements in the press as well as registering with labour offices.
Celebrating humanity's flourishing through the spread of capitalism and the rule of law
Scholarly commentary on law, economics, and more
Beatrice Cherrier's blog
Celebrating humanity's flourishing through the spread of capitalism and the rule of law
Celebrating humanity's flourishing through the spread of capitalism and the rule of law
Celebrating humanity's flourishing through the spread of capitalism and the rule of law
Why Evolution is True is a blog written by Jerry Coyne, centered on evolution and biology but also dealing with diverse topics like politics, culture, and cats.
Celebrating humanity's flourishing through the spread of capitalism and the rule of law
Celebrating humanity's flourishing through the spread of capitalism and the rule of law
A rural perspective with a blue tint by Ele Ludemann
DPF's Kiwiblog - Fomenting Happy Mischief since 2003
Celebrating humanity's flourishing through the spread of capitalism and the rule of law
The world's most viewed site on global warming and climate change
Tim Harding's writings on rationality, informal logic and skepticism
A window into Doc Freiberger's library
Let's examine hard decisions!
Commentary on monetary policy in the spirit of R. G. Hawtrey
Thoughts on public policy and the media
Celebrating humanity's flourishing through the spread of capitalism and the rule of law
Politics and the economy
A blog (primarily) on Canadian and Commonwealth political history and institutions
Reading between the lines, and underneath the hype.
Economics, and such stuff as dreams are made on
"The British constitution has always been puzzling, and always will be." --Queen Elizabeth II
Celebrating humanity's flourishing through the spread of capitalism and the rule of law
Celebrating humanity's flourishing through the spread of capitalism and the rule of law
WORLD WAR II, MUSIC, HISTORY, HOLOCAUST
Undisciplined scholar, recovering academic
Celebrating humanity's flourishing through the spread of capitalism and the rule of law
Res ipsa loquitur - The thing itself speaks
Celebrating humanity's flourishing through the spread of capitalism and the rule of law
Researching the House of Commons, 1832-1868
Articles and research from the History of Parliament Trust
Reflections on books and art
Posts on the History of Law, Crime, and Justice
Celebrating humanity's flourishing through the spread of capitalism and the rule of law
Exploring the Monarchs of Europe
Cutting edge science you can dice with
Small Steps Toward A Much Better World
“We do not believe any group of men adequate enough or wise enough to operate without scrutiny or without criticism. We know that the only way to avoid error is to detect it, that the only way to detect it is to be free to inquire. We know that in secrecy error undetected will flourish and subvert”. - J Robert Oppenheimer.
The truth about the great wind power fraud - we're not here to debate the wind industry, we're here to destroy it.
Celebrating humanity's flourishing through the spread of capitalism and the rule of law
Celebrating humanity's flourishing through the spread of capitalism and the rule of law
Economics, public policy, monetary policy, financial regulation, with a New Zealand perspective
Celebrating humanity's flourishing through the spread of capitalism and the rule of law
Restraining Government in America and Around the World


Recent Comments