
Ending child labour can only be through expanding family opportunities
11 Aug 2014 Leave a comment
in development economics, economic growth, human capital, labour economics, technological progress Tags: Ben Powell, child labour
Groundhog Day for economic forecasters – The Grumpy Economist
13 Jul 2014 Leave a comment
in economic growth, great recession Tags: forecasting errors, John Cochrane

Euroland is presented by progressives as the type of mixed economies they prefer and larger governments they want
03 Jul 2014 Leave a comment
in applied welfare economics, economic growth, macroeconomics Tags: Eurosclerosis, progressive politics

The OECD countries with persistently high unemployment rate are the European welfare states – about double figures for 2 decades or more now. The reality is progressive politics pits workers against worker, and the middle-class against the poor and rich with the progressives cheering for the middle-class.
Euroland has a labour aristocracy – a two-tier system with ultra-secure workers with the permanent jobs and vulnerable temporary workers. The prime-age workers with the permanent jobs are pitted against the young, the unemployed and the older workers – these three groups are either locked-out or pushed-out. It took the equally worse recession in U.S. post-war history for their unemployment rates to reach the levels in Euroland in most any year out of the last 20.

Progressive solutions have been tried and they failed: a new word had to be invented to capture the resulting high unemployment rates and stagnant productivity growth from adopting progressive policies: Eurosclerosis!
Milton Friedman on what presidents can do to increase the economic growth rate
28 Jun 2014 1 Comment
in economic growth, macroeconomics, Milton Friedman Tags: Milton Friedmand, The fatel conceit, The pretense to knowledge
First of all, I don’t think the president has a great deal to do with keeping the economy going…
I think presidents have a great deal to do with keeping the economy from growing…
I think the economy is largely independent of the government, and what keeps it going is its own internal development.
However, you can short-circuit that internal development. If you impose very high taxes, and eliminate the incentive to innovate, to improve, to take risks, and do things, you’ll kill the economy. And that’s what’s happened over and over again in other countries around the world.
The U.S. Economic Growth Gap Revisited
18 Jun 2014 Leave a comment
in economic growth, great recession, macroeconomics Tags: The Great Recession

Robert Lucas has asked:
Is it possible that by imitating European policies on labor markets, welfare, and taxes that the U.S. has chosen a new, lower GDP trend?
If so, it may be that the weak recovery we have had so far is all the recovery we will get.
Piketty: A Wealth of Misconceptions by Don Boudreaux
01 Jun 2014 2 Comments
in applied price theory, applied welfare economics, economic growth, entrepreneurship, human capital, labour economics, labour supply Tags: inequality and poverty, Piketty, seen and unseen, The Great Enrichment, The Great Fact

Piketty’s method of doing economics involves frequent grand proclamations about "social justice" and economic "evolutions," but he offers no analyses of the dynamics of individual decision-making, often referred to as "microeconomics," that should be central to the issues he raises…
Revealingly, Piketty writes of income and wealth as being claimed or "distributed," never as being earned or produced. The resulting statistics are too aggregated—too big-picture—to reveal what is happening to individuals on the ground…
He imagines that such aggregates interact in robotic fashion through a logic of their own, unmoved by individual human initiative, creativity, or choice…
If we follow the advice of Adam Smith and examine people’s ability to consume, we discover that nearly everyone in market economies is growing richer…
THE U.S. IS THE bête noir of Piketty and other progressives obsessed with monetary inequality.
But middle-class Americans take for granted their air-conditioned homes, cars, and workplaces—along with their smartphones, safe air travel, and pills for ailments ranging from hypertension to erectile dysfunction…
At the end of World War II, when monetary income and wealth inequalities were narrower than they’ve been at any time in the past century, these goods and services were either available to no one or affordable only by the very rich.
So regardless of how many more dollars today’s plutocrats have accumulated and stashed into their portfolios, the elite’s accumulation of riches has not prevented the living standards of ordinary people from rising spectacularly…
Piketty’s disregard for basic economic reasoning blinds him to the all-important market forces at work on the ground—market forces that, if left unencumbered by government, produce growing prosperity for all. Yet, he would happily encumber these forces with confiscatory taxes.
Foreigners Are Our Friends | Bryan Caplan | Learn Liberty – YouTube
23 May 2014 Leave a comment
in applied price theory, applied welfare economics, economic growth, economics, international economics, Public Choice, rentseeking Tags: anti-foreign bias, Bryan Caplan, free trade, protectionism
Can New Zealand blame distance for its economic woes?
22 May 2014 1 Comment
in economic growth, geography, macroeconomics Tags: Australia, burden of distance, New Zealand, relative productivity performance, Trans-Tasman income gap
Distance is common in many discussions of the relative growth performance of New Zealand. New Zealand is said to be small and remote and poorer for it. The figure below from a Productivity Commission report is an example.
The Productivity Commission put it this way:
New Zealand firms face reduced access to large markets and limited participation in global value chains, where the transfer of advanced technologies now often occurs.
Indeed, global value chains – which can require intensive interaction and just-in-time delivery across borders – may have worsened the impact of New Zealand’s geographic isolation on trade in goods.
The Commission continues on to say that:
These limits on trade and the diffusion of new ideas into New Zealand may explain as much as 15 percentage points of the 27% productivity gap between New Zealand and the average of 20 OECD countries.
This 15 per cent claim is a daring claim. Physical location does not change over time.
New Zealand, Australia and the other European offshoots such as Canada and the USA all prospered for most to all their histories despite their distances from their mother country. Canada cannot blame distance for its weak productivity performance because it is next door to the USA.
Figure 1 below using OECD data suggests that New Zealand and Australian real GDP per capita are both about 10 percentage points lower than they otherwise would be because of distance. A bounty of natural resources gives a less than a two per cent boost to Australia’s real GDP per capita, see Figure 1.
Figure 1: Estimated impact of proximity to markets and natural resources on real GDP per capita, OECD members, average for 2000-2004
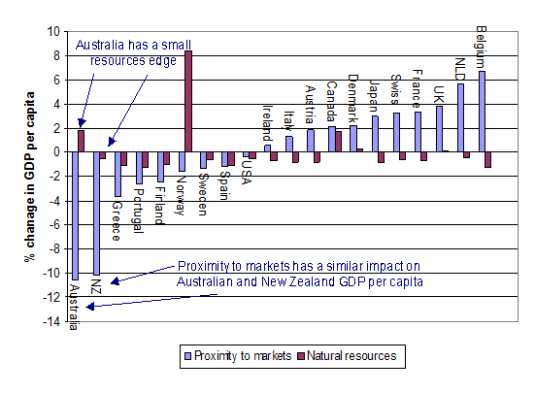
Source: OECD.
The burden of geography is about distance from large agglomerations of production, consumption and supply. There is from the extra cost of exporting to distant markets and the cost penalty from ordering from major suppliers who are far way. Geography can also affect the international flow of ideas and the diffusion of new technologies.
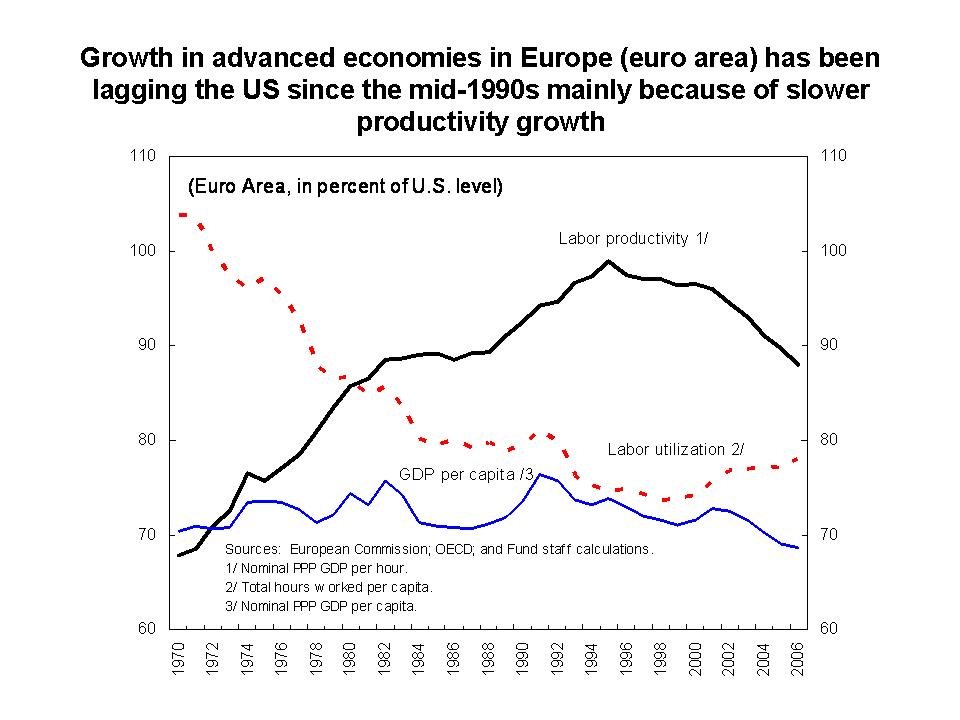
Figure 2 shows that most of the labour productivity gap of New Zealand and many others with the USA is not explained by geography – by access to major markets and any natural resource bounty.
Figure 2: Apparent and geography adjusted hourly labour productivity relative to the USA, 2006
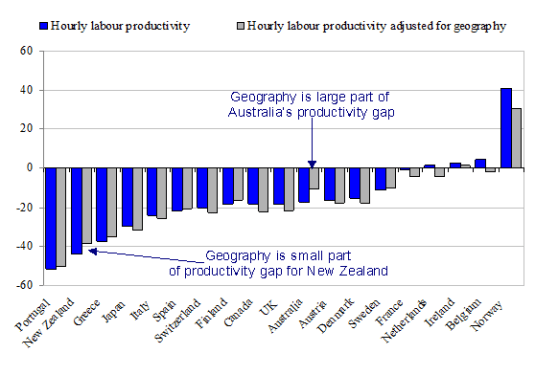
Source: OECD (2008).
New Zealand’s apparent and geography adjusted productivity gaps with the USA are not far apart. In contrast, the OECD (2009c), geography cuts in half the gap in hourly labour productivity between the USA and Australia – see Figure 3.
Figure 3: Percentage point change in hourly labour productivity relative to the USA due to geography, 2006
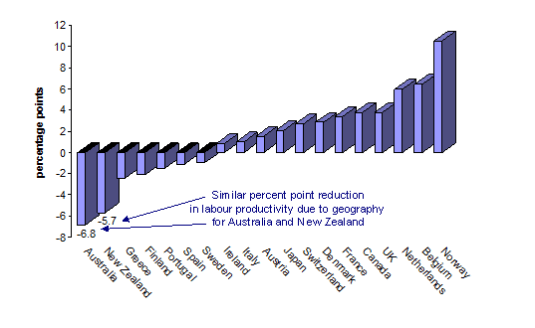
Source: OECD.
The labour productivity gap of New Zealand with the USA is over four times larger than what could be reasonably attributed to geographic burdens. Other factors must account for the bulk of New Zealand’s productivity gap.
More to the point, distance and remoteness explain none of the productivity and income gaps across the Tasman and why this gap suddenly appeared in the 1970s and 1980s to NZ’s disadvantage.
New Zealand lost almost two decades of growth between 1974 and 1992 as shown in Figure 4.
Figure 4: Real GDP per New Zealander and Australian aged 15-64, converted to 2013 price levels with updated 2005 EKS purchasing power parities, 1956-2012
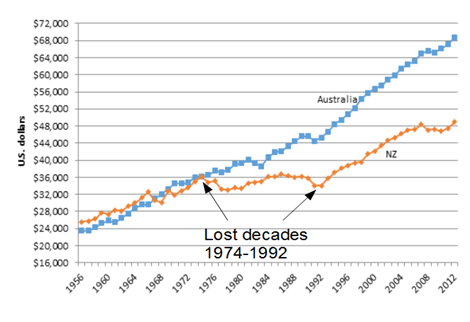
Source: Computed from OECD StatExtract and The Conference Board, Total Database, January 2014.
The Trans-Tasman gap is the income and productivity gap that concerns Kiwis and is the relevant policy yardstick everyone uses or should use.
The emergence of the Trans-Tasman income gap from initial income parity in 1974 – see Figure 4 – cannot be because of distance because both NZ and Australia suffer equally from a 10% productivity burden because of distance.
This common 10% productivity burden due to distance does not explain real GDP per working age person in Australia and NZ dropping from parity in 1974 to a 35% gap inside 20 years and then suddenly stabilising.
Figure 4 showed that NZ started growing again in 1992 after the Ruth Richardson horror budget stabilised economic policy sentiments. There was to be no going back on the economic reforms.
Figure 5 below shows that NZ’s labour productivity growth dropped like a stone between 1974 and 1992 then stabilised at 1.85% growth per year from 1992 to 2005. GDP per working age person in Figure 5 is based to 100 in 1974 and then detrended by 1.85% per year – the trend growth rate of the USA in the 20th century. A flat line in Figure 5 is annual growth in real GDP per working age person of 1.85%. Australia’s growth rate is pretty flat since 1970 bar the odd recession and recovery from the same.
Figure 5: Real GDP per New Zealander and Australian aged 15-64, converted to 2013 price levels with updated 2005 EKS purchasing power parities, base 100 in 1974, 1.85 per cent detrending, 1956-2012
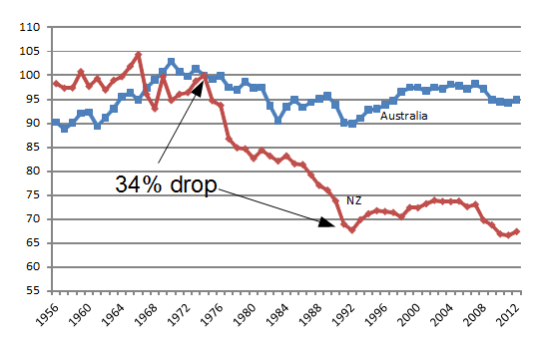
Source: Computed from OECD StatExtract and The Conference Board, Total Database, January 2014.
This 34% productivity drop in NZ from 1974 to the mid-1980s was too rapid to be explained by distance and global value chains suddenly becoming more important than was the case for most of NZ’s history. Australian GDP growth rates was not affected in the slightest by these trends in the geography of trade and input markets.
The Productivity Commission looked at the wrong data to ask the wrong questions. The data analysis undertaken on behalf of the Productivity Commission started in 1980. Figure 6 below shows at all the action and excitement regarding total factor productivity in New Zealand occurred before 1980.
Figure 6: New Zealand total factor productivity and real GDP per New Zealander aged 15-64, 2 per cent detrended, 1955-2000
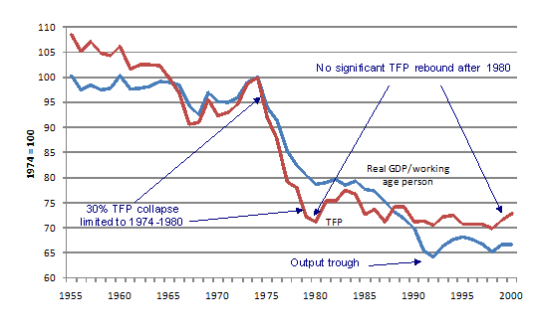
Source: Kehoe and Ruhl (2003).
Kehoe and Ruhl (2003) attributed the decline in the growth of GDP per working age New Zealander after 1974 to 1992 to a sharp decline in total factor productivity from 1974 to 1980.
Figure 6 plots detrended data constructed by Kehoe and Ruhl (2003) to show that total factor productivity fell rapidly in New Zealand between 1974 and 1980, by 30 per cent in all, and then levelled out to grow again at the trend rate of two per cent.
There was no subsequent total factor productivity recovery to make up the lost ground. If this were so, Figure 4 would have had to include a strongly rising line for total factor productivity over many years after 1980 to recover the 30 per cent fall in the level of total factor productivity between 1974 and 1980.
Kehoe and Ruhl (2003) suggested that the identification of the factors that permanently reduced total factor productivity levels in New Zealand between 1974 and 1980 may have great contemporary policy relevance.
The total factor productivity drop identified by Kehoe and Ruhl (2003) occurred before the 1978 start of the Statistics New Zealand productivity data series.
The great value of the Kehoe and Ruhl (2003) data is the drawing out of the major decline in total factor productivity on the eve of the Statistics New Zealand data series.
Kehoe and Ruhl (2003) attributed the 1970s total factor productivity collapse to a massive change in trade patterns after the entry of the UK into the then European Economic Community in 1973.
All discussions of income gaps should be against Australia and any additional burden of distance that New Zealand faces in addition to Australia since 1974 when the Trans-Tasman income gap emerged.
When New Zealand catches-up with Australia in labour productivity that will be the time to start worrying about the burden of geography – a burden that holds back relative productivity equally in both countries. You cannot explain the difference between Australia’s and NZ’s relative productivity by geographic factors they have in common.
Everything’s Amazing and Nobody’s Happy | Bryan Caplan
22 May 2014 Leave a comment
in applied welfare economics, economic growth, technological progress Tags: Bryan Caplan, pessimism
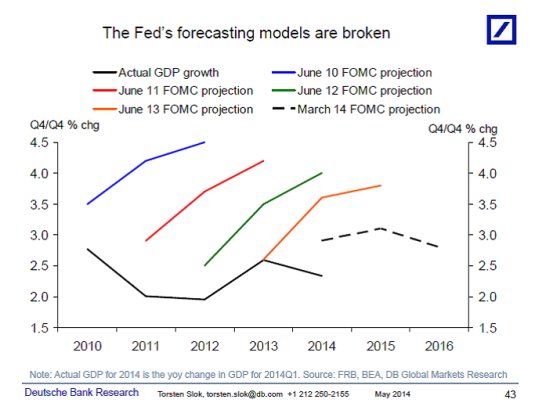
A Great Recession or a permanent move to a lower U.S. growth path?
16 May 2014 Leave a comment
in economic growth, great recession Tags: Obamanomics, trend growth rate of the USA
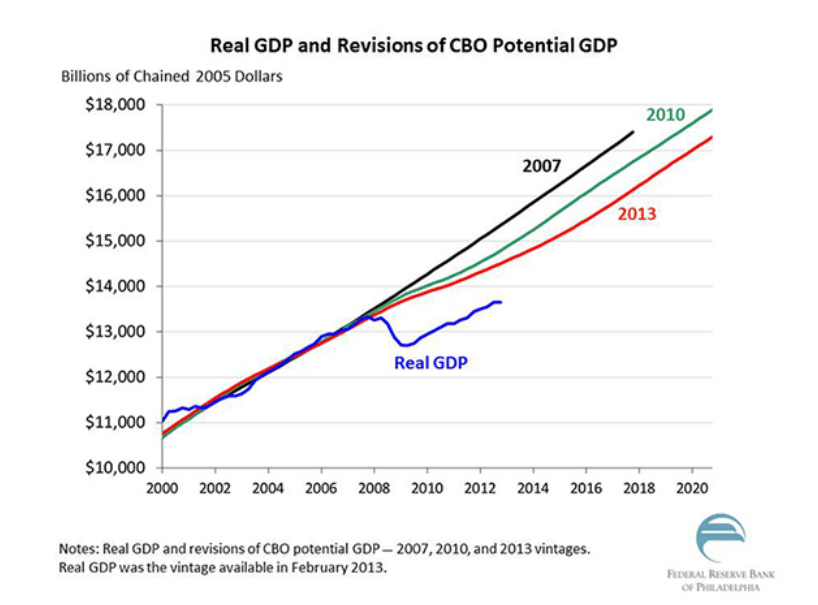
Philadelphia Fed President Charles Plosser made this nice graph on official views of potential GDP and trends in actual GDP.
Supply-Side Economics in Iceland
15 May 2014 Leave a comment
in economic growth, labour economics Tags: Iceland, tax reform
The move to a pay-as-you-earn income tax system in Iceland in 1988 made income earned in 1987 tax-free.
- Icelandic GDP increased by 4.16% in 1987.
- Total labour supply rose by 6.7% in 1987 over the average of 1986 and 1988.
- This included an 8.6% increase in weeks of work supplied by those already in the labour market in 1986.
Notice in the graph the big kink in employment in 1987. A spike just for the year of no taxes. Labour supply then fell away.
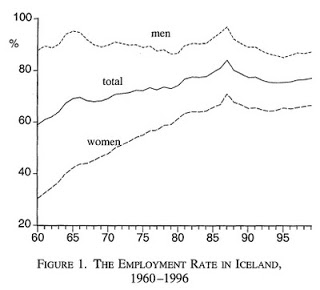
Iceland in 1987 was a unique opportunity to study the labour supply response of individuals who were temporarily faced with a zero marginal-and average-income tax rate.
The path to higher U.S. prosperity
12 May 2014 Leave a comment
in applied welfare economics, economic growth, Edward Prescott, great recession, labour economics, macroeconomics Tags: capital taxation, Edward Prescott, retirement savings, tax reform
Suppose the USA:
- Had mandatory savings for retirement
- Eliminated capital income taxes
- Broadened tax base and lowered the marginal tax rate
- Phased in reforms so all birth-year cohorts are made better off
- Left welfare programs and local public good shares the same
- Savings not part of taxable income, saving withdrawals part of taxable income – with these changes U.S. income tax would be a consumption tax
US Detrended GDP per Capita

Source: Edward Prescott and Ellen McGrattan 2013.
The Rawlsian social justice case for super-entrepreneurs and many more billionaires
04 May 2014 Leave a comment
in applied welfare economics, economic growth, entrepreneurship, industrial organisation, market efficiency, Rawls and Nozick, technological progress Tags: envy, John Rawls, super-rich, SuperEntrepreneurs, top 1%, top talent
The report SuperEntrepreneurs shows that:
- SuperEntrepreneurs founded half the largest new firms created since the end of the Second World War
- There is a strong correlation between high rates of SuperEntrepreneurship in a country and low tax rates
- a low regulatory burden and high rates of philanthropy both correlate strongly with high rates of SuperEntrepreneurship
- Active government and supranational programmes to encourage entrepreneurship – such as the EU’s Lisbon Strategy – have largely failed.
- Yet governments can encourage entrepreneurialism by lowering taxes (particularly capital gains taxes which have a particularly high impact on entrepreneurialism while raising relatively insignificant revenues); by reducing regulations; and by vigorously enforcing property rights.
- High rates of self-employment and innovative entrepreneurship are both important for the economy.
- Yet policy makers should recognise that they are not synonymous and should not assume policies which encourage self-employment necessarily promote entrepreneurship.
- Policy makers should use a definition of entrepreneurship which is based on innovation.
SuperEntrepreneurs examined about 1,000 self-made men and women who have earned at least $1 billion dollars and who appeared in Forbes magazine list of the world’s richest people between 1996 and 2010.

Hong Kong has the most, with around three SuperEntrepreneurs per million inhabitants, followed by Israel, the US, Switzerland and Singapore.
The US is roughly four times more super-entrepreneurial than Western Europe and three times more super-entrepreneurial than Japan.
Super-entrepreneurs tend to be well-educated – 84% have a university degree.
Many started their own company but there is no clear relationship between self-employment and successful entrepreneurship
Steven Kaplan and Joshua Rauh’s “It’s the Market: The Broad-Based Rise in the Return to Top Talent” Journal of Economic Perspectives 2013 found that those in the Forbes 400 richest are less likely to have inherited their wealth or grown-up wealthy.
Today’s super-rich are self-made rich because they produce new and better products and services that people wanted and are willing to pay for.
John Rawls was alive to the importance of incentives in a just and prosperous society.
With his emphasis on fair distributions of income, Rawls’ initial appeal was to the Left. Left-wing thinkers then started to dislike his acceptance of capitalism and his tolerance of large discrepancies in income and wealth.
Rawls excluded envy when we are behind his veil of ignorance designed the social contract about how the society will be organised. He believed that principles of justice should not be affected by individual inclinations, which are mere accidents.
Rawls also argued that the liberties and political status of equal citizens encourage self-respect even when one is less well off than others; and background institutions (including a competitive economy) make it likely that excessive inequalities will not be the rule. He supposes that
the main psychological root of our liability to envy is a lack of self-confidence in our own worth combined with a sense of impotence
Then there is the old Russian joke that tells the story of a peasant with one cow who hates his neighbour because he has two. A sorcerer offers to grant the envious farmer a single wish any thing he wants: “Shoot my neighbour’s cow!” he demands.
Robert Lucas and Edward Prescott discuss the future of economic growth, 2014
10 Apr 2014 Leave a comment
in economic growth, great recession, macroeconomics Tags: Edward Prescott, Robert E. Lucas
On 21 March, Robert E. Lucas Jr., and Edward C. Prescott participated in a roundtable on “The Wealth of Nations in the 21st Century” in Barcelona.
via Chong-En Bai, Robert Lucas, Edward Prescott discuss economic growth in Barcelona – Barcelona GSE.

Recent Comments