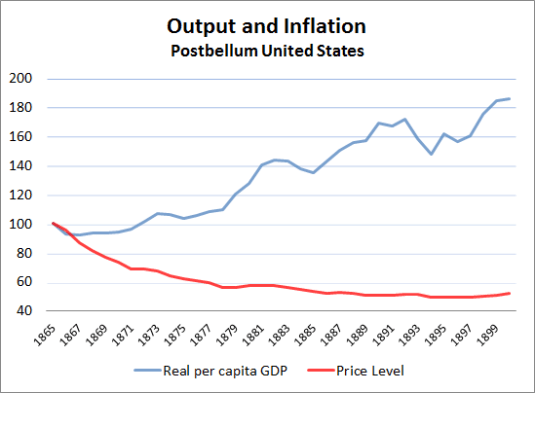
The Greek depression compared

https://twitter.com/komileva/status/559303306477314048

Image

Robert Lucas interview in Brazil, 2nd November 2012

On the role of R&D and boffins in lab coats in the Industrial Revolution

Image

The Golden Rule, John Rawls and just saving for the future generations

Optimal Consumption

Why is the Left so keen to tax the rich of today, which reduces investment, but through this concerns about sustainable development, not tax the rich of the next generation by leaving them a smaller capital stock?

Rawls proposes a principle of just savings. Rawls suggests that each generation puts itself in the place of the next, and asks what it could reasonably expect to receive.

Currently living people have a justice-based reason to save for future people only if such saving is necessary for allowing future people to reach the sufficientarian threshold as specified. This is known as the accumulation stage.

Once just institutions are securely established — this is known as the steady-state stage — justice does not require people to save for future people. Rawls also holds that, in that second stage, people ought to leave their descendants at least the equivalent of what they received from the previous generation.

Edmund Phelps developed a Golden Rule in the 1960s that suggests that it is possible to save and invest too much. Phelps also generated the result that the savings rate can be too high:

The basic significance of the golden rule is as a warning against national policies of over-saving or counterproductive austerity.

Piketty and Capital Taxation in the 21st Century

via Capital Taxation in the 21st Century.

What is the evidence on human capital spillovers? Evidence from the mobility of knowledge workers

While there is a vast literature documenting the large private returns from education and on-the-job human capital (Card 1999; Rubenstein and Weiss 2007; Almeida and Carneiro 2008), evidence of human capital spillovers is limited. Many studies find little evidence of spillovers from education (Lange and Topel (2005), Ciccone and Peri (2006)). Studies even struggle to find small spillovers from another year in high school (Acemoglu and Angrist 2001). Differences in human capital also explain only a small part of cross-national differences in incomes per capita (Hsieh and Klenow 2010; Parente and Prescott 2000, 2005).

The R&D industries offer a case study of the likely size of skills spillovers from worker mobility from large firms. The mobility of technical personnel and the human capital embodied in them across R&D firms is a substantial source of knowledge transfer (Møen 2005). For there to be a spillover, the new employer must pay recruits less than the value added by the job experience and skills they bring to the fold.

A key advantage of studying the mobility of R&D workers for skills spillovers is these industries are populated with many spin-offs founded by the ex-employees of larger firms. R&D spin-offs tend to be larger on average that other new firms and initially employ more advanced, more experienced workers and more technical specialists than do other new firms (Andersson and Klepper 2013).

Capturing the value of skills spillovers from job-hopping is a major business opportunity. The efforts of entrepreneurs to create and enforce property rights over information and other resources as their value increases are central to the organisation of both markets and firms.

A litmus test for the capture of the value of skills spillover is whether wages adjust in line with evolving career opportunities. Becker (2007, p. 134) explains this process of market adaptation and entrepreneurship as follows:

Firms introducing innovations are alleged to be forced to share their knowledge with competitors through the bidding away of employees who are privy to their secrets. This may well be a common practice, but if employees benefit from access to saleable information about secrets, they would be willing to work more cheaply than otherwise.

Møen (2005), Magnani (2006) and Maliranta, Mohnen and Rouvinen (2009) found that employers capture much of the skills spillovers to others by paying R&D workers less early in their careers; later employers pay higher wages to reflect the valued added by the human capital that these R&D recruits bring.

Andersson, Freedman, Haltiwanger, Lane and Shaw (2009) found that software firms in markets with large returns from product breakthroughs pay higher starting salaries to attract star employees. Accounting and legal firms and sports teams also pay more to recruit and retain top performers (Wezel, Cattini and Pennings 2006; Campbell, Ganco, Franco and Agarwal 2012; Rosen 2001).

Employers balance skills and knowledge acquisition through recruitment with in-house development of skills and knowledge. Mason and Nohara (2010) did not find ‘any evidence’ that the external experience of scientists and engineers is any more valuable to firms than is their internal experience.

Firms will pay a wage that equalises the returns on skills acquisition through recruitment with the returns on investing in in-house training. This equalisation of the returns between internal and external sources of skills and knowledge is consistent with competition penalising firms that pay too much or too little for inputs and rewarding entrepreneurs for superior alertness to new opportunities.

The option value of founding or working for a spin-off is also captured in the wages of R&D workers (Kitch 1980; Pakes and Nitzan 1983). Central to a spin-off is carrying on with new ideas and prototypes that the leaving employees judged to be under-valued by the parent firm and they want to build on at their own entrepreneurial risk (Klepper and Sleeper 2005; Klepper 2007).

Large firms are known for incremental innovations while small firms pioneer product break-troughs whose prospects were not as well valued inside large hierarchies (Baumol 2002, 2005; Audretsch and Thurik 2003). Many R&D spin-offs continue with emerging ideas and products that their parents were in the process of abandoning (Hellmann 2007; Chatetterjee and Rossi-Hansberg 2012; Klepper and Thompson 2010). One reason is the developing idea does not fit in with the risk profile and skills of the parent so many spin-offs are friendly (Fallick, Fleischman, and Rebitzer 2006; Chen and Thompson 2011).

Founding or working for a spin-off or start-up is a real prospect. In many innovative industries, upwards of 20 percent of new entrants are intra-industry spinoffs; these firms outperform other new entrants and disproportionately populate the ranks of industry leaders (Klepper and Thompson 2010).

The evidence of large firms spawning more entrepreneurs among scientists and engineers is mixed. Large parent firm size reduces both the probability of leaving, and more so, the probability of leaving to found a spin-off (Andersson and Klepper 2013; Sørensen 2007; Sørensen and Philipps 2011). Spin-offs are less likely from large parents because more of the skills and experience accumulated within large firms is firm-specific human capital and is therefore less mobile into a spin-off.

Scientists and engineers who worked in small firms are ‘far more likely’ to found a spin-off than are their large firm counterparts, and their spin-offs are more likely to be a success (Elfenbein, Hamilton and Zenger 2010; Sørensen and Phillips 2011). Working in smaller firms allows spin-off minded employees to gain the balance and wide array of technical knowledge and management skills that are prized in entrepreneurship (Elfenbein, Hamilton and Zenger 2010; Lazear 2004, 2005).

Working in managerial hierarchies works against founding a spin-off. Tåg, Åstebro and Thompson (2013) found that conditional on size, employees in firms with more layers of management are less likely to enter entrepreneurship, self-employing or quit to go to another firm. They attributed this to the employees in firms with fewer management layers developing a broader range of skills; multiple layers of management offering more promotion opportunities; and skill mismatch is less problematic in more hierarchical firms because there are more chances to move. The higher pay and better career opportunities in larger firms reduces job quits, and with it, skills spillovers and spin-offs.

The wage adjustments for current skills and knowledge transfer opportunities to future employers, start-ups and spin-offs are large. New science graduates accept 20 per cent less in starting pay to work where they can publish more in their own names (Stern 2004).

Scientists and engineers working in R&D accept 20 per cent less pay than other scientists and engineers who work in technical and managerial occupations to secure this more interesting work (Dupuy and Smits 2010). Gibbs (2006) suggested that the U.S. Department of Defense is able to recruit and retain engineers and scientists on low pay because they offer work on some of the most advanced technical research in the world.

Employers who pay full value in wages, share options, learning and R&D opportunities in exchange for the labour and human capital of employees are not benefiting from a skills spillover.

The evidence just reviewed identifies market processes that minimise skills spillovers from large R&D firms to spin-offs. Large firms train their employees in skills that are more often firm-specific and adjust wages to account for the career opportunities that might arise from on-the-job training that is more mobile. The employees of larger firms have longer job tenures in part because their human capital is less mobile.

Zombie lending and lower Japanese productivity growth

The low Japanese productivity growth throughout the 1990s could have been the result of subsidies to inefficient firms and declining industries both directly and through a banking system rolling over loans in arrears to insolvent firms.

This policy is known as zombie lending, and it lowered productivity because higher cost firms kept producing a greater share of Japanese output than would otherwise have been the case (Hayashi and Prescott 2003; Ahearne and Shinada 2005).

  • Zombie firms are insolvent firms often propped up with new loans and loan rollovers from Japanese banks.
  • Zombie banks are insolvent banks propped up with loans from the central bank and by lax regulatory inspections of their weak loan portfolios and lack of adequate capital.

Japan’s economic policies have until recently kept insolvent banks operating, further encouraging zombie lending, which impeded the flow of capital to the more efficient firms.

The competitive process where zombies shed workers and lose market share was thwarted. The Japanese authorities subsidised insolvent banks and firms and provided credit to some firms and not to others (Prescott 2002; Hayashi and Prescott 2002; Caballero et al. 2005; Hoshi and Kashyap 2004).

The pervasiveness and long-term persistence of zombie lending as a shock to Japanese productivity growth cannot be understated. As Kashyap noted:

The government allowed even the worst banks to continue to attract financing and support their insolvent borrowers

By keeping these unprofitable borrowers alive, banks allowed the zombies to distort competition throughout the rest of the economy.

Caballero et al. (2008) estimated that 30 per cent of all publicly traded Japanese manufacturing, construction, real estate, retail, wholesale, and service sector firms were on life support from banks in the early 2000s, and that most large Japanese banks only complied with capital standards because regulators were lax in their inspections.

The percentage of zombies hovered between 5 and 15 per cent up until 1993 and rose sharply over the mid-1990s to exceed 25 per cent for every year after 1994 (Caballero et al. 2008).

Figure 1: Prevalence of Firms Receiving Subsidized Loans in Japan

Source: Caballero et al. (2008) Zombie Lending and Depressed Restructuring in Japan. American Economic Review.

Zombie lending is a more serious problem for Japanese non-manufacturing firms than for manufacturing firms (Caballero et al. 2008). Small and medium size firms were also major beneficiaries of zombie lending.

Zombie lending also discourages new investments that increase Japanese productivity, encourages inefficient firms to avoid making the decisions necessary to raise their profitability, and impedes the solvent Japanese banks from finding good lending opportunities (Caballero et al. 2008; Sekine et al. 2003). As Kashyap noted:

Usually when an industry is hit by a bad shock, many firms exit… In Japan, firms never exited. Given that they never exited, it is not surprising that new firms weren’t created.

Under normal conditions, higher cost firms would go bankrupt and be replaced by new and better ideas and firms. Instead, firms that were more efficient than the zombie firms tended to exit industries because their demise does not require the banks to acknowledge large bad loans. This exit of the firms of intermediate efficiency rather than the exit of the least efficient firms dragged productivity down even further (Nishimura et al. 2005; Okana and Horioka 2008). New Zealand in the 1970s and in the early 1980s also had a range of policy measures that supported high-cost firms and declining industries.

When bankrupt firms can stay in business, they retain workers who otherwise would be willing to work for lower wages at a healthy firm and depress market prices for their products. Low prices and high wages reduce the profits that more productive firms can earn which discourages entry and investment.

The creation of new jobs is a measure of industry dynamism. In manufacturing, which suffered the least from the zombie problem, job creation hardly changed from the early 1990s to the late 1990s. In contrast, there was a large decline in job creation in the non-manufacturing sectors, particularly in construction (Caballero et al. 2008; Hoshi 2006; Caballero et al. 2008).

There was less restructuring of employment and market shares in favour of the more productive firms. The gap in productivity growth between the Japanese manufacturing and non-manufacturing sectors more than doubled over the 1990s (Caballero et al. 2008).

Japanese R&D spending has also slowed down significantly since the start of the 1990s (Comin forthcoming). The gap in the rate of computer adoption between Japan and USA also increased in the 1990s. The speed of diffusion of new technologies slowed to the point that South Körea has now surpassed Japan in the diffusion of computers and the Internet (Comin forthcoming).

Over the 1990s, there were ten massive fiscal packages to maintain employment and investment. Much of this additional Japanese government spending was on public works and other projects whose social payoffs have been queried by independent observers. The consumption tax was increased from 3 per cent to 5 per cent in 1997. There were two rounds of temporary tax cuts – for 2 years only.

Japan pursued economic policies in response to a recession that stifled total factor productivity by providing bad incentives to the private sector.

null

The unproductive firms depressed Japanese productivity because they competed for labour and capital that could have been used by the more productive firms. Zombie lending allowed many firms to stay in business long after the monetary policy changes that uncovered their unprofitable petered out. The diversion of resources to these insolvent firms prevented a productivity recovery. The lack of a productivity recovery depressed wages, incomes and consumer demand.

The zombie lending and fiscal packages compounded the 1990 monetary contraction into the highly persistent shocks that were required to be able to depress Japanese productivity growth for more than a decade.

More and more resources were tied up in high cost firms and in declining industries. This was rather than be reallocated to more productive uses by the normal market processes of relative price and wage changes, free entry and profit and loss.  Kashyap argues that:

The experience in Japan definitely shows that providing subsidized credit to dying firms will be costly over time. Keeping an industry from restructuring only delays the day of reckoning and raises the cost substantially

…There are many examples besides Japan where people fail to recognize that it is dangerous to keep people attached to businesses that are fundamentally unprofitable

The massive Japanese government investments have echoes of the ‘Think Big’ energy investments in New Zealand in the late 1970s.

The productivity impact of ‘Think Big’ was suspect. In addition, state-owned enterprises offering a net return of zero to the Crown in the 1980s has Japanese parallels.

The propping up of high cost state owned and private firms in the 1970s and 1980s in New Zealand helped to depress productivity growth rates. State-owned enterprises offered a net return of about zero to the taxpayer, even as recently as last year in New Zealand.

More and more resources were tied up in New Zealand in the high cost firms and declining industries than be reallocated to more productive uses by the market processes of price and wage changes, free entry and profit and loss. The lack of productivity growth depressed wages, incomes and consumer demand in New Zealand.

The productivity based explanations for the slumps in New Zealand from 1974 to 1992 and in Japan from 1990 to 2003 have a number of common threads.

Thomas Babington Macaulay on the early days of The Great Fact

If any person had told the Parliament which met in terror and perplexity after the crash of 1720 that in 1830 the wealth of England would surpass all their wildest dreams, that the annual revenue would equal the principal of that debt which they considered an intolerable burden, that for one man of £10,000 then living there would be five men- of £50,000, that London would be twice as large and twice as populous, and that nevertheless the mortality would have diminished to one-half what it then was, — that the post-office would bring more into the exchequer than the excise and customs had brought in together under Charles II.  - Thomas B. Macaulay

Image

Super-Economy: Dynamic America, Poor Europe


via Super-Economy: Dynamic America, Poor Europe.

The role of the introduction of a five day working week in Japan’s Lost Decade

When I lived in Japan between 1995 and 1997, they are undergoing the transition from a six-day week to a five day week. At the time, workers at my University had to show up on Saturday morning. They then went home at lunchtime. Saturday morning at the office was phased out a few years later.

In explanations of the Lost Decade of growth in Japan dating from the early 1990s, with the exception of Ed Prescott, the explanation that the Japanese simply chose to produce less per worker over the course of the 1990s does not figure highly.

The Japanese working week was reduced by law from 48 to 44 hours per week in 1988 and further reduced by the same labour standards law to 40 hours per week from 1993 (Prescott 1999; Hayashi and Prescott 2002). The Japanese stopped routinely working on Saturdays over the 1990s. The number of national holidays was increased by three and an extra day of annual leave was also prescribed by law.

Figure 1 shows this regulatory change about the length of the standard working week that started in 1987 was followed by a sharp drop in hours worked per working per working age Japanese over the period 1988 to 1993. The Japanese working age population is defined as those aged 20 to 69 (Hayashi and Prescott 2002).

Figure 1: Weekly hours worked per Japanese aged 20 to 69, 1970-2000

Source: Hayashi and Prescott 2002.

The regulatory process to end the standard six day working week in Japan straddled the start of the Lost Decade. This major change in the regulation of the supply of labour per week in the number of hours worked and the stagnation of GDP growth soon after could be more than a coincidence (Prescott 1999; Hayashi and Prescott 2002).

More employment did not fill the short-fall in weekly labour supply per worker after the introduction of the 44 hour week and then the 40 hour week in Japan. Many offices and factories closed on Saturday rather than employ more to make up the hours. The regulatory change was a clear cut constraint on the length of the working week that was hard to get around because of the need to recruit a separate set of workers to come in on Saturday afternoon and then all day Saturday.

During the transition to a five day working week, Japanese real GDP growth should slow down because output levels must taper during a transitional period because one day per week less in labour is supplied in production and capital is being worked for one day a week less than before (Prescott 1999; Hayashi and Prescott 2002).

Output per working age person depends on capital-labour ratios, on hours worked per week and on changes in total factor productivity due to factors such as technological progress and changes in institutions and economic policies.

The effects of the change in the length of the working week on output per working age Japanese will persist for a significant time because investment plans and the capital stock must also adjust to a shorter working week. This is another example of a highly persistent shock that can partly account for the Lost Decade. As Prescott (1999) observed:

Given the change in Japanese law and the resulting drop in normal market hours, growth theory predicts the almost stagnant output of the Japanese economy in the 1990s. This reduction in market hours lowered the marginal product of capital, making investment unprofitable.

Given the lack of profitable domestic investment opportunities, the Japanese began saving by investing abroad. This explains Japan’s large trade surpluses

…The Japanese economy in the 1990s is not as depressed as the U.S. economy was in the 1930s. Market hours in Japan in the 1990s have fallen only half as much as market hours fell in the United States during the Great Depression.

More importantly, the reduction in market hours in Japan in the 1990s was the stated objective of policy.

The reduction in weekly hours worked will also reduce the working week of capital because labour and capital are usually complementary inputs. The reduced length of the working week will see some existing capital producing less, some capital will go spare, and the rate of wear and depreciation will fall.

The drop in weekly hours worked will lower the marginal productivity of existing and new capital which will make new capital investments in Japan less profitable than before. Net investment will be less while the Japanese capital stock is adjusting down to the reduced working week for capital and labour.

Measured total factor productivity will fall because of an under-utilisation of a capital stock that is now larger than required for the available labour force. Net investment will decline by a large amount because investment demand is a small yearly addition to the capital stock.

For example, if annual investment demand is 5 per cent of the capital stock, and the desired capital stock becomes 1 per cent smaller than previous, annual net investment will fall 20 per cent. GDP growth will resume at the trend rate once the lower level of output per working age person is reached.

For those that still doubt, consider the contrary, what would you expect to happen in your country moved from five day week before day working week? Do you expect workers to produce as much as before? Britain was on a three day working week during the coal miners’ strike. As expected, output fell because the working week was shorter.

The main gap in the English language literature about the reduction in the working week in Japan is a lack of publications I can find by Japanese economists discussing what predictions of a made about the likely consequences for output, investment and productivity before the reduction in the length of working week was legislated. Did the reduction in the length of the working week in Japan turn out as planned and predicted before it was implemented?

France introduced a 35 hour week some years ago. Although there were various options for over time, albeit strictly regulated, a uniform prediction was that the 35 hour week would reduce productivity. The new workweek was phased in slowly, with large firms adopting it in February 2000 and smaller firms doing so only in January 2002.

French employees were expected to bear only a small part of the cost of the working-time reduction, continuing to earn roughly the same monthly income – in line with the unions’ slogan ’35 hours pays. To ease that transition, the law reduced the overtime premium for small firms and increased their annual limit on overtime work compared with large firms.

The reduction in the length of the French working week failed as work sharing strategy and reduced productivity. This was a fair summary by the IMF:

The 35-hour workweek appears to have had a mainly negative impact. It failed to create more jobs and generated a significant—and mostly negative—reaction both from companies and workers as they tried to neutralize the law’s effect on hours of work and monthly wages.

While it cannot be ruled out that individuals who did not change their behaviour because of the law became more satisfied with their work hours, simple survey measures do not show increased satisfaction.

Between 1997 and 2000, Quebec reduced its standard workweek from 44 to 40 hours to stimulate jobs growth – the old work sharing ideal. The Quebec policy contained no suggestion or requirement that employers provide wage increases to compensate workers for lost hours.

Despite a 20% reduction among full-time workers in weekly hours worked beyond 40, the policy failed to raise employment at the provincial level or within industries. If anything, there were job losses.

Japan was the only case where a reduction in the length of the working week met with wide approval by the public and people simply stopped working on Saturdays. The law succeeded simply because it did but it was designed to do: reduce the number of days existing workers worked. Japan was undergoing mild deflation at the time, so the need to reduce wages was minimal.

Annual hours worked per employed Japanese has continued to slowly taper down since the late 1990s, which may be a further explanation of its continual slow growth.

David Andolfatto wrote a nice paper explaining the consequences for the financial and monetary sectors of this reduction in the length of the Japanese working week:

  • a steady decline in bank lending;
  • the money multiplier declines;
  • nominal interest rates that are close to zero; and
  • massive infusions of liquidity by the Bank of Japan that seem to have no effect at all.

In his analysis, David Andolfatto referred generally to a productivity slowdown as discussed by Prescott rather than to the specifically to the reduction in the length of the Japanese working week. Nothing detracts in his analysis, as Andolfatto said, that Japan has a problem: lagging productivity growth and as Andolfatto concluded:

…monetary and fiscal policies, or reforms directed exclusively at the banking sector, are unlikely to re-establish productivity growth. What is likely needed are economy-wide reforms that enhance the willingness and ability of individuals to adopt potentially disruptive technological advancements and work practices.


Did the World Bank just solve the puzzle of low NZ growth relative to Australia?

The World Bank published a major 300 odd page report that discussed puzzles of economic growth around the world included a chapter on New Zealand’s slow economic growth relative to Australia.

The World Bank publication is copyrighted 2015, so I assume that it has been published very recently. However, the data analysis in the chapter on New Zealand stop in 2002.

The conclusions of the World Bank with regard to the emergence of the trans-Tasman income gap were as follows:

The extent of economic freedom—as determined by propelling institutions—evolved in a similar manner in both countries.

The small differences in propelling institutions in both countries mostly netted out and as such cannot account for the differences in economic performance.

One exception was the fiscal position of the state—a rise in public expenditure after the first oil crisis entailed increased tax burdens in both countries.

A particularly sharp rise in taxation in New Zealand (in comparison to Australia) occurred during the country’s second downturn.

Differences in the size of the public sector figure prominently in the analysis of the World Bank of the emergence of the trans-Tasman income gap. The measure by the World Bank of the size of the public sector in New Zealand and Australia is reproduced below – its figure 3.3.

Figure 3.3 Government expenditure in Australia and New Zealand, 1970–2002

In particular, the World Bank was concerned about the rapid growth in the size of the public sector in New Zealand while the size of the public sector was shrinking in Australia:

In 1977–82 Australia’s government expenditure rose more slowly than that of New Zealand (and in 1975–80 Australia’s expenditure was smaller than New Zealand’s by 13 percent of GDP.

Then, as relative economic growth declined in New Zealand, between 1987 and 1990 public expenditure increased by around 5 percent of GDP from the 1982–86 level. In the meantime, public expenditure in Australia fell by 4 percent of GDP.

As a result, the difference in the general government expenditure level between New Zealand and Australia increased to over 18 percent of GDP in 1987–90.

After 1990 and until 2002 government spending in New Zealand decreased steadily—from approximately 44 percent of GDP in 1990 to roughly 30 percent of in 2002.

In Australia this expenditure was maintained at an average of 25 percent of GDP over the same period (see figure 3.3 with highlighted periods of significant increases of government expenditures in New Zealand).

A spike in the size of state sector in the 1980s may explain a delay in productivity growing rapidly again, but the state sector in New Zealand is now smaller.

Indeed, figure 3.3 above shows that the public sector in New Zealand as measured by general government expenditure has fallen by a quarter in size, by 10 percentage points of GDP in a matter of seven years between 1990 and 1996. There should be rapid growth because of the greatly reduced crowding out by the state sector but that rapid growth is not there.

Figure 2 shows that GDP growth per working age New Zealander resumed at its trend rate of 2% after 1992. This resumption of growth was in conjunction with the decline in the size of public sector tax burden rather than after it. Figure 2 shows that there was no significant growth in real GDP per working age New Zealander from 1974 to 1992. New Zealand lost almost two decades of productivity growth. Real GDP per New Zealander aged 15-64 on a purchasing power parity basis dropped from equality with Australia up until 1974 to a 30 per cent gap by 1992.

Figure 2: Real GDP per New Zealander and Australian aged 15-64, converted to 2013 price level with updated 2005 EKS purchasing power parities, 1956-2012

Source: Computed from OECD Stat Extract and The Conference Board, Total Database, January 2014, http://www.conference-board.org/economics

There was no growth rebound when the burden of an oversized public sector was lifted. That is the greater puzzle. The World Bank did not address that greater puzzle. If there is a global pool of useful technological knowledge accessible at a low cost by suitably prepared people, what stops New Zealand from using this knowledge to grow faster until it catches-up with Australia and the USA?

Another puzzle for the World Bank is that it is using general government expenditure estimates by the OECD.

When tax revenue as a percentage of GDP is used to measure the size of the public sector and the burden on private sector initiative, figure 3 shows that the tax burden in the two countries is not that different and is in the low 30% range, not the 40% plus range as is suggested by the general government expenditure data in Figure 3.3.

Figure 3: tax revenue as a percentage of New Zealand and Australian GDP, 1965-2011

Source: OECD Stats

There are no 14 point gaps in tax burdens in figure 3 as suggested in the World Bank’s analysis. This is because the World Bank’s using general government expenditure shown in its figure 3.3 reproduced above.

A major conclusion about the causes of New Zealand’s poor growth performance in the last few decades should be robust to different measures of the size of the public sector, but it is not.

Economic reforms returned real GDP growth per New Zealander aged 15-64 from no growth from 1974 to 1992 to the previous two per cent trend rate from 1993. There was no sustained productivity growth rebound beyond 2 per cent growth a year for New Zealand to recover the lost ground in the 1980s and 1970s. That is the great puzzle that the World Bank did not address, much less solve.

The role of news in real business cycles

Revisions in investor beliefs about productivity prospects can partly account for business expansions and contractions. If favourable news about future technological opportunities can seed a boom today in consumption and investment before the actual technological improvement arrives and is realised, news that future productivity growth may not be as good as was previously expected can induce a recession without any actual change in productivity ever occurring.

Investors build in anticipation, starting new projects and recruiting more staff. Their forecasts can turn out to be too optimistic. When entrepreneurial expectations of future productivity are revised, investment demand can fall because of an excess in capital accumulation – recent investments were made under more optimistic beliefs about productivity (Beaudry and Portier 2004).

Investment demand must be muted for a time until the excess capital accumulation is brought into use, refitted or scraped. There also will be layoffs and a lull in recruitment. Job search strategies must also change as job seekers redirect their careers in light of the news about their revised prospects in different firms, industries and competing occupations.

The optimism and pessimism of investors are rational profit-seeking responses to new entrepreneurial knowledge. Profit expectations reflect consumer preferences, resource constraints and technological factors as they exist and are forecast to change and actual and forecasted opportunities and constraints in the investment sector. Entrepreneurs are dynamic risk takers who profit from anticipating shifts in consumer demand, input costs and technology.

Recessions and booms can arise due to the challenges facing entrepreneurs in forecasting the uncertain and ever-changing future demand for new capital that is implied by their forecasts of consumer demand and technological opportunities as Beaudry and Portier (2004) explain:

The view that recession and booms may arise as the result of investment swings generated by agents’ difficulties to properly forecast the economy’s need in terms of capital has a long tradition in economics.

For example, this difficulty was seen by Pigou as being an inherent feature of any economy with technological progress.

As  emphasized in Pigou (1926), when agents are optimistic about the future and decide to build up capital in expectation of future demand then, in the case where their expectations are not met, there will be a period of retrenched investment which is likely to cause a recession.

Revisions in entrepreneurial beliefs and investment plans can be required when new information is uncovered (Beaudry and Portier 2004; Sill 2009). There can be lulls in investment demand following these revisions to entrepreneurial forecasts leading to recessions. As Pigou noted in 1927:

The varying expectations of business men … constitute the immediate cause and direct causes or antecedents of industrial fluctuations

Japan and Finland in the 1990s

Source: Edward Prescott

Image

Interview with Robert Lucas on the global financial crisis and the great recession

Was the 1990s in the USA a boom period or business as usual?

Source: Edward Prescott

Image

Previous Older Entries Next Newer Entries

David Andolfatto

Celebrating humanity's flourishing through the spread of capitalism and the rule of law

Monetary Non-Neutrality

Celebrating humanity's flourishing through the spread of capitalism and the rule of law

Reason Magazine

Celebrating humanity's flourishing through the spread of capitalism and the rule of law

Coyote Blog

Celebrating humanity's flourishing through the spread of capitalism and the rule of law

Thoughts from the North

Celebrating humanity's flourishing through the spread of capitalism and the rule of law

Fardels Bear

A History of the Alt-Right

Vincent Geloso

Econ Prof at George Mason University, Economic Historian, Québécois

Bassett, Brash & Hide

Celebrating humanity's flourishing through the spread of capitalism and the rule of law

Truth on the Market

Scholarly commentary on law, economics, and more

The Undercover Historian

Beatrice Cherrier's blog

Matua Kahurangi

Celebrating humanity's flourishing through the spread of capitalism and the rule of law

Temple of Sociology

Celebrating humanity's flourishing through the spread of capitalism and the rule of law

Velvet Glove, Iron Fist

Celebrating humanity's flourishing through the spread of capitalism and the rule of law

Why Evolution Is True

Why Evolution is True is a blog written by Jerry Coyne, centered on evolution and biology but also dealing with diverse topics like politics, culture, and cats.

NoTricksZone

Celebrating humanity's flourishing through the spread of capitalism and the rule of law

Homepaddock

A rural perspective with a blue tint by Ele Ludemann

Kiwiblog

DPF's Kiwiblog - Fomenting Happy Mischief since 2003

The Dangerous Economist

Celebrating humanity's flourishing through the spread of capitalism and the rule of law

Watts Up With That?

The world's most viewed site on global warming and climate change

The Logical Place

Tim Harding's writings on rationality, informal logic and skepticism

Doc's Books

A window into Doc Freiberger's library

The Risk-Monger

Let's examine hard decisions!

Uneasy Money

Commentary on monetary policy in the spirit of R. G. Hawtrey

Barrie Saunders

Thoughts on public policy and the media

Liberty Scott

Celebrating humanity's flourishing through the spread of capitalism and the rule of law

Point of Order

Politics and the economy

James Bowden's Blog

A blog (primarily) on Canadian and Commonwealth political history and institutions

Science Matters

Reading between the lines, and underneath the hype.

Peter Winsley

Economics, and such stuff as dreams are made on

A Venerable Puzzle

"The British constitution has always been puzzling, and always will be." --Queen Elizabeth II

The Antiplanner

Celebrating humanity's flourishing through the spread of capitalism and the rule of law

Bet On It

Celebrating humanity's flourishing through the spread of capitalism and the rule of law

History of Sorts

WORLD WAR II, MUSIC, HISTORY, HOLOCAUST

Roger Pielke Jr.

Undisciplined scholar, recovering academic

Offsetting Behaviour

Celebrating humanity's flourishing through the spread of capitalism and the rule of law

JONATHAN TURLEY

Res ipsa loquitur - The thing itself speaks

Conversable Economist

In Hume’s spirit, I will attempt to serve as an ambassador from my world of economics, and help in “finding topics of conversation fit for the entertainment of rational creatures.”

The Victorian Commons

Researching the House of Commons, 1832-1868

The History of Parliament

Articles and research from the History of Parliament Trust

Books & Boots

Reflections on books and art

Legal History Miscellany

Posts on the History of Law, Crime, and Justice

Sex, Drugs and Economics

Celebrating humanity's flourishing through the spread of capitalism and the rule of law

European Royal History

Exploring the Monarchs of Europe

Tallbloke's Talkshop

Cutting edge science you can dice with

Marginal REVOLUTION

Small Steps Toward A Much Better World

NOT A LOT OF PEOPLE KNOW THAT

“We do not believe any group of men adequate enough or wise enough to operate without scrutiny or without criticism. We know that the only way to avoid error is to detect it, that the only way to detect it is to be free to inquire. We know that in secrecy error undetected will flourish and subvert”. - J Robert Oppenheimer.