Britain has led most of the rich world in job creation, but badly lagged in productivity. on.wsj.com/1IiEjli http://t.co/URIFuFS9Il—
Sudeep Reddy (@Reddy) May 07, 2015
Where has all the productivity gone?
11 May 2015 Leave a comment
in business cycles, economic growth, Euro crisis, fiscal policy, global financial crisis (GFC), great depression, great recession, macroeconomics Tags: labour productivity, prosperity and depression, TFP
The sick men of Europe? British and Irish unemployment rates, 1956–2013
09 May 2015 Leave a comment
in economic growth, economic history, great depression, job search and matching, labour economics, labour supply, macroeconomics, unemployment Tags: British economy, Celtic Tiger, Ireland, prosperity and depression, sick man of Europe, unemployment rates

Source: OECD StatExtract
Ireland and Britain justly earned the name the sick man of Europe in the 1980s. Irish unemployment was in the mid teens much of the 1980s because the Irish economy was in a great depression from 1973 to 1992.
Unemployed people are defined as those who report that they are without work, that they are available for work and that they have taken active steps to find work in the last four weeks. The ILO Guidelines specify what actions count as active steps to find work; these include answering vacancy notices, visiting factories, construction sites and other places of work, and placing advertisements in the press as well as registering with labour offices.
Two booms, two depressions: British and Irish real GDP detrended, 1955–2013
07 May 2015 1 Comment
in business cycles, economic growth, economic history, entrepreneurship, global financial crisis (GFC), great depression, macroeconomics Tags: British disease, British economy, Celtic Tiger, Ireland, prosperity and depression, sick man of Europe
Figure 1: Real GDP per British and Irish aged 15-64, converted to 2013 price level with updated 2005 EKS purchasing power parities, 1955-2013

Source: Computed from OECD Stat Extract and The Conference Board, Total Database, January 2014, http://www.conference-board.org/economics
Figure 2 detrends British real GDP growth since 1955 by 1.9% and Irish real GDP growth by 3.6%. The US real GDP growth in the 20th century is used as the measure of the global technological frontier growing at trend rate of 1.9% in the 20th century. The Irish economy is more complicated story because its growth rate in figure 2 was detrended at a rate of 3.6% because it was catching up from a very low base. Trend GDP growth per working age Irish for 1960-73 was 3.6 per cent (Ahearne et al. 2006).
Figure 2: Real GDP per British and Irish aged 15-64, converted to 2013 price level with updated 2005 EKS purchasing power parities, 1.9 per cent detrended UK, 3.6% detrended Ireland, 1955-2013

Source: Computed from OECD Stat Extract and The Conference Board, Total Database, January 2014, http://www.conference-board.org/economics
A flat line in figure 2 indicates growth at 1.9% for that year. A rising line in figure 2 means above-trend growth; a falling line means below trend growth for that year.
In the 1950s, Britain was growing quickly that the Prime Minister of the time campaigned on the slogan you never had it so good.
By the 1970s, and two spells of labour governments, Britain was the sick man of Europe culminating with the Winter of Discontent of 1978–1979. What happened? The British disease resulted in a 10% drop in output relative to trend in the 1970s, which counts as a depression – see figure 2 .
Prescott’s definition of a depression is when the economy is significantly below trend, the economy is in a depression. A great depression is a depression that is deep, rapid and enduring:
- There is at least one year in which output per working age person is at least 20 percent below trend; and
- there is at least one year in the first decade of the great depression in which output per working age person is at least 15 percent below trend; and
- There is no significant recovery during the period in the sense that there is no subperiod of a decade or longer in which the growth of output per working age person returns to rates of 2 percent or better.
The British disease in the 1970s bordered on a depression. There was then a strong recovery through the early-1980s with above trend growth from the early 1980s until 2006 with one recession in between in 1990. So much for the curse of Thatchernomics?
Figure 1 suggests a steady economic course in Ireland until the 1990s with a growth explosion growth with the Irish converged on British living standards up until the global financial crisis.
Figure 2 shows the power of detrending GDP growth and why Ireland was known as the sick man of Europe in the 1970s and 1980s with unemployment as high as 18% and mass migration again. The Irish population did not grow for about 60 years from 1926 because of mass migration.
Figure 2 shows that real GDP growth per working age Irish dropped below its 3.6 per cent trend for nearly 20 years from 1974 , but more than bounced back after 1992. The deepest trough was 18 per cent below trend and the final trough was in 1992 – see Figure 2.
The deviation from trend economic growth made the Irish depression from 1973 to 1992 comparable in depth and length to the 1930s depressions (Ahearne et al. 2006).
The Irish depression of 1973 to 1992 can be attributed to large increases in taxes and government expenditure and reduced productivity (Ahearne et al. 2006). There were two oil price shocks in the 1970s and many suspect Irish policy choices from 1973 to 1987.
There were three fiscal approaches: an aggressive fiscal expansion from 1977; tax-and-spend from 1981; and aggressive fiscal cuts from 1987 onwards. In the early 1980s, Irish CPI inflation at 21 per cent, public sector borrowing reached 20 per cent of GNP.
To rein in budget deficits, taxes as a share of GNP rose by 10 percentage points in seven years. The unemployment rate reached 17 per cent despite a surge in emigration. The rising tax burden raised wage demands, worsening unemployment. Government debt grew on some measures to 130 per cent of GNP in 1986 (Honohan and Walsh 2002).
From 1992, Ireland rebounded to resume catching-up with the USA. The Celtic Tiger was a recovery from a depression that was preceded by large cuts in taxes and government spending from the late 1980s (Ahearne et al. 2006). Others reach similar conclusions but avoid the depression word. Fortin (2002, p. 13) labelled Irish public finances in the 1970s and to the mid-1980s as a ‘black hole’.
Fortin (2002) and Honohan and Walsh (2002) disentangle the Irish recovery into a long-term productivity boom that had dated from the 1950s and 1960s, and a sudden short-term output and employment boom since 1993 following the late 1980s fiscal and monetary reforms.
Honohan and Walsh (2002) wrote of belated income and productivity convergence. The delay in income and productivity convergence came from poor Irish economic and fiscal policies in the 1970s and 1980s.
This was after economic reforms in the late 1950s and the 1960s that started a process of rapid productivity convergence after decades of stagnation and mass emigration; Ireland’s population was the same in 1926 and 1971. During the 1950s, up to 10 per cent of the Irish population migrated in 10 years.
In the 1990s, many foreign investors started invested in Ireland as an export platform into the EU to take advantage of a 12.5 per cent company tax rate on trading profits. Between 1985 and 2001, the top Irish income tax rate fell from 65 to 42 per cent, the standard company tax from 50 to 16 per cent and the capital gains tax rate from 60 to 20 per cent (Honohan and Walsh 2002).
What happened after the onset of the global financial crisis in Ireland and the UK are for a future blog posts.
British economic recoveries compared
03 May 2015 Leave a comment
in business cycles, global financial crisis (GFC), great depression, great recession, job search and matching, macroeconomics Tags: British economy, British general election, recessions and recoveries
Growth was good last year, will be okay in years to come. But overall? The slowest recovery in history #Budget2015 http://t.co/oMpkKpvIa1—
Fraser Nelson (@FraserNelson) March 18, 2015
The impact of the top tax rate in the depth and severity of the great depression
24 Apr 2015 Leave a comment
in business cycles, fiscal policy, great depression, macroeconomics, politics - New Zealand, politics - USA, public economics Tags: capital taxation, New Zealand, taxation and the labour supply, top tax rate

Source: Ellen McGrattan.
There were large differences in increases in the 1930s in the top marginal income tax rate between Sweden, the UK, France with Australia and New Zealand and between the USA and Canada and the rest as McGrattan explains:
These data show that there is a strong negative correlation, roughly −94%, between the change in the top income tax rates and the deviation in per capita real GDP relative to trend in 1933.

Has New Zealand been in deflation since 2012?
21 Apr 2015 Leave a comment
in global financial crisis (GFC), great depression, inflation targeting, macroeconomics, monetary economics Tags: CPI bias, deflation, inflation, monetary policy
All agree that the consumer price index (CPI) is biased and overstates inflation. In 1996, economists hired by the Senate Finance Committee estimated that the U.S. CPI overstates annual inflation by 1.1% (Boskin et al. 1996). That estimated CPI bias has not gotten smaller with time. It is now up to 1.5%, even 2%.
One of the rationales for the inflation target of the Reserve Bank of New Zealand of 0-2% was the 2% was to account for the consumer price index was biased upwards. Targeting 0% would lead to mild deflation when inflation was properly measured.
The main biases in the consumer price index everywhere come from how to handle changes in the quality of goods and services and how to deal with completely new goods and services.
I thought I might see what happened if I took this one and a half percentage point annual bias in the CPI estimated for the USA and adjusted the New Zealand CPI inflation rates available at the Reserve Bank of New Zealand’s website over the last 20 years or so with this number.

If these consumer price index bias adjustments are correct, and they are roughly correct, inflation came to a dead stop in New Zealand after the global financial crisis in 2008, spiked again, and then moved into deflation in 2012. If anything, there’s been a mixture of price stability and the deflation since 2012.
People get quite hot and bothered with deflation. The New Zealand economy has been in a deflationary phase since the beginning of 2012 but it is recently grown so quickly that it is referred to in the media as the rock-star economy.
Breathless journalism aside , fears of inflation are just a legacy of the great depression in the 1930s. The only depression where deflation was accompanied by mass unemployment was the Great Depression. Mild deflation with good growth is a common phenomena as Atkinson and Kehoe found:
Are deflation and depression empirically linked? No, concludes a broad historical study of inflation and real output growth rates.
Deflation and depression do seem to have been linked during the 1930s. But in the rest of the data for 17 countries and more than 100 years, there is virtually no evidence of such a link.
The role of unions in prolonging the Great Depression
20 Apr 2015 1 Comment
in business cycles, fiscal policy, great depression, labour economics, labour supply, macroeconomics, politics - USA, unemployment, unions Tags: capital taxation, FDR, Herbert Hoover, Leftover Left, Leo Ohanian, New Deal, union power, union wage premium, unionisation
Our friends on the left at the Economic Policy Institute were good enough to remind us of the link between rapid unionisation of the US labour market in the early and mid-1930s and the petering out of the recovery from the great depression. That recession within a depression is the Roosevelt recession.
New blog on Mind The Gap: on labour #unions and income #inequality
oxfamblogs.org/mindthegap/201… http://t.co/FyrOboCaRk—
Ricardo FuentesNieva (@rivefuentes) April 17, 2015
Harold Cole and Lee Ohanian analysed in depth this double-dip depression in the USA in a paper in the Journal of Political Economy titled “New Deal Policies and the Persistence of the Great Depression: A General Equilibrium Analysis” about 10 years ago:
The recovery from the Great Depression was weak… Real gross domestic product per adult, which was 39 percent below trend at the trough of the Depression in 1933, remained 27 percent below trend in 1939. Similarly, private hours worked were 27 percent below trend in 1933 and remained 21 percent below trend in 1939.
The weak recovery is puzzling because the large negative shocks that some economists believe caused the 1929–33 downturn—including monetary shocks, productivity shocks, and banking shocks—become positive after 1933. These positive shocks should have fostered a rapid recovery, with output and employment returning to trend by the late 1930s.
The focus of the paper by Cole and Ohanian in explaining the weak recovery – the double-dip depression in the 1930s – are the New Deal cartelisation policies designed to limit competition and increase labour bargaining power through extensive unionisation of workforce.

The recovery from the depths of the Great Depression was weak but real wages in several sectors rose significantly above trend despite mass unemployment.

The view that limiting competition in product markets and the labour market was essential for economic prosperity was influential in the 1920s and 1930s. Both FDR and Hoover believed high wages were the key to prosperity.
FDR’s recipe for economic recovery from the great depression when he came to office in 1933 was raising prices and wages and the promotion of unions:
Union membership rose from about 13 percent of employment in 1935 to about 29 percent of employment in 1939, and strike activity doubled from 14 million strike days in 1936 to about 28 million in 1937.
The result of this suppression of market competition and the encouragement of unions was real wages increase despite the weak recovery:
The coincidence of high wages, low consumption, and low hours worked indicates that some factor prevented labour market clearing during the New Deal.
The combination of government interference with competition and strong unions stifled the recovery from the great depression rather than speed it up as was the plan of FDR:
New Deal labour and industrial policies did not lift the economy out of the Depression as President Roosevelt had hoped.
Instead, the joint policies of increasing labour’s bargaining power and linking collusion with paying high wages prevented a normal recovery by creating rents and an inefficient insider-outsider friction that raised wages significantly and restricted employment.
Not only did the adoption of these industrial and trade policies coincide with the persistence of depression through the late 1930s, but the subsequent abandonment of these policies coincided with the strong economic recovery of the 1940s.

U.S. unemployment fell from 22.9% in 1932 to 9.1% in 1937, a reduction of 13.8%, but was back up to 13% by 1938. The Social Security payroll tax debuted in 1937 on top of tax increases in the Revenue Act of 1935. In 1937, the economy fell into recession again. Cooley and Ohanian argue that:
The economy did not tank in 1937 because government spending declined. Increases in tax rates, particularly capital income tax rates, and the expansion of unions, were most likely responsible.
The Great Depression in the USA was unique in the fact that it was so long and the recovery, so weak:
Total hours worked per adult in 1939 remained about 21% below their 1929 level, compared to a decline of 27% in 1933… Per capita consumption did not recover at all, remaining 25% below its trend level throughout the New Deal, and per-capita non-residential investment averaged about 60% below trend.
After 1933, productivity growth was rapid, the banking system was stabilized, deflation was eliminated and there was plenty of demand stimulus as the Fed more than doubled the monetary base between 1933 and 1939. As Lee Ohanian noted:
Depressions are periods of low employment and low living standards. The normal forces of supply and demand should have reduced wages, which would have lowered business costs and increased employment and output. What prevented the normal forces of supply and demand from working?
Central to the faltering of this recovery by 1937 was the regime change when the Supreme Court finally upheld revised laws promoting unionisation:
The downturn of 1937-38 was preceded by large wage hikes that pushed wages well above their NIRA levels, following the Supreme Court’s 1937 decision that upheld the constitutionality of the National Labor Relations Act. These wage hikes led to further job loss, particularly in manufacturing.
The "recession in a depression" thus was not the result of a reversal of New Deal policies, as argued by some, but rather a deepening of New Deal polices that raised wages even further above their competitive levels, and which further prevented the normal forces of supply and demand from restoring full employment.
Lee Ohanian argues that the defining characteristic of the Great Depression was this failure of real wages to fall in the face of mass unemployment:
The defining characteristic of the Great Depression is a substantial and chronic excess supply of labour, with employment well below normal, and real wages in key industrial sectors well above normal.
Policies of Hoover and of FDR of propping up wages and encouraging unions and work sharing were the most important factors in precipitating and prolonging the Great Depression. The Great Depression was the first time U.S. wages did not fall in that you were administered a period of significant deflation.
The manufacturing sector, where unions and the threat of unionisation was much stronger which was much harder hit initially than the agricultural sector both in terms of loss of jobs and wages not falling. The Great Depression did not start as an ordinary garden variety recession, as argued by Milton Friedman. It was immediately severe and sector specific with industrial production declining by about 35% between late 1929 and the end of 1930.

This decline in industrial production occurs before any banking crises. Despite this sector specific nature of the onset that Great Depression, monetary policy might have some role in explaining the start of the Great Depression but not in its prolongation:
any monetary explanation of the Depression requires a theory of very large and very protracted monetary non-neutrality. Such a theory has been elusive because the Depression is so much larger than any other downturn, and because explaining the persistence of such a large non-neutrality requires in turn a theory for why the normal economic forces that ultimately undo monetary non-neutrality were grossly absent in this episode.

Source: A different view of the Great Depression’s cause | VOX, CEPR’s Policy Portal.
Employment losses after recent financial crises
09 Apr 2015 Leave a comment
in business cycles, economic history, Euro crisis, global financial crisis (GFC), great depression, great recession, job search and matching, macroeconomics Tags: financial crises, global financial crisis, great recession, recessions and recoveries
@TimDuy @profsufi Compared to other financial crisis, this recovery is OK. http://t.co/eGU5lOxKnu—
Bill McBride (@calculatedrisk) December 24, 2014
After reading the annual reports of the Fed, Milton Friedman noticed the following pattern
16 Mar 2015 Leave a comment
in business cycles, great depression, macroeconomics, Milton Friedman, monetarism, monetary economics Tags: lags on monetary policy, monetary policy

.


Deflation and Depression: Is There an Empirical Link?
31 Jan 2015 Leave a comment
in budget deficits, business cycles, economic growth, Euro crisis, great depression, great recession, macroeconomics, monetary economics, politics - Australia, politics - New Zealand, politics - USA Tags: deflation, fiscal policy, liquidity traps, monetary policy, stabilisation policy
Deflation has a bad reputation. People blame deflation for causing the great depression in the 1930s. What worse reputation can you get as a self-respecting macroeconomic phenomena?
The inconvenient truth for this urban legend is empirical evidence of deflation leading to a depression is rather weak.
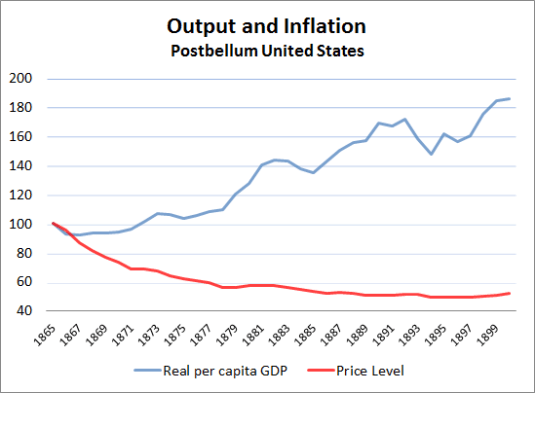
The most obvious is confounding evidence, is up until the great depression, deflation was commonplace. In the late 19th century, deflation coincided with strong growth, growth so strong that it was called the Industrial Revolution.
For deflation to be a depressing force, something must have happened in the lead up to the Great Depression to change the impact of deflation on economic growth.
Atkeson and Kehoe in the AER looked into the relationship between deflation and depressions and came up empty-handed.
Deflation and depression do seem to have been linked during the 1930s. But in the rest of the data for 17 countries and more than 100 years, there is virtually no evidence of such a link.
Deflation and Depression: Is There an Empirical Link?
Andrew Atkeson, and Patrick J. Kehoe, 2004.
Are deflation and depression empirically linked? No, concludes a broad historical study of inflation and real output growth rates. Deflation and depression do seem to have been linked during the 1930s. But in the rest of the data for 17 countries and more than 100 years, there is virtually no evidence of such a link.
View original post 1,842 more words
Paul Samuelson and Robert Lucas both agree that economists have solved the problem of economic depressions
24 Jan 2015 Leave a comment
in business cycles, fiscal policy, great depression, great recession, history of economic thought, macroeconomics, monetary economics, Robert E. Lucas Tags: Paul Samuelson, prosperity and depression, The fatal conceit, The pretence to knowledge


Recent Comments