Notice how productivity recovers but hours worked per working age adults does not.

via The Current Financial Crisis in Spain: What Should We Learn from the ….
Celebrating humanity's flourishing through the spread of capitalism and the rule of law
05 Jun 2015 Leave a comment
in business cycles, economic growth, economic history, great depression, macroeconomics Tags: great depression, growth accounting, real business cycles
Notice how productivity recovers but hours worked per working age adults does not.
via The Current Financial Crisis in Spain: What Should We Learn from the ….
04 Jun 2015 3 Comments
in economic growth, politics - New Zealand, Public Choice, public economics

Bill English’s 2015 New Zealand Budget foreshadows a $1.5 billion allowance in the 2017 budget for “modest tax cuts”. Any reasonable mock-up of these tax cuts, such as in table 1 using the numbers on the Treasury website for revenue losses for small tax changes show that Prime Minster Key is planning his own fistful of dollars in the lead up to the 2017 election.
Table 1: hypothetical 2017 National Party tax cuts, $1.5 billion
| Current tax rate | New tax rate | Revenue loss, static scoring |
Revenue loss, dynamic scoring |
| 33% | 31.5% | $323m | $274m |
| 30% | 27.5% | $388m | $329.4m |
| 17.5% | 16.5% | $505m | $429.3m |
| Trust tax 33% | Trust tax 31.5% | $135m | $129m |
| Company tax rate 28% | 27.5% | $113m | $90m |
| Total cost | $1.465b | $1251m |
No serious participant in public policy debate could suggest that tax cuts of the size in table 1 will not have incentive effects that will lead to growth in incomes and business profits. There will be offsetting tax revenue increases that make a more ambitious tax package possible in 2017.
The Treasury’s website on revenue losses forecasts that a 1% increase in wages growth will increase tax revenue by $300 million. A 1% increase in the growth rate of taxable business profits will increase tax revenues by $140 million again according to the Treasury. These are big differences.
Any sensible discussion of the 2017 tax cuts should be against a background of what is called dynamic scoring to use the American parlance.
When the NZ Treasury “scores” revenue losses from tax cuts on its website, its estimates of revenue changes assume no changes in behaviour. Dynamic scoring takes behavioural effects into account.
The Congressional Budget Office was recently required to use dynamic scoring when costing major tax policy proposals. New Zealand should follow this path.

Table 2 makes conservative assumptions about the behavioural effects of income tax cuts. I follow Mankiw, N. Gregory and Matthew Weinzierl “Dynamic Scoring: A Back-of-the-Envelope Guide,” Journal of Public Economics (September 2006): 1415-1433. They argue that, in the long run, about 17% of a cut in individual income taxes is recouped through higher economic growth. For a cut in company taxes, their figure is 50%. I assume 15% is recouped in this way for individuals, 20% for companies and 5% for trusts.
Table 2: hypothetical 2017 National Party tax cuts, $1.5 billion, dynamic scoring of revenue effects
| Current tax rate | New tax rate | Revenue loss static Scoring |
Revenue loss dynamic scoring |
| 33% | 31% | $430m | $366m |
| 30% | 27% | $465m | $395m |
| 17.5% | 16.5% | $505m | $429m |
| Trust tax 33% | Trust tax 31% | $180m | $171m |
| Company tax rate 28% | 27% | $225m | $180m |
| Total cost | $1.805b | $1.541b |
The $200-300 million in revenue increases from higher incomes and higher business profits incentivised by lower tax rates is not a trivial sum. It is enough on its own to cut one percentage point of the company tax rate. Spread around as in table 2, there are enough to knock another one-half of a percentage point of the top tax rate, the second top tax rate and the company tax rate. The $1.5 billion in tax cuts planned for 2017 will be neither modest in their size nor in their behavioural effects.
No budget should be published and no party in an election should assert that large changes in the tax system have no behavioural effects. Dynamic scoring makes a big difference to what scale of tax cuts are possible.
There are practical hurdles to dynamic scoring but static scoring has more important ones. The hurdles of dynamic scoring are:
Against that is dynamic scoring removes the bias against pro-growth policies in current budgetary scoring:
[A] theoretical advantage of accurate dynamic scoring is that it is not biased against pro-growth policies compared to the current conventional scoring method. By ignoring macroeconomic effects, the conventional method overstates the true budgetary cost of pro-growth policies, such as infrastructure investments, and understates the cost of anti-growth policies.
To close on some New Zealand politics, Prime Minister Key, who is known as the smiling assassin, overtook the Labour Party and the Greens on their left In the 2015 Budget by increasing welfare benefits for the first time since 1972 in real terms, and by a large amount ($25 a week), and also increasing family tax credits.
Prime Minister Key well then pivot to the right in 2017 with a fistful of dollars to firmly camp himself over both the centre-left in the centre-right to be re-elected for a fourth term against an increasingly hapless and out-manoeuvred opposition.
03 Jun 2015 Leave a comment
in economic growth, economic history, job search and matching, labour economics, labour supply, macroeconomics, unemployment Tags: Eurosclerosis, France, Germany, Italy
Figure 1: French, German and Italian unemployment rates, 1956 – 2013

Source: OECD StatExtract.
03 Jun 2015 Leave a comment
in business cycles, economic history, macroeconomics, monetary economics Tags: monetary policy, The Fed
02 Jun 2015 Leave a comment
in business cycles, economics of education, human capital, job search and matching, labour economics, labour supply, macroeconomics, occupational choice, unemployment Tags: education premium, graduate premium
Don't listen to naysayers. College is worth it, even for so-so students. nyti.ms/1JC1ZiN http://t.co/Wnr5BnwumM—
The Upshot (@UpshotNYT) April 24, 2015
31 May 2015 1 Comment
in economic growth, economic history, macroeconomics, politics - Australia, politics - New Zealand Tags: Australia, Canada, economic geography, endogenous growth theory, lost decades
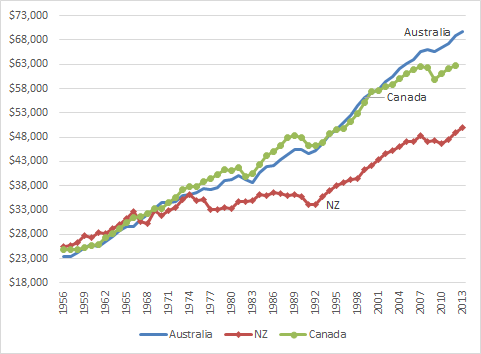
Figure 1 shows that Canada has been diverging from Australia in real GDP per working age person since the mid-1990s particularly since the global financial crisis.
Figure 1: Real GDP per New Zealander, Canadian and Australian aged 15-64, converted to 2013 price level with updated 2005 EKS purchasing power parities, 1956-2013
Source: Computed from OECD StatExtract and The Conference Board, Total Database, January 2014, http://www.conference-board.org/economics
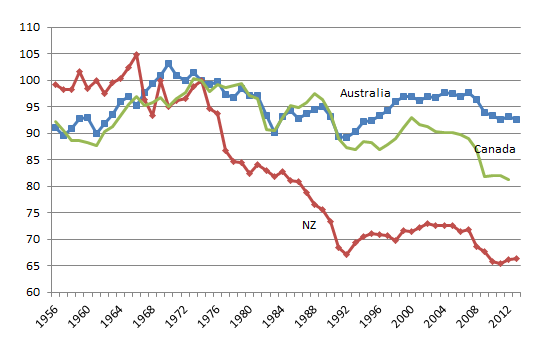
In common with New Zealand, Figure 2 shows that Canadian productivity has been in a pretty much along declines is about 1974, rarely catching up with any lost ground. Figure 1 shows that Canada used to be richer than Australia but is now poorer than Australia. Figure 2 is real GDP growth data detrended by the growth rate of the USA in the 20th century. A flat line in figure 2 is annual real GDP growth at 1.9%; a rising line is growth above 1.9%; a falling line is annual growth below 1.9% a year.
Figure 2: Real GDP per New Zealander, Canadian and Australian aged 15-64, converted to 2013 price level with updated 2005 EKS purchasing power parities, 1.9 per cent detrended, 1956-2013
Source: Computed from OECD StatExtract and The Conference Board, Total Database, January 2014, http://www.conference-board.org/economics
Figure 2 shows that Canadian productivity has been below trend for perhaps 30 years. There has been the occasional recovery but followed by a further decline. If Canadian labour productivity had grown at the same rate as the USA since 1974, labour productivity in Canada is something like 18% better.
Australia, as shown in figure 2, has neither caught up nor falling behind the USA in labour productivity for the entire post-war period since 1956. Canada has been falling behind its neighbour most markedly since the mid-1970s.
The proximate causes of the Canadian productivity gap with the USA have a familiar echo to New Zealand ears. Relative to the USA, Rao et al. (2006) and Sharp (2003) attributed the gap to less capital per worker, an innovation gap as shown by lower R&D expenditure, a smaller and less dynamic high technology sector, less developed human capital at the top end of the labour market, and more limited scale and scope economies.
These factors have been put forward, at one time or another, as the proximate causes of the New Zealand productivity gap with the USA. Identifying the barriers to higher Canadian productivity may offer fresh insights into removing similar productivity barriers in New Zealand.
Canada, New Zealand and Australia should be catching-up with the USA in productivity per capita because copying the global leader is cheaper than innovation. Canada, New Zealand and Australia all have the basics to do this: a market economy, the rule of law and openness to foreign technology and international trade.
Instead of asking why New Zealand is not catching-up with Australian productivity, further study of the lack of productivity catch-up of Australia and Canada with the USA may uncover subtle barriers to productivity growth with similarities in New Zealand.
The productivity decline in Canada is of interest in New Zealand because Canada certainly cannot blame remoteness because it borders the USA. Canada cannot blame lack of size because it is noticeably larger than Australia and certainly New Zealand.
31 May 2015 Leave a comment
in business cycles, economic growth, economic history, great depression, great recession, macroeconomics, politics - USA Tags: prosperity and depression
30 May 2015 Leave a comment
in economic growth, macroeconomics Tags: British economy, Margaret Thatcher
26 May 2015 Leave a comment
in business cycles, job search and matching, labour economics, labour supply, unemployment Tags: Australia, British economy, Canada
Source: OECD StatExtract

Source: OECD StatExtract
25 May 2015 1 Comment
in economic growth, economic history, economics of regulation, industrial organisation, job search and matching, labour economics, unions Tags: Employment Contracts Act, employment law, employment protection laws, employment regulation, labour market deregulation, lost decades, union power
The Council of Trade Unions scored something of an own goal in the 2014 election campaign when it was denouncing the Employment Contracts Act 1991 as the reason for wages growth have not kept up with GDP per capita growth since its passage in 1991. Its evidence in chief against the deregulation of the New Zealand labour market is in the snapshot below showing their graph of real GDP per capita and average real wages from 1965 to 2014.
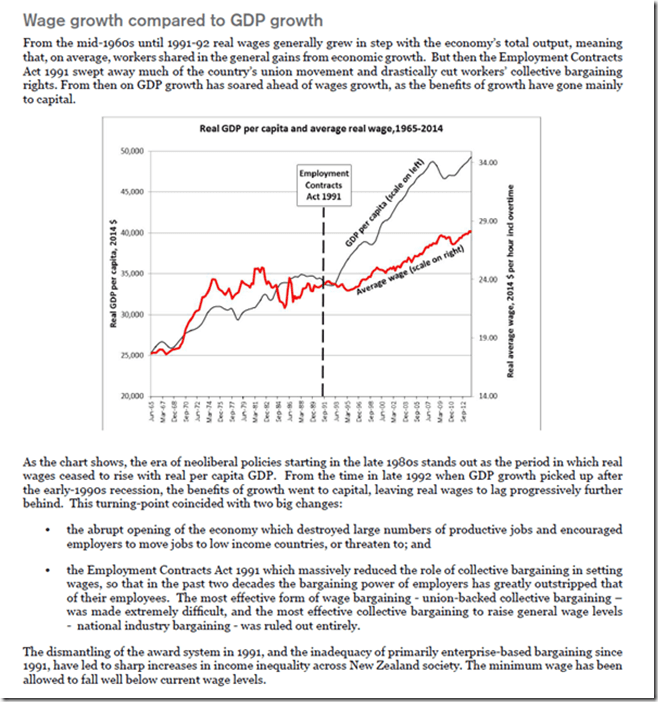
Source: Low Wage Economy | New Zealand Council of Trade Unions – Te Kauae Kaimahi.
The chart selected by the Council of Trade Unions shows several distinct trends in wages growth and real GDP growth per capita in New Zealand. None of these trends nor breaks in trends support the hypothesis that the days prior to the Employment Contracts Act 1991 were the good old days where workers shared generally in gains from economic growth.
From about 1970 to 1975 in the snapshot below of the Council of Trade Unions chart there was rapid real wages growth, well in excess of real growth in per capita GDP. This wages breakout was followed by some ups and downs but essentially wages in 1995 were no different from what they were in 1975. Real wages were about $24 per hour in real terms in New Zealand for about 20 years – from 1975 to 1995.
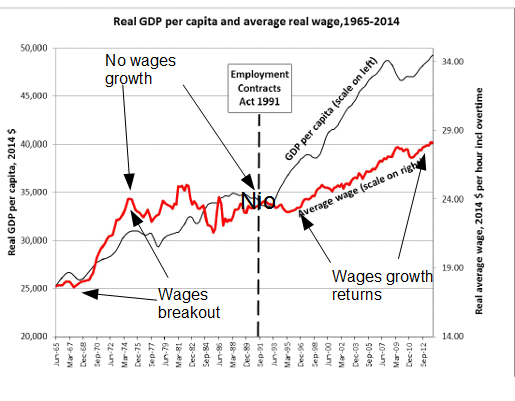
These are the good old days in the eyes of the Council of Trade Unions. No real wages growth for 20 years. There was no real GDP per capita growth from 1975 until 1979 nor in the five years leading up to the passage of the Employment Contracts Act 1991 in the chart selected by the Council of Trade Unions in the snapshot above.
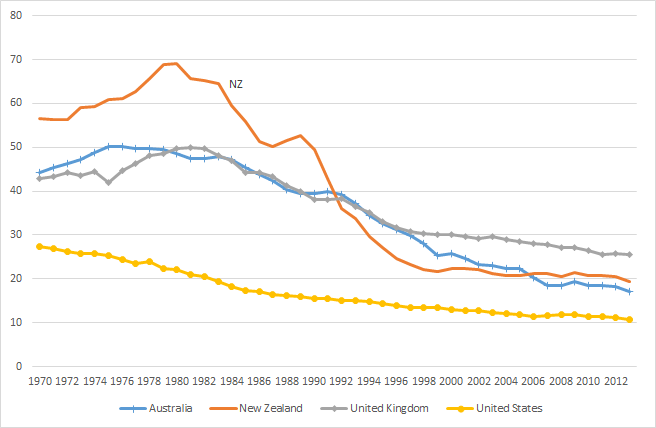
The period leading up to 1975 in the preceding wages breakout was the zenith of union membership with nearly 70% of all workers belonging to a union – see figure 1. What followed from 1975 was a long declining in trade union membership that did not end until just after the Employment Contracts Act in 1991 – see figure 1.
Figure 1: Trade union densities, New Zealand, Australia, United Kingdom and United States, 1970–2013
Source: OECD StatExtract.
Whatever happened to union power in New Zealand happened before the passage of the Employment Contracts Act 1991 and with it the deregulation of the New Zealand labour market. 20 years of no real wages growth and economic stagnation may explain part of the decline of unions in New Zealand.
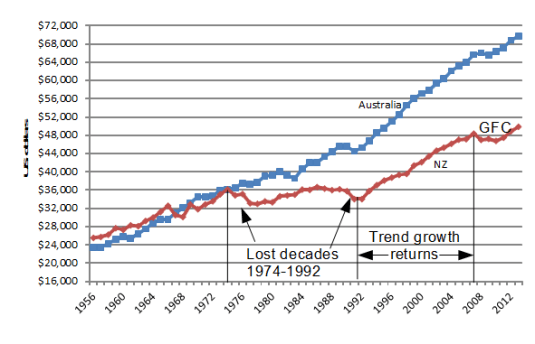
Real GDP per capita growth was pretty stagnant after 1975 to 1994 in the chart of data selected by the Council of Trade Unions, which is why I have previously referred to 1974 to 1992 as New Zealand’s Lost Decades – see figures 2 and 3.
Figure 2: Real GDP per New Zealander and Australian aged 15-64, converted to 2013 price level with updated 2005 EKS purchasing power parities, 1956-2013, $US
Source: Computed from OECD Stat Extract and The Conference Board, Total Database, January 2014, http://www.conference-board.org/economics
Figure 2 shows that New Zealand lost two decades of productivity growth between 1974 and 1992 after level pegging with Australia for the preceding two decades.
These lost decades of growth are the unions’ good old days but workers cannot share in the general gains of economic growth when there isn’t any economic growth as the chart selected by the Council of Trade Unions and figure 2 both show.
New Zealand returned to trend growth in real GDP per working age New Zealander between 1992 and 2007, which is straight after the passage of the Employment Contracts Act 1991 – see figure 2. Coincidence?
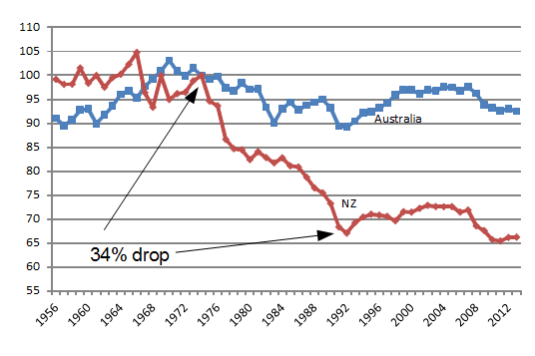
Figure 3: Real GDP per New Zealander and Australian aged 15-64, converted to 2013 price level with updated 2005 EKS purchasing power parities, 1.9 per cent detrended, base 100 = 1974, 1956-2013, $US
Source: Computed from OECD Stat Extract and The Conference Board, Total Database, January 2014, http://www.conference-board.org/economics
In Figure 3, a flat line equates to a 1.9% annual growth rate in real GDP per working age person; a falling line is a below trend growth rate; a rising line is an above 1.9% growth rate of real GDP per working age person. The trend growth rate of 1.9% per working age person is the 20th century trend growth rate that Edward Prescott currently estimates for the global industrial leader, which is the United States of America.
Figure 3 shows that there was a 34% drop against trend growth in real GDP per working age New Zealander between 1974 and 1992; a return to trend growth between 1992 and 2007; and a recession to 2010. this 34% drop against trend productivity growth is looked upon by the Council of Trade Unions as some sort of good old days.
A long period of no labour productivity growth and little real GDP per capita growth are pretty good reasons to rethink New Zealand’s economic policies at a fundamental level, which is exactly what happened after 1984 with the election of a Labour Government.
The unions have conveniently provided another explanation for the Lost Decades of growth in New Zealand from 1974 to 1992. That is the rapid growth of real wages ahead of real GDP per capita in the seven years before growth stalled in New Zealand in 1974 in the snapshot above. This real wages breakout was followed by two decades of lost growth.
Most ironically of all, steady growth in real wages in New Zealand did not return until after the passage of the Employment Contracts Act in 1991! After nearly 20 years of no real wages growth, real wages growth returned at long last in 1995.
After staying at about $24 per hour for 20 years from 1975 in the good old days of union power and collective bargaining, average wages in New Zealand have increased from $24 an hour to about $28 per hour by 2014 in one of the most deregulated labour markets in the world.
The Council of Trade Unions regards the return of real wages growth after a 20 year hiatus as an unwelcome development or something to complain about.
24 May 2015 Leave a comment
in applied price theory, business cycles, econometerics, economic growth, economic history, economics of media and culture, macroeconomics Tags: consultants, efficient markets hypothesis, forecasting errors
22 May 2015 Leave a comment
in budget deficits, business cycles, fiscal policy, macroeconomics Tags: fiscal stimulus, Keynesian macroeconomic policy
20 May 2015 Leave a comment
Monday morning blues? Compare the avg number of #working hours in yr country per year. More: bit.ly/1JPVYQu http://t.co/r5MsELJr1n—
(@OECD) April 19, 2015
19 May 2015 Leave a comment
in economic growth, economic history, macroeconomics, politics - USA Tags: British economy, Canada, convergence
Figure 1: US and Canadian real GDP per capita are as percentage of British GDP per capita (1990 Int. GK$PPP), 1800 – 2010
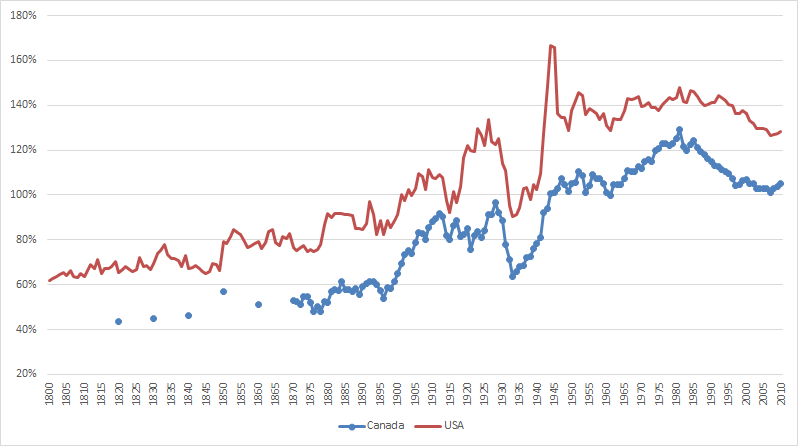
Source: The Maddison-Project, http://www.ggdc.net/maddison/maddison-project/home.htm 2013 version.
Celebrating humanity's flourishing through the spread of capitalism and the rule of law
Celebrating humanity's flourishing through the spread of capitalism and the rule of law
Celebrating humanity's flourishing through the spread of capitalism and the rule of law
Celebrating humanity's flourishing through the spread of capitalism and the rule of law
Celebrating humanity's flourishing through the spread of capitalism and the rule of law
A History of the Alt-Right
Econ Prof at George Mason University, Economic Historian, Québécois
Celebrating humanity's flourishing through the spread of capitalism and the rule of law
Scholarly commentary on law, economics, and more
Beatrice Cherrier's blog
Celebrating humanity's flourishing through the spread of capitalism and the rule of law
Celebrating humanity's flourishing through the spread of capitalism and the rule of law
Celebrating humanity's flourishing through the spread of capitalism and the rule of law
Why Evolution is True is a blog written by Jerry Coyne, centered on evolution and biology but also dealing with diverse topics like politics, culture, and cats.
Celebrating humanity's flourishing through the spread of capitalism and the rule of law
A rural perspective with a blue tint by Ele Ludemann
DPF's Kiwiblog - Fomenting Happy Mischief since 2003
Celebrating humanity's flourishing through the spread of capitalism and the rule of law
The world's most viewed site on global warming and climate change
Tim Harding's writings on rationality, informal logic and skepticism
A window into Doc Freiberger's library
Let's examine hard decisions!
Commentary on monetary policy in the spirit of R. G. Hawtrey
Thoughts on public policy and the media
Celebrating humanity's flourishing through the spread of capitalism and the rule of law
Politics and the economy
A blog (primarily) on Canadian and Commonwealth political history and institutions
Reading between the lines, and underneath the hype.
Economics, and such stuff as dreams are made on
"The British constitution has always been puzzling, and always will be." --Queen Elizabeth II
Celebrating humanity's flourishing through the spread of capitalism and the rule of law
Celebrating humanity's flourishing through the spread of capitalism and the rule of law
WORLD WAR II, MUSIC, HISTORY, HOLOCAUST
Undisciplined scholar, recovering academic
Celebrating humanity's flourishing through the spread of capitalism and the rule of law
Res ipsa loquitur - The thing itself speaks
In Hume’s spirit, I will attempt to serve as an ambassador from my world of economics, and help in “finding topics of conversation fit for the entertainment of rational creatures.”
Researching the House of Commons, 1832-1868
Articles and research from the History of Parliament Trust
Reflections on books and art
Posts on the History of Law, Crime, and Justice
Celebrating humanity's flourishing through the spread of capitalism and the rule of law
Exploring the Monarchs of Europe
Cutting edge science you can dice with
Small Steps Toward A Much Better World
“We do not believe any group of men adequate enough or wise enough to operate without scrutiny or without criticism. We know that the only way to avoid error is to detect it, that the only way to detect it is to be free to inquire. We know that in secrecy error undetected will flourish and subvert”. - J Robert Oppenheimer.



Recent Comments