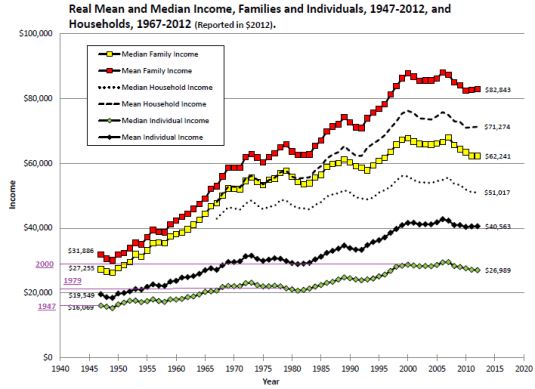
Noahpinion: Postwar vs. New Gilded Age: How did the middle class do?.
Celebrating humanity's flourishing through the spread of capitalism and the rule of law
28 Jan 2015 Leave a comment
in applied welfare economics, economic growth, income redistribution, politics - USA, poverty and inequality Tags: middle class stagnation
24 Jan 2015 Leave a comment
in constitutional political economy, economics of bureaucracy, economics of regulation, Gordon Tullock, health and safety, health economics, income redistribution, James Buchanan, labour economics, Rawls and Nozick Tags: expressive voting, health and safety, James Buchanan, rational ignorance, rational irrationality, statistical life, veil of ignorance, veil of insignificance, veil of uncertainty

Gordon Tullock wrote a 1979 New York Law Review book about avoiding difficult choices. His review was of a book by Guido Calabresi and Philip Bobbitt called Tragic Choices which was about the rationing: the allocation of kidney dialysis machines (a “good”), military service in wartime (a “bad”), and entitlements to have children (a mixed blessing).
Tullock argued that we make a decision about how to allocate resources, how to distribute the resources, and then how to think about the previous two choices. People do not want to face up to the fact resources are scarce and they face limits on their powers.
To reduce the personal distress of making these tragic choices, Tullock observed that people often allocate and distribute resources in a different way so as to better conceal from themselves the unhappy choices they had to make even if this means the recipients of these choices are worse off and more lives are lost than if more open and honest choices were made up about there only being so much that can be done.
The Left over Left and union movement spends a lot of time pontificating about how we must not let economics influence health and safety policy rather than help frame public policy guidance on what must be done because scarcity of resources requires the valuation of life in everything from health, safety, and environmental regulations to road building. health budgeting is full of tragic choices about how much is spend to save so lives and where and for how long.
The Left over Left and the union movement deceive themselves and others into make futile gestures to make themselves feel good. These dilettantes cannot assume that they are safely behind a veil of insignificance. They have real influence on how public policy on health and safety are made.
A major driver of the opposition among the Left over Left and the union movement to the use of cost-benefit analysis and the valuation of statistical lives is its adoption makes people confront the tragic consequence of any of the choices available to them.
By saying how dare you value a statistical life does not change the fact that choices made without this knowledge will still have tragic consequences, and more lives may be lost because people want to conceal from themselves the difficult choices that they are making about others as voters and as policy-makers.
One of the purposes of John Rawls’ veil of ignorance and Buchanan and Tullock’s veil of uncertainty is that the basic social institutions be designed and agreed when we have abstracted from the grubby particulars of our own self-interest. Buchanan and Tullock explain the thought experiment this way
Agreement seems more likely on general rules for collective choice than on the later choices to be made within the confines of certain agreed-upon rules. …
Essential to the analysis is the presumption that the individual is uncertain as to what his own precise role will be in any one of the whole chain of later collective choices that will actually have to be made.
For this reason he is considered not to have a particular and distinguishable interest separate and apart from his fellows.
This is not to suggest that he will act contrary to own interest; but the individual will not find it advantageous to vote for rules that may promote sectional, class, or group interests because, by supposition, he is unable to predict the role that he will be playing in the actual collective decision-making process at any particular time in the future.
He cannot predict with any degree of certainty whether he is more likely to be in a winning or a losing coalition on any specific issue. Therefore, he will assume that occasionally he will be in one group and occasionally in the other.
His own self-interest will lead him to choose rules that will maximize the utility of an individual in a series of collective decisions with his own preferences on the separate issues being more or less randomly distributed.
Behind the veil of ignorance and the veil of uncertainty, we would all agree that resources are limited, including in the health sector and some drugs can’t be funded – choices must be made.
Once we go in front of the veil of ignorance and find out that we are the one missing out on that drug, naturally, our views will change. We agreed to these rules as fair for the distribution of basic social resources when, as John Rawls put it:
…no one knows his place in society, his class position or social status; nor does he know his fortune in the distribution of natural assets and abilities, his intelligence and strength, and the like.
Is always the case that someone just falls on the other side of any line in the sand. If you move that line, there is always another set of people who are just on the other side.

23 Jan 2015 Leave a comment
in George Stigler, income redistribution, liberalism, Public Choice, rentseeking Tags: evidence-based policy
23 Jan 2015 Leave a comment

22 Jan 2015 Leave a comment
in development economics, growth disasters, growth miracles, income redistribution, liberalism Tags: evidence-based policy, Leftover Left, Oxfam, top 1%
20 Jan 2015 1 Comment
in income redistribution, labour economics, minimum wage Tags: minimum wage, offsettinh behaviour, The fatal conceit, unintended consequences
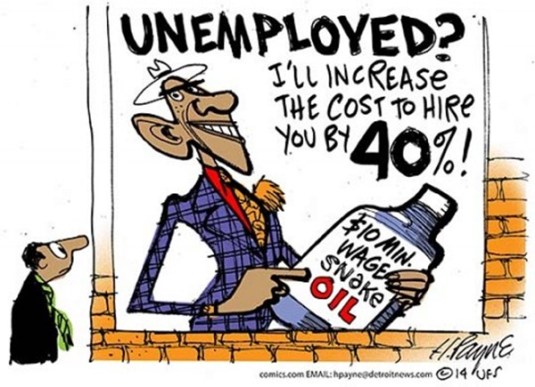
John Schmitt lists 11 margins along which a minimum wage might cause changes in net pay and conditions:
Richard McKenzie argues that the biggest impact of a minimum wage increase is reductions to paid and unpaid benefits for minimum wage workers, including health insurance, store discounts, free food, flexible scheduling, and job security resulting from higher-skilled workers drawn to the higher minimum wage jobs:
McKenzie also argued that if the minimum wage does not cause employers to make substantial reductions in fringe benefits and increases in work demands, then an increased minimum should cause
(1) An increase in the labour-force-participation rates of covered workers (because workers would be moving up their supply of labour curves),
(2) A reduction in the rate at which covered workers quit their jobs (because their jobs would then be more attractive), and
(3) A significant increase in prices of production processes heavily dependent on covered minimum-wage workers.
Wessels found that minimum-wage increases had exactly the opposite effect as intended: labour force participation rates went down; job quit rates went up, and prices did not rise appreciably.
These are findings by Wessels are consistent only with the view that minimum-wage increases make workers worse off, rather than better off in terms of net pay and conditions. After the minimum wage increase, the net advantages and disadvantages of menial jobs are less than before. Fewer workers enter the workforce and more quit their jobs.
McKenzie was the first economist to argue that a minimum wage increase may actually reduce the labour supply of menial workers. Employment in menial jobs may go down slightly in the face of minimum-wage increases not so much because the employers don’t want to offer the jobs, but because fewer workers want these menial jobs that are offered.
The repackaging of monetary and non-monetary benefits, greater work intensities and fewer training opportunities make these jobs less attractive relative to their other options. This reduction in labour supply by low skilled workers is why the voluntary quit rate among low-wage workers goes up, not down, after a minimum wage increase. As McKenzie explains
Economists almost uniformly argue that minimum wage laws benefit some workers at the expense of other workers.
This argument is implicitly founded on the assumption that money wages are the only form of labour compensation. Based on the more realistic assumption that labour is paid in many different ways, the analysis of this paper demonstrates that all labourers within a perfectly competitive labour market are adversely affected by minimum wages.
Although employment opportunities are reduced by such laws, affected labour markets clear. Conventional analysis of the effect of minimum wages on monopsony markets is also upset by the model developed.
McKenzie argues that not accounting for offsetting behaviour led to a fundamental misinterpretation in the empirical literature on the minimum wage. That literature shows that small increases in the minimum wages does not seem to affect employment and unemployment by that much.
…. wage income is not the only form of compensation with which employers pay their workers. Also in the mix are fringe benefits, relaxed work demands, workplace ambiance, respect, schedule flexibility, job security and hours of work.
Employers compete with one another to reduce their labour costs for unskilled workers, while unskilled workers compete for the available unskilled jobs — with an eye on the total value of the compensation package.
With a minimum-wage increase, employers will move to cut labour costs by reducing fringe benefits and increasing work demands
Proponents and opponents of minimum-wage hikes do not seem to realize that the tiny employment effects consistently found across numerous studies provide the strongest evidence available that increases in the minimum wage have been largely neutralized by cost savings on fringe benefits and increased work demands and the cost savings from the more obscure and hard-to-measure cuts in nonmoney compensation.
McKenzie is correct in arguing that the empirical literature on the minimum wage is dewy-eyed. The first assumption about any regulation is the market will offset it significantly.
In the course of undoing the direct effects of the regulation, there will be unintended consequences such as the remixing of wage and nonwage components of remuneration packages of low skilled workers covered by the minimum wage. Greg Mankiw concludes that:
The minimum wage has its greatest impact on the market for teenage labour. The equilibrium wages of teenagers are low because teenagers are among the least skilled and least experienced members of the labour force.
In addition, teenagers are often willing to accept a lower wage in exchange for on-the-job training. . . . As a result, the minimum wage is more often binding for teenagers than for other members of the labour force.

20 Jan 2015 Leave a comment
in applied price theory, applied welfare economics, economic growth, economic history, income redistribution, macroeconomics, Public Choice, public economics, rentseeking Tags: Leftover Left, Thomas Piketty
16 Dec 2014 Leave a comment
in income redistribution, politics - Australia Tags: top 1%

Source: topincomes-parisschoolofeconomics
As with New Zealand, plenty of people in the top income brackets in Australia would regard themselves as middle class – entrepreneurs and professionals who made their way up from the bottom.
As with New Zealand, there is a major spike in top earnings around the time of the 1985 tax reform when the top tax rate was cut from 66% to 49% in Australia.
Source: topincomes-parisschoolofeconomics
As for trans-Tasman comparisons, the top 10% and top 5% in Australia do earn more than their compatriots in New Zealand.
The top 1% in Australia are much better performers than the top 1% in New Zealand, but then again wages and incomes are about a third higher in Australia as compared to New Zealand.
The Australian 0.5% are clearly superior to their New Zealand rivals, earning at least 50% more than them on average.
The New Zealand chart is in New Zealand dollars in 2011; the Australian chart is in Australian dollars in 2010.
A reason for the higher earnings of the Australian top 1% is the larger economy offers a greater superstar effect.
Globalisation and technological changes would allow the Australian best performers, including the top managers and top chief executives, in a given field to serve a bigger market and thus reap a greater share of its revenue. But this would also reduce the spoils available to the less gifted in the business. Australia, as the seven times larger economy, allows their best performers to serve bigger domestic markets.
16 Dec 2014 Leave a comment
in economic history, income redistribution, labour economics, politics - New Zealand, Rawls and Nozick Tags: top 1%

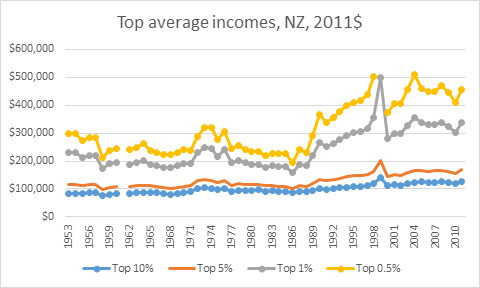
Source: topincomes-parisschoolofeconomics
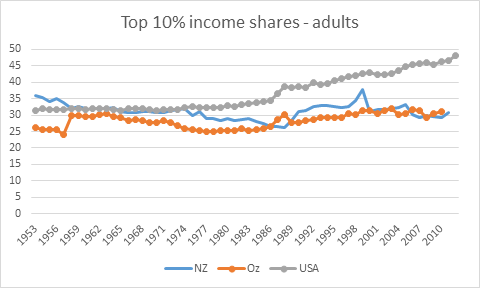
Note: top income share data for adults for New Zealand adults go back only as far as 1953.
To begin with, a large number of people who see themselves as middle class will have to reclassify themselves in terms of class membership.
More importantly, they will have to pick up on their class consciousness because they are either in the top 10% as any successful professional is because the average income of the top 10% in New Zealand is $128,000. With a bit of luck, these members of the ruling class will be able to afford a house in Auckland without having to borrow from mum and dad.
Pretty much every successful professional is in the top 5% in New Zealand, with an average income of $170,000.
These rich have a lot of people look down upon and order about as junior or senior members of the ruling class, even if they did know they were a member of the ruling class until they looked at the diagram above. Welcome to the ruling class. Goodbye to the middle-class. Get over it.
As for the top 1% in New Zealand, they have an average income in 2011 of $336,000. Once again, successful professionals, successful entrepreneurs and what’s left of the rentier class will have to accept that supreme power as the ruling class of the capitalist system is open to just about anybody who does well at university and enters the professions. Are there no standards?
As for the top 0.5%, data on the top 0.1% stopped in 1989, they earned an average of $457,000 a year in 2011. That is starting to look like good money, though you do have to brush shoulders with celebrities, athletes and more than a few successful small entrepreneurs, but at least you are starting to earn a lot more than your average suburban doctor who is a member of the top 10%.
The ruling class is not what it used to be – the rentier class, old money. That the rich of today – the ruling class of the capitalist system – is open to many ordinary people who are new rich or just plain urban professionals, athletes, musicians and celebrities is a common finding all round the world. As Piketty and Saez explained for the USA:
This rise in top income shares is not due to the revival of top capital incomes, but rather to the very large increases in top wages (especially top executive compensation).
As a consequence, top executives (the “working rich”) have replaced top capital owners at the top of the income hierarchy over the course of the twentieth century.
Many of the rich both in New Zealand and overseas are working rich who made their money themselves and came from middle class or upper middle-class backgrounds.
Many of these rich are well educated smart people rather than the inheritors of wealth. The working rich and most of the rich of the 21st century must be well educated because so many of them are professionals in occupations where you must succeed at university to get in the ground floor, or they are athletes, musicians and other celebrities who must work their way up from the bottom.
A large number of New Zealanders who regarded themselves as middle class action are part of the rich – the top 10%, top 5% and banging on the doors of the top 1% or better – so they better start carrying themselves about with the airs and graces of the ruling class. Better practice by putting a plum in your mouth.
p.s. There was a big spike in top incomes in 1999. It seems like a lot of people in New Zealand brought forward income in 1998 and 1999 in anticipation of the election of a Labour Party government in the 1999 New Zealand general election, and an immediate increase in the top tax rate from 33% to 39% for incomes over $60,000.
16 Dec 2014 Leave a comment
in economics of education, income redistribution, politics - Australia, politics - New Zealand, politics - USA Tags: education premium, top 1%
Source: topincomes-parisschoolofeconomics
One reason why the top 10% in New Zealand have been a pretty ordinary lot compared to the USA is New Zealand’s university graduate premium – the college premium as it is known in the USA – is at the very bottom of the OECD ladder at about 18% – rock bottom 32nd out of 32 – the wooden spoon.
The College premium in the USA is about 64%, as shown in the OECD data below from OECD Education at Glance. Naturally, this high College premium in the USA should show up in well educated, highly skilled people earning a lot more than those that don’t go to college and don’t go to graduate school.
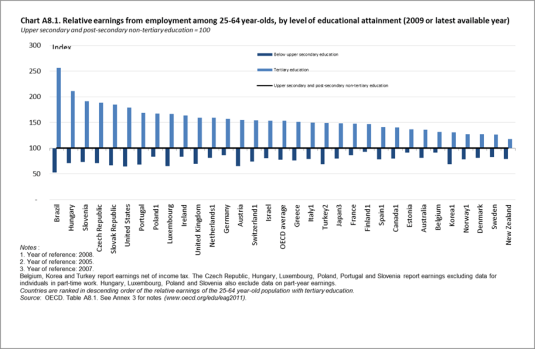
Stats link: http://dx.doi.org/10.1787/888932460515
Little wonder that the USA top 10% are breaking away from the pack. This slow increase in the income share of the top 10% since the early 1970s coincided with large numbers, including many more women in long duration professional degrees, going to university.
Prior to the mid-1970s, the College premium in the USA had been falling for about a decade because of large numbers of people going on to College and many of these two graduate school to get a draft deferment.
People married younger then so by the time people were at the end of College or graduate school, they were usually married with children and got of further draft deferment and aged out of the draft system.
16 Dec 2014 2 Comments
in income redistribution, politics - Australia, politics - New Zealand Tags: top 1%

Source: topincomes-parisschoolofeconomics
Note: top 1% income share data for adults for New Zealand adults go back only as far as 1953.
The top 1% in New Zealand have had a good 60 years to immiserate the proletariat and what are they done? Nothing!
The top 1% share of national income is much the same as it was in 1953! The Australian top 1% haven’t done much better. Bludgers, the lot of them.
What do the Occupy movement have to protest about in New Zealand if the rich haven’t been getting richer?
15 Dec 2014 Leave a comment
in economic history, income redistribution, labour economics, Marxist economics, politics - USA, technological progress Tags: Bryce Edwards, Leftover Left, poverty and inequality
Bryce Edwards has shown in today’s column that he knows nothing about inequality in New Zealand, despite the statistics being at his fingertips:
Under capitalism there’s always going to be a war against the poor.
The process by which we divide up the resources of any society normally involves exploiting the majority for the benefit of the minority.
It’s called inequality. And this is how it is in New Zealand: those who have the most power look for ways to extract that money for themselves, or at least retain the status quo.
Against this are those who want to have a more equal society. It’s an age-old political issue, and one that has traditionally been at the heart of the left-right political divide.
In 2014 this concern about inequality has been a key feature of politics, underpinning much of what has occur…
Although the rich appear to have been winning for three decades in their ‘war against the poor’, perhaps the tide is turning?
There’s still every indication of severe poverty and inequality in this country.
Firstly, inequality has not increased in New Zealand for at least 20 years when either measured in figure 1 by the Gini coefficient or in figure 2, the top 1% income shares. Both the Gini coefficient and the top 1% income shares have not risen for 20 years.
Figure 1: Gini coefficient New Zealand 1980-2015

Source: Bryan Perry, Household incomes in New Zealand: Trends in indicators of inequality and hardship 1982 to 2013. Ministry of Social Development (July 2014).
Figure 2: Top 1% income shares, USA, New Zealand and Australia, 1970-2012
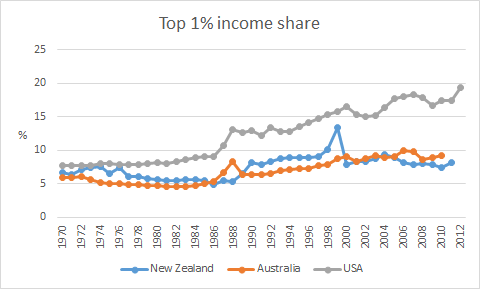
Source: top incomes database
Secondly, the benefits of the economic boom that lasted 15 years from the early 1990s until the onset of the global financial crisis would spread broadly across all sections of the New Zealand community. As shown in figure 3, both before and after housing costs increased. As shown in figure 4, real household incomes increased pretty much evenly across all of the 10 income deciles between 1994 and 2013.
Figure 3: Real household income trends before housing costs (BHC) and after housing costs (AHC), 1982 to 2013 ($2013)
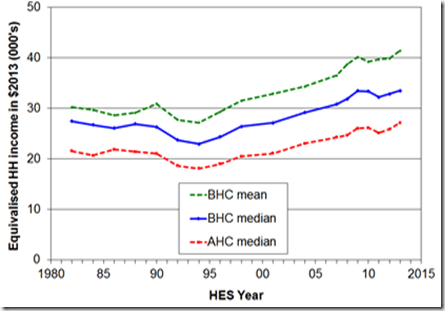
Source: Bryan Perry, Household incomes in New Zealand: Trends in indicators of inequality and hardship 1982 to 2013. Ministry of Social Development (July 2014).
Figure 4: Real household incomes (BHC), changes for top of income deciles, 1994 to 2013
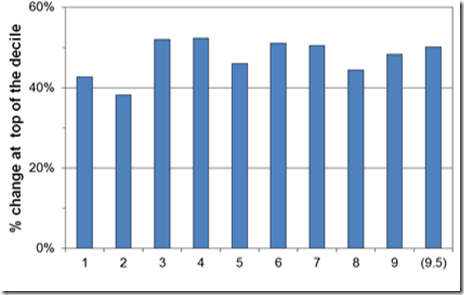
Source: Bryan Perry, Household incomes in New Zealand: Trends in indicators of inequality and hardship 1982 to 2013. Ministry of Social Development (July 2014).
Thirdly, as shown in figure 5, between 1994 and 2010, real equivalised median household income rose 47% from 1994 to 2010; for Māori, this rise was 68%; for Pasifika, the rise was 77%. Median household income increases of nearly 50% in 16 years should be celebrated.
Figure 5: Real equivalised median household income (before housing costs) by ethnicity, 1988 to 2013 ($2013).

Source: Bryan Perry, Household incomes in New Zealand: Trends in indicators of inequality and hardship 1982 to 2013. Ministry of Social Development (July 2014).
The massive improvements in Māori incomes since 1992 were based on rising Māori employment rates, fewer Māori on benefits, more Māori moving into higher paying jobs, and greater Māori educational attainment. Māori unemployment reached a 20-year low of 8 per cent from 2005 to 2008.
Over the last more than two decades in New Zealand, there has been sustained income growth spread across all of New Zealand society contrary to the warmed over Marxism of Bryce Edwards. Perry (2014) reviews the data every year for the Ministry of Social Development. He concluded that:
Overall, there is no evidence of any sustained rise or fall in inequality in the last two decades.
The level of household disposable income inequality in New Zealand is a little above the OECD median.
The share of total income received by the top 1% of individuals is at the low end of the OECD rankings.
Bryce Edwards’ analysis was in the typical Marxist tradition – it had no gender analysis. He failed to mention that New Zealand has the smallest gender wage gap of all the industrialised countries.

As he did not notice these great successes in household incomes, incomes of every decile, Māori economic development and the empowerment of women, Bryce Edwards had nothing to add in terms of either consolidating or improving on them.
08 Dec 2014 Leave a comment
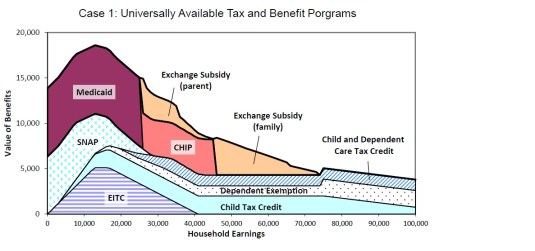
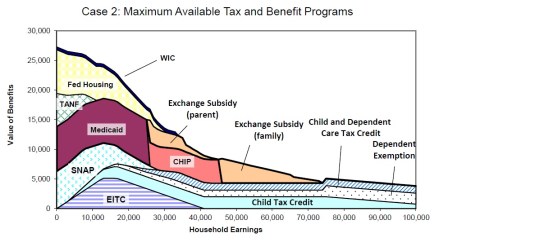
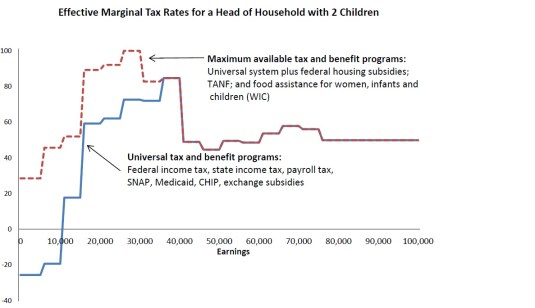
in fiscal policy, income redistribution, labour economics, labour supply, politics - USA, public economics, welfare reform Tags: effective marginal tax rates, Obama care, poverty traps, welfare reform

One in five Americans on Medicaid; this image does not include those on Medicare –those over 65 who get their healthcare paid by the government.


Celebrating humanity's flourishing through the spread of capitalism and the rule of law
A History of the Alt-Right
Econ Prof at George Mason University, Economic Historian, Québécois
Celebrating humanity's flourishing through the spread of capitalism and the rule of law
Scholarly commentary on law, economics, and more
Beatrice Cherrier's blog
Celebrating humanity's flourishing through the spread of capitalism and the rule of law
Celebrating humanity's flourishing through the spread of capitalism and the rule of law
Celebrating humanity's flourishing through the spread of capitalism and the rule of law
Why Evolution is True is a blog written by Jerry Coyne, centered on evolution and biology but also dealing with diverse topics like politics, culture, and cats.
Celebrating humanity's flourishing through the spread of capitalism and the rule of law
A rural perspective with a blue tint by Ele Ludemann
DPF's Kiwiblog - Fomenting Happy Mischief since 2003
Celebrating humanity's flourishing through the spread of capitalism and the rule of law
The world's most viewed site on global warming and climate change
Tim Harding's writings on rationality, informal logic and skepticism
A window into Doc Freiberger's library
Let's examine hard decisions!
Commentary on monetary policy in the spirit of R. G. Hawtrey
Thoughts on public policy and the media
Celebrating humanity's flourishing through the spread of capitalism and the rule of law
Politics and the economy
A blog (primarily) on Canadian and Commonwealth political history and institutions
Reading between the lines, and underneath the hype.
Economics, and such stuff as dreams are made on
"The British constitution has always been puzzling, and always will be." --Queen Elizabeth II
Celebrating humanity's flourishing through the spread of capitalism and the rule of law
Celebrating humanity's flourishing through the spread of capitalism and the rule of law
WORLD WAR II, MUSIC, HISTORY, HOLOCAUST
Undisciplined scholar, recovering academic
Celebrating humanity's flourishing through the spread of capitalism and the rule of law
Res ipsa loquitur - The thing itself speaks
In Hume’s spirit, I will attempt to serve as an ambassador from my world of economics, and help in “finding topics of conversation fit for the entertainment of rational creatures.”
Researching the House of Commons, 1832-1868
Articles and research from the History of Parliament Trust
Reflections on books and art
Posts on the History of Law, Crime, and Justice
Celebrating humanity's flourishing through the spread of capitalism and the rule of law
Exploring the Monarchs of Europe
Cutting edge science you can dice with
Small Steps Toward A Much Better World
“We do not believe any group of men adequate enough or wise enough to operate without scrutiny or without criticism. We know that the only way to avoid error is to detect it, that the only way to detect it is to be free to inquire. We know that in secrecy error undetected will flourish and subvert”. - J Robert Oppenheimer.
The truth about the great wind power fraud - we're not here to debate the wind industry, we're here to destroy it.
Celebrating humanity's flourishing through the spread of capitalism and the rule of law
Celebrating humanity's flourishing through the spread of capitalism and the rule of law


Recent Comments