Veteran left-wing grumbler Max Rashbrooke yesterday argued for a wealth tax and inheritance taxes in New Zealand because of a widening wealth gap. He wants to tax inheritances of more than a mere $200,000 over your lifetime!
Yeah, I mean, we really are an international outlier in the sense that we don’t really tax wealth in any form. We don’t tax capital gains except now in very limited circumstances. We don’t tax inheritances. We don’t tax gifts. We don’t tax wealth in general, and this is a complicated area. In a lot of countries inheritance taxes are falling out of fashion. They get called death taxes and that kind of thing. But in response to that, what a lot of people are talking about are things like kind of a lifetime capital receipts tax. So rather than taxing the giver, you tax the recipient, and you say, ‘Look, over your lifetime, you can inherit, say, $200,000 tax free,’ so that your parents can pass on a bit to you.
That means an inheritance tax on the family home given current house prices in Auckland and Wellington and small families. I can’t see the Labour Party or even the Greens following him in on that one if they want to win office ever again.
Did Rashbrooke make a case for a widening wealth gap by looking at a 2004 survey of income and wealth?
Currently, the most recent publicly available information on wealth inequality in New Zealand comes from the 2004 round of the Survey of Family, Income and Employment, known as Sofie… Because wealthy people often refuse to take part in surveys such as Sofie, such data tends to underestimate how much of the pie is owned by the wealthiest people and overstate the share of everyone else. But it is still the best data we have.
Rashbrooke used this 2004 survey to draw a number of conclusions about the distribution of wealth in New Zealand:
The wealthiest tenth of individuals (including that wealthiest one per cent) had 52 per cent of all assets. In contrast, the poorest half of the country had just five per cent of all wealth. Some 190,000 people had negative net worth (more debts than assets), owing $4.7 billion between them.
Did Rashbrooke make his case that there is 52% of all assets in New Zealand are held by the wealthiest 10%? He did not because his definition wealth is too incomplete. Because of that, his focus on inheritance taxes and wealth taxes as solutions are equally poorly made. Any definition of wealth including that by Rashbrooke that doesn’t include human capital or acknowledge the limitations of not including human capital isn’t worth serious attention in public policy circles.

Source: Gary Becker, ‘Give Us Your Skilled Masses’ (2005).
Rashbrooke ignores 70% of the capital, the wealth in any economy. Gary Becker’s estimate that human capital is 70% of all capital in the US economy travels well to New Zealand as shown in the chart below.
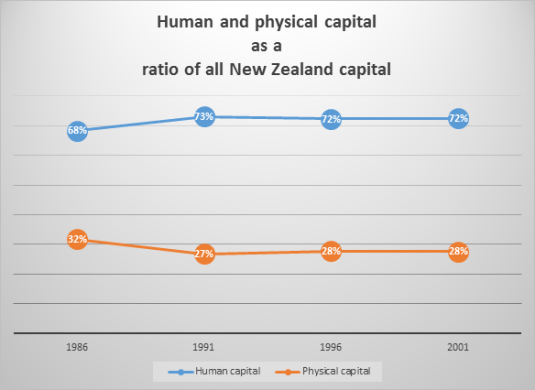
Source: Lˆe Thi. Vˆan Tr`ınh, Estimating the monetary value of the stock of human capital for New Zealand, University of Canterbury PhD thesis (September 2006), Table 4.8: Human and physical capital stocks.
Over 70% of all capital in New Zealand is human capital. That cannot be ignored in any discussion of a widening wealth gap or in a case for inheritance and wealth taxes.
Dollar value estimates were available to Rashbrooke of human and physical capital of the same vintage as his wealth data from an excellent New Zealand PhD thesis by Lˆe Thi. Vˆan Tr`ınh. Her estimates of the aggregate dollar value of New Zealand physical and human capital are charted below. These estimates show that physical capital doubled between 1981 and 2001 but New Zealand human capital quadrupled.

Source: Lˆe Thi. Vˆan Tr`ınh, Estimating the monetary value of the stock of human capital for New Zealand, University of Canterbury PhD thesis (September 2006), Table 4.8: Human and physical capital stocks.
The rich are clearly not getting richer and the poor getting poorer and some people have no wealth at all. Human capital is the dominant form of capital in New Zealand and is growing rapidly. Any discussion of wealth does not include estimates of human capital or acknowledge the limitations of not having those estimates, which are easily available, should not be considered in public policy debates on inequality.
Source: Lˆe Thi. Vˆan Tr`ınh, Estimating the monetary value of the stock of human capital for New Zealand, University of Canterbury PhD thesis (September 2006).
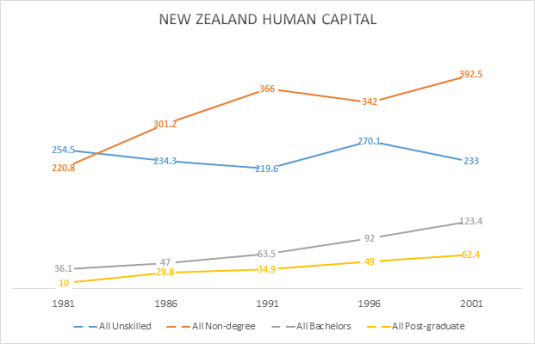
The only group in New Zealand that doesn’t have more human capital in 2001 than in 1981 were the unskilled as the chart above shows. This was because their numbers dropped by one-third as a share of the working age population.

Source: Lˆe Thi. Vˆan Tr`ınh, Estimating the monetary value of the stock of human capital for New Zealand, University of Canterbury PhD thesis (September 2006), table 3.1.
I don’t think a solution to skills gaps is to increases taxes on those who investing in human capital. But that is the logic of Rashbrooke. When someone gets ahead, drag them back down rather than lift everybody up.
The reason for the lack of growth in the dollar value of unskilled human capital is the massive increase in investment in higher education in New Zealand. More New Zealanders go to university, Polytech or other diploma education. Working class New Zealanders are taking the advice of that unrepentant Stalinist but brilliant screenwriter Dalton Trumbo.

What is most disappointing is the unrepentant lack of gender analysis in the writings of Max Rashbrooke on inequality and wealth. Without a gender analysis, no discussion of wealth and inequality in New Zealand has any meaning.
Few labour market statistics have any meaning unless broken down by gender. Whenever you don’t see statistics with a gender breakdown, the first question for any sort of credible audience is “Gender analysis! Gender analysis! Where is your gender analysis?”
Max Rashbrooke inadvertently illustrated the meaningless of statistics that don’t have a gender analysis when griping recently about poverty and inequality in New Zealand as compared to the good old days before the economic reforms of the 1980s.
To paint pre-1984 New Zealand, pre-neoliberal New Zealand as an egalitarian paradise, Rashbrooke had to ignore two thirds of the population. He brushed over the inequalities they suffered in the heavily regulated, heavily taxed economy so looked upon with dewy eyes by the left of politics:
“New Zealand up until the 1980s was fairly egalitarian, apart from Maori and women, our increasing income gap started in the late 1980s and early 1990s,” says Rashbrooke. “These young club members are the first generation to grow up in a New Zealand really starkly divided by income”.
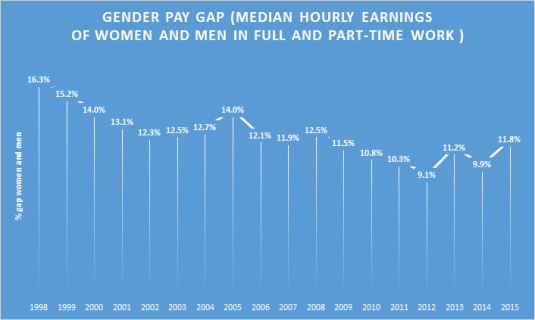
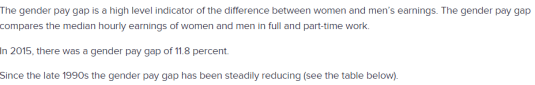
Racism and patriarchy can sit comfortably with a fairly egalitarian society if you are to believe a leading spokesman of the Left. I disagree as would John Rawls with this boy’s own view of trends in New Zealand inequality. Boy’s own because trends in gender inequality are not discussed. No weight is given to the closing of the gender pay gap, a massive increase in female employment and women out-numbering male university new graduates for well over a decade.

Perry (2014) reviews the poverty and inequality data in New Zealand every year for the Ministry of Social Development. He concluded that:
Overall, there is no evidence of any sustained rise or fall in inequality in the last two decades. The level of household disposable income inequality in New Zealand is a little above the OECD median. The share of total income received by the top 1% of individuals is at the low end of the OECD rankings.
As there is no evidence of any sustained rise or fall on inequality New Zealand for the last 20 years, the case for inheritance and wealth taxes simply doesn’t get out of the box.
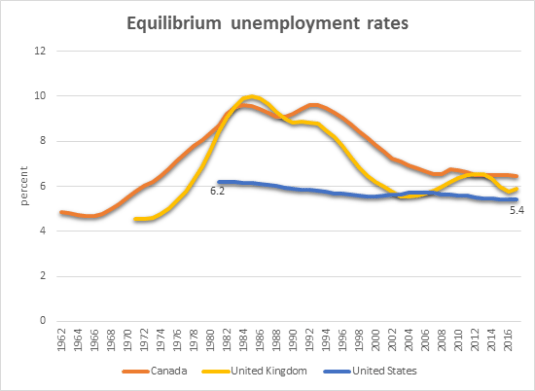
Source: OECD Employment Database.
That case for inheritance and wealth taxes by Max Rashbrooke doesn’t deserve to get into the box to go under starter’s orders if that analysis doesn’t include an analysis of human capital and a gender analysis. For example, male human capital increased by 31% in New Zealand between 1981 and 2001. Over the same period, female human capital increased by 112%. This not insignificant achievement in gender empowerment by capitalism and freedom bears celebration in any discussion of inequality.
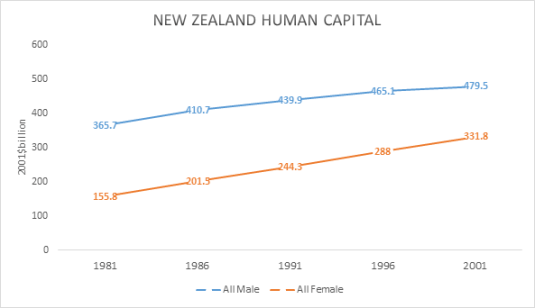
Source: Lˆe Thi. Vˆan Tr`ınh, Estimating the monetary value of the stock of human capital for New Zealand, University of Canterbury PhD thesis (September 2006).
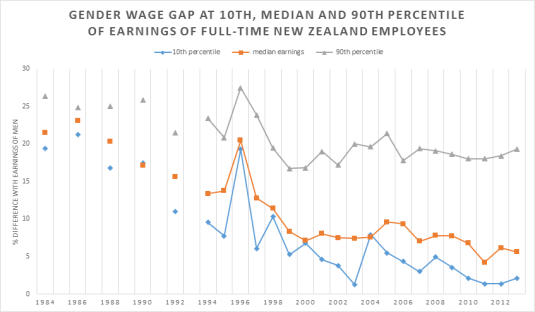
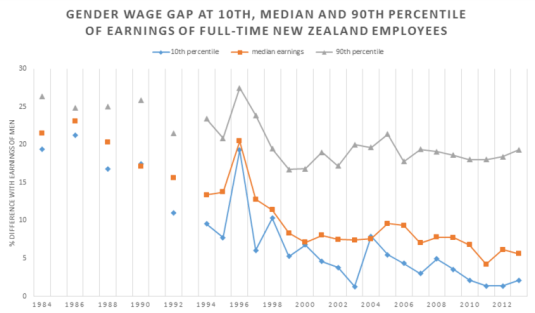
The only group of women for whom the gender pay gap has not all but disappeared over the last 30 years are the top 10% of women. This is the very group that Max Rashbrooke wants to tax heavily to prevent them accumulating and inheriting wealth.
The reason for those taxes on wealth and inheritances on successful women in the professions and business is growth in inequality but there is little to no evidence of that in New Zealand for at least 20 years.
The case of wealth and inheritance taxes as a way of coping with inequality is just not keeping up with recent trends in superstar wealth. New Zealand top 1% is lazy when compared to their more entrepreneurial American brothers.
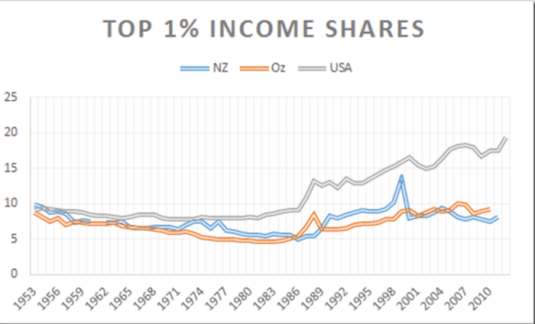
Source: The World Top Incomes Database.
Our local top 1% earns the same share of total income as 30 years ago or even 60 years ago. Any growth in wealth gaps in New Zealand isn’t showing up in top incomes shares.

Source: The World Top Incomes Database.
As for overseas, Piketty and Saez (2003) concluded that a substantial fraction of the rise in top incomes was due to surging top wage incomes. These world-renowned social economists concluded that top executives (the ‘working rich‘) replaced top capital owners (the ‘rentiers’) at the top of the income hierarchy in the USA and Canada. The largest portion of the top incomes comes from earning wages. Top wage earners work for their living founding, building and/or directing successful businesses.


Recent Comments